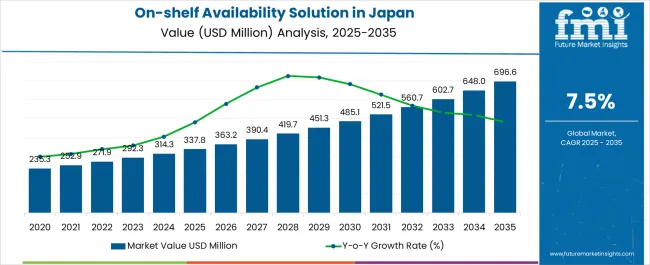
Sales of on-shelf availability solution in Japan are estimated to rise at a 7.9% CAGR through 2034. The overall demand for on-shelf availability solution in Japan is likely to surge considerably, crossing a valuation of USD 313.1 million in 2024. By 2034, sales projections for on-shelf availability solution in Japan indicate attaining a valuation of USD 667.2 million.
Attributes | Details |
---|---|
Industry Size in Japan in 2024 | USD 313.1 million |
Expected Industry Size of Japan by 2034 | USD 667.2 million |
Forecasted CAGR between 2024 to 2034 | 7.9% |
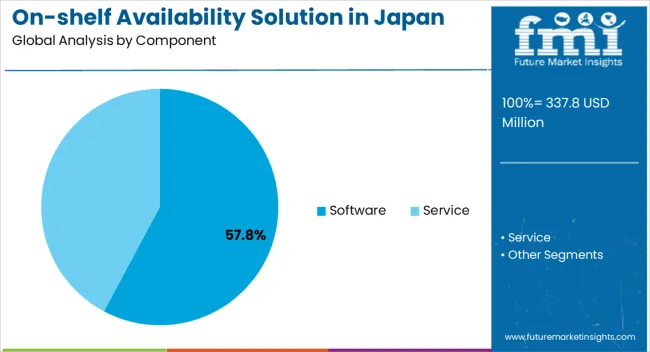
Top Component for On-shelf Availability Solution in Japan | Software |
---|---|
Total Value Share (2024) | 51.20% |
Software is crucial for delivering advanced data analytics capabilities. With the increasing complexity of retail operations, Japan-based firms are turning to digital solutions to evaluate massive amounts of information in real-time. These analytics assist in making informed decisions regarding inventory levels, demand forecasts, and optimizing supply chain processes. The software serves as the foundation for real-time inventory monitoring and visibility. This capability is crucial in dealing with the dynamic nature of customer demands, enabling Japanese merchants to adapt quickly to changes in product popularity and avoid stockouts or overstock problems.
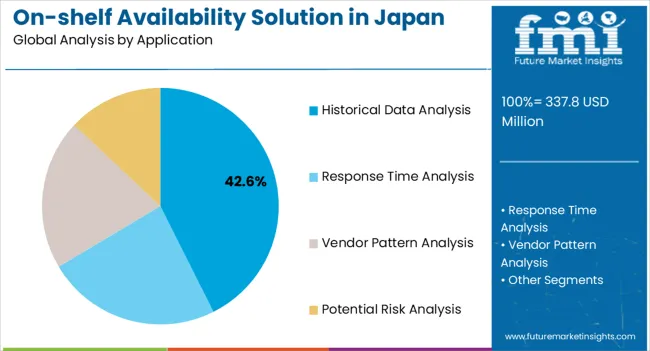
Top Application for On-shelf Availability Solution in Japan | Potential Risk Analysis |
---|---|
Total Value Share (2024) | 28.10% |
Modern technologies, such as IoT devices and artificial intelligence, pose additional risks associated with technology integration. Potential risk analysis helps identify and manage issues connected with incorporating new technologies into current systems without interrupting operations. With an increased reliance on digital technology, the probability of cybersecurity risks has risen. Potential risk analysis involves examining flaws in digital systems, hacking attacks, and other cyber threats to ensure the security and integrity of on-shelf availability solution.
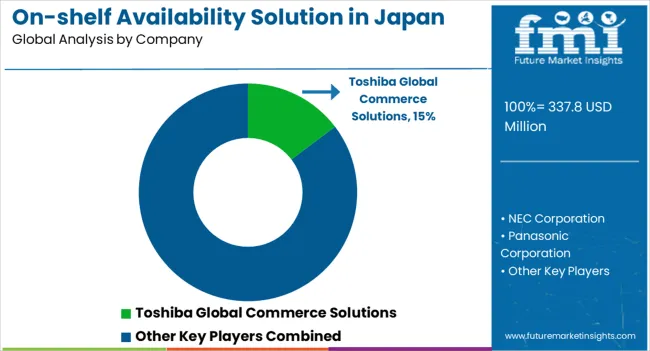
A constantly evolving interplay distinguishes the competitive landscape of on-shelf availability solution industry in Japan between technology vendors, solution developers, and industry-specific integrators. Key competitors in this industry are relentlessly pursuing innovation, with the goal of delivering cutting-edge solutions that meet the complex difficulties inherent in contemporary supply chain management.
The industry is characterized by a mix of established global firms and nimble startups, each fighting for dominance and distinction through technological superiority and strategic collaborations.
Strategies for Key Players to Tap into Potential Growth Opportunities
Recent Developments in On-shelf Availability Solution in Japan
Attribute | Details |
---|---|
Estimated Industry Size in 2024 | USD 313.1 million |
Projected Industry Size by 2034 | USD 667.2 million |
Anticipated CAGR between 2024 to 2034 | 7.9% CAGR |
Historical Analysis of Demand for On-shelf Availability Solution in Japan | 2019 to 2023 |
Demand Forecast for On-shelf Availability Solution in Japan | 2024 to 2034 |
Report Coverage | Industry Size, Industry Trends, Analysis of key factors influencing On-shelf Availability Solution Adoption in Japan, Insights on Global Players and their Industry Strategy in Japan, Ecosystem Analysis of Local and Regional Japan Manufacturers |
Key Cities Analyzed While Studying Opportunities in On-shelf Availability Solution in Japan | Kanto, Chubu, Kinki, Kyushu & Okinawa, Tohoku, Rest of Japan |
Key Companies Profiled | Toshiba Global Commerce Solutions; NEC Corporation; Panasonic Corporation; NCR Corporation; Fujitsu Limited; Omron Corporation; Hitachi, Ltd.; Zebra Technologies Corporation; Denso Corporation; SATO Holdings Corporation; Fanuc Corporation; Brother Industries, Ltd.; TOSHIBA TEC Corporation; CASIO COMPUTER CO., LTD.; Datalogic S.p.A. |
Table 1: Industry Analysis and Outlook Value (US$ Million) Forecast by Region, 2019 to 2034
Table 2: Industry Analysis and Outlook Value (US$ Million) Forecast by Component, 2019 to 2034
Table 3: Industry Analysis and Outlook Value (US$ Million) Forecast by Application, 2019 to 2034
Table 4: Industry Analysis and Outlook Value (US$ Million) Forecast by Deployment Type, 2019 to 2034
Table 5: Industry Analysis and Outlook Value (US$ Million) Forecast by End User, 2019 to 2034
Table 6: Kanto Industry Analysis and Outlook Value (US$ Million) Forecast by Component, 2019 to 2034
Table 7: Kanto Industry Analysis and Outlook Value (US$ Million) Forecast by Application, 2019 to 2034
Table 8: Kanto Industry Analysis and Outlook Value (US$ Million) Forecast by Deployment Type, 2019 to 2034
Table 9: Kanto Industry Analysis and Outlook Value (US$ Million) Forecast by End User, 2019 to 2034
Table 10: Chubu Industry Analysis and Outlook Value (US$ Million) Forecast by Component, 2019 to 2034
Table 11: Chubu Industry Analysis and Outlook Value (US$ Million) Forecast by Application, 2019 to 2034
Table 12: Chubu Industry Analysis and Outlook Value (US$ Million) Forecast by Deployment Type, 2019 to 2034
Table 13: Chubu Industry Analysis and Outlook Value (US$ Million) Forecast by End User, 2019 to 2034
Table 14: Kinki Industry Analysis and Outlook Value (US$ Million) Forecast by Component, 2019 to 2034
Table 15: Kinki Industry Analysis and Outlook Value (US$ Million) Forecast by Application, 2019 to 2034
Table 16: Kinki Industry Analysis and Outlook Value (US$ Million) Forecast by Deployment Type, 2019 to 2034
Table 17: Kinki Industry Analysis and Outlook Value (US$ Million) Forecast by End User, 2019 to 2034
Table 18: Kyushu & Okinawa Industry Analysis and Outlook Value (US$ Million) Forecast by Component, 2019 to 2034
Table 19: Kyushu & Okinawa Industry Analysis and Outlook Value (US$ Million) Forecast by Application, 2019 to 2034
Table 20: Kyushu & Okinawa Industry Analysis and Outlook Value (US$ Million) Forecast by Deployment Type, 2019 to 2034
Table 21: Kyushu & Okinawa Industry Analysis and Outlook Value (US$ Million) Forecast by End User, 2019 to 2034
Table 22: Tohoku Industry Analysis and Outlook Value (US$ Million) Forecast by Component, 2019 to 2034
Table 23: Tohoku Industry Analysis and Outlook Value (US$ Million) Forecast by Application, 2019 to 2034
Table 24: Tohoku Industry Analysis and Outlook Value (US$ Million) Forecast by Deployment Type, 2019 to 2034
Table 25: Tohoku Industry Analysis and Outlook Value (US$ Million) Forecast by End User, 2019 to 2034
Table 26: Rest of Industry Analysis and Outlook Value (US$ Million) Forecast by Component, 2019 to 2034
Table 27: Rest of Industry Analysis and Outlook Value (US$ Million) Forecast by Application, 2019 to 2034
Table 28: Rest of Industry Analysis and Outlook Value (US$ Million) Forecast by Deployment Type, 2019 to 2034
Table 29: Rest of Industry Analysis and Outlook Value (US$ Million) Forecast by End User, 2019 to 2034
Figure 1: Industry Analysis and Outlook Value (US$ Million) by Component, 2024 to 2034
Figure 2: Industry Analysis and Outlook Value (US$ Million) by Application, 2024 to 2034
Figure 3: Industry Analysis and Outlook Value (US$ Million) by Deployment Type, 2024 to 2034
Figure 4: Industry Analysis and Outlook Value (US$ Million) by End User, 2024 to 2034
Figure 5: Industry Analysis and Outlook Value (US$ Million) by Region, 2024 to 2034
Figure 6: Industry Analysis and Outlook Value (US$ Million) Analysis by Region, 2019 to 2034
Figure 7: Industry Analysis and Outlook Value Share (%) and BPS Analysis by Region, 2024 to 2034
Figure 8: Industry Analysis and Outlook Y-o-Y Growth (%) Projections by Region, 2024 to 2034
Figure 9: Industry Analysis and Outlook Value (US$ Million) Analysis by Component, 2019 to 2034
Figure 10: Industry Analysis and Outlook Value Share (%) and BPS Analysis by Component, 2024 to 2034
Figure 11: Industry Analysis and Outlook Y-o-Y Growth (%) Projections by Component, 2024 to 2034
Figure 12: Industry Analysis and Outlook Value (US$ Million) Analysis by Application, 2019 to 2034
Figure 13: Industry Analysis and Outlook Value Share (%) and BPS Analysis by Application, 2024 to 2034
Figure 14: Industry Analysis and Outlook Y-o-Y Growth (%) Projections by Application, 2024 to 2034
Figure 15: Industry Analysis and Outlook Value (US$ Million) Analysis by Deployment Type, 2019 to 2034
Figure 16: Industry Analysis and Outlook Value Share (%) and BPS Analysis by Deployment Type, 2024 to 2034
Figure 17: Industry Analysis and Outlook Y-o-Y Growth (%) Projections by Deployment Type, 2024 to 2034
Figure 18: Industry Analysis and Outlook Value (US$ Million) Analysis by End User, 2019 to 2034
Figure 19: Industry Analysis and Outlook Value Share (%) and BPS Analysis by End User, 2024 to 2034
Figure 20: Industry Analysis and Outlook Y-o-Y Growth (%) Projections by End User, 2024 to 2034
Figure 21: Industry Analysis and Outlook Attractiveness by Component, 2024 to 2034
Figure 22: Industry Analysis and Outlook Attractiveness by Application, 2024 to 2034
Figure 23: Industry Analysis and Outlook Attractiveness by Deployment Type, 2024 to 2034
Figure 24: Industry Analysis and Outlook Attractiveness by End User, 2024 to 2034
Figure 25: Industry Analysis and Outlook Attractiveness by Region, 2024 to 2034
Figure 26: Kanto Industry Analysis and Outlook Value (US$ Million) by Component, 2024 to 2034
Figure 27: Kanto Industry Analysis and Outlook Value (US$ Million) by Application, 2024 to 2034
Figure 28: Kanto Industry Analysis and Outlook Value (US$ Million) by Deployment Type, 2024 to 2034
Figure 29: Kanto Industry Analysis and Outlook Value (US$ Million) by End User, 2024 to 2034
Figure 30: Kanto Industry Analysis and Outlook Value (US$ Million) Analysis by Component, 2019 to 2034
Figure 31: Kanto Industry Analysis and Outlook Value Share (%) and BPS Analysis by Component, 2024 to 2034
Figure 32: Kanto Industry Analysis and Outlook Y-o-Y Growth (%) Projections by Component, 2024 to 2034
Figure 33: Kanto Industry Analysis and Outlook Value (US$ Million) Analysis by Application, 2019 to 2034
Figure 34: Kanto Industry Analysis and Outlook Value Share (%) and BPS Analysis by Application, 2024 to 2034
Figure 35: Kanto Industry Analysis and Outlook Y-o-Y Growth (%) Projections by Application, 2024 to 2034
Figure 36: Kanto Industry Analysis and Outlook Value (US$ Million) Analysis by Deployment Type, 2019 to 2034
Figure 37: Kanto Industry Analysis and Outlook Value Share (%) and BPS Analysis by Deployment Type, 2024 to 2034
Figure 38: Kanto Industry Analysis and Outlook Y-o-Y Growth (%) Projections by Deployment Type, 2024 to 2034
Figure 39: Kanto Industry Analysis and Outlook Value (US$ Million) Analysis by End User, 2019 to 2034
Figure 40: Kanto Industry Analysis and Outlook Value Share (%) and BPS Analysis by End User, 2024 to 2034
Figure 41: Kanto Industry Analysis and Outlook Y-o-Y Growth (%) Projections by End User, 2024 to 2034
Figure 42: Kanto Industry Analysis and Outlook Attractiveness by Component, 2024 to 2034
Figure 43: Kanto Industry Analysis and Outlook Attractiveness by Application, 2024 to 2034
Figure 44: Kanto Industry Analysis and Outlook Attractiveness by Deployment Type, 2024 to 2034
Figure 45: Kanto Industry Analysis and Outlook Attractiveness by End User, 2024 to 2034
Figure 46: Chubu Industry Analysis and Outlook Value (US$ Million) by Component, 2024 to 2034
Figure 47: Chubu Industry Analysis and Outlook Value (US$ Million) by Application, 2024 to 2034
Figure 48: Chubu Industry Analysis and Outlook Value (US$ Million) by Deployment Type, 2024 to 2034
Figure 49: Chubu Industry Analysis and Outlook Value (US$ Million) by End User, 2024 to 2034
Figure 50: Chubu Industry Analysis and Outlook Value (US$ Million) Analysis by Component, 2019 to 2034
Figure 51: Chubu Industry Analysis and Outlook Value Share (%) and BPS Analysis by Component, 2024 to 2034
Figure 52: Chubu Industry Analysis and Outlook Y-o-Y Growth (%) Projections by Component, 2024 to 2034
Figure 53: Chubu Industry Analysis and Outlook Value (US$ Million) Analysis by Application, 2019 to 2034
Figure 54: Chubu Industry Analysis and Outlook Value Share (%) and BPS Analysis by Application, 2024 to 2034
Figure 55: Chubu Industry Analysis and Outlook Y-o-Y Growth (%) Projections by Application, 2024 to 2034
Figure 56: Chubu Industry Analysis and Outlook Value (US$ Million) Analysis by Deployment Type, 2019 to 2034
Figure 57: Chubu Industry Analysis and Outlook Value Share (%) and BPS Analysis by Deployment Type, 2024 to 2034
Figure 58: Chubu Industry Analysis and Outlook Y-o-Y Growth (%) Projections by Deployment Type, 2024 to 2034
Figure 59: Chubu Industry Analysis and Outlook Value (US$ Million) Analysis by End User, 2019 to 2034
Figure 60: Chubu Industry Analysis and Outlook Value Share (%) and BPS Analysis by End User, 2024 to 2034
Figure 61: Chubu Industry Analysis and Outlook Y-o-Y Growth (%) Projections by End User, 2024 to 2034
Figure 62: Chubu Industry Analysis and Outlook Attractiveness by Component, 2024 to 2034
Figure 63: Chubu Industry Analysis and Outlook Attractiveness by Application, 2024 to 2034
Figure 64: Chubu Industry Analysis and Outlook Attractiveness by Deployment Type, 2024 to 2034
Figure 65: Chubu Industry Analysis and Outlook Attractiveness by End User, 2024 to 2034
Figure 66: Kinki Industry Analysis and Outlook Value (US$ Million) by Component, 2024 to 2034
Figure 67: Kinki Industry Analysis and Outlook Value (US$ Million) by Application, 2024 to 2034
Figure 68: Kinki Industry Analysis and Outlook Value (US$ Million) by Deployment Type, 2024 to 2034
Figure 69: Kinki Industry Analysis and Outlook Value (US$ Million) by End User, 2024 to 2034
Figure 70: Kinki Industry Analysis and Outlook Value (US$ Million) Analysis by Component, 2019 to 2034
Figure 71: Kinki Industry Analysis and Outlook Value Share (%) and BPS Analysis by Component, 2024 to 2034
Figure 72: Kinki Industry Analysis and Outlook Y-o-Y Growth (%) Projections by Component, 2024 to 2034
Figure 73: Kinki Industry Analysis and Outlook Value (US$ Million) Analysis by Application, 2019 to 2034
Figure 74: Kinki Industry Analysis and Outlook Value Share (%) and BPS Analysis by Application, 2024 to 2034
Figure 75: Kinki Industry Analysis and Outlook Y-o-Y Growth (%) Projections by Application, 2024 to 2034
Figure 76: Kinki Industry Analysis and Outlook Value (US$ Million) Analysis by Deployment Type, 2019 to 2034
Figure 77: Kinki Industry Analysis and Outlook Value Share (%) and BPS Analysis by Deployment Type, 2024 to 2034
Figure 78: Kinki Industry Analysis and Outlook Y-o-Y Growth (%) Projections by Deployment Type, 2024 to 2034
Figure 79: Kinki Industry Analysis and Outlook Value (US$ Million) Analysis by End User, 2019 to 2034
Figure 80: Kinki Industry Analysis and Outlook Value Share (%) and BPS Analysis by End User, 2024 to 2034
Figure 81: Kinki Industry Analysis and Outlook Y-o-Y Growth (%) Projections by End User, 2024 to 2034
Figure 82: Kinki Industry Analysis and Outlook Attractiveness by Component, 2024 to 2034
Figure 83: Kinki Industry Analysis and Outlook Attractiveness by Application, 2024 to 2034
Figure 84: Kinki Industry Analysis and Outlook Attractiveness by Deployment Type, 2024 to 2034
Figure 85: Kinki Industry Analysis and Outlook Attractiveness by End User, 2024 to 2034
Figure 86: Kyushu & Okinawa Industry Analysis and Outlook Value (US$ Million) by Component, 2024 to 2034
Figure 87: Kyushu & Okinawa Industry Analysis and Outlook Value (US$ Million) by Application, 2024 to 2034
Figure 88: Kyushu & Okinawa Industry Analysis and Outlook Value (US$ Million) by Deployment Type, 2024 to 2034
Figure 89: Kyushu & Okinawa Industry Analysis and Outlook Value (US$ Million) by End User, 2024 to 2034
Figure 90: Kyushu & Okinawa Industry Analysis and Outlook Value (US$ Million) Analysis by Component, 2019 to 2034
Figure 91: Kyushu & Okinawa Industry Analysis and Outlook Value Share (%) and BPS Analysis by Component, 2024 to 2034
Figure 92: Kyushu & Okinawa Industry Analysis and Outlook Y-o-Y Growth (%) Projections by Component, 2024 to 2034
Figure 93: Kyushu & Okinawa Industry Analysis and Outlook Value (US$ Million) Analysis by Application, 2019 to 2034
Figure 94: Kyushu & Okinawa Industry Analysis and Outlook Value Share (%) and BPS Analysis by Application, 2024 to 2034
Figure 95: Kyushu & Okinawa Industry Analysis and Outlook Y-o-Y Growth (%) Projections by Application, 2024 to 2034
Figure 96: Kyushu & Okinawa Industry Analysis and Outlook Value (US$ Million) Analysis by Deployment Type, 2019 to 2034
Figure 97: Kyushu & Okinawa Industry Analysis and Outlook Value Share (%) and BPS Analysis by Deployment Type, 2024 to 2034
Figure 98: Kyushu & Okinawa Industry Analysis and Outlook Y-o-Y Growth (%) Projections by Deployment Type, 2024 to 2034
Figure 99: Kyushu & Okinawa Industry Analysis and Outlook Value (US$ Million) Analysis by End User, 2019 to 2034
Figure 100: Kyushu & Okinawa Industry Analysis and Outlook Value Share (%) and BPS Analysis by End User, 2024 to 2034
Figure 101: Kyushu & Okinawa Industry Analysis and Outlook Y-o-Y Growth (%) Projections by End User, 2024 to 2034
Figure 102: Kyushu & Okinawa Industry Analysis and Outlook Attractiveness by Component, 2024 to 2034
Figure 103: Kyushu & Okinawa Industry Analysis and Outlook Attractiveness by Application, 2024 to 2034
Figure 104: Kyushu & Okinawa Industry Analysis and Outlook Attractiveness by Deployment Type, 2024 to 2034
Figure 105: Kyushu & Okinawa Industry Analysis and Outlook Attractiveness by End User, 2024 to 2034
Figure 106: Tohoku Industry Analysis and Outlook Value (US$ Million) by Component, 2024 to 2034
Figure 107: Tohoku Industry Analysis and Outlook Value (US$ Million) by Application, 2024 to 2034
Figure 108: Tohoku Industry Analysis and Outlook Value (US$ Million) by Deployment Type, 2024 to 2034
Figure 109: Tohoku Industry Analysis and Outlook Value (US$ Million) by End User, 2024 to 2034
Figure 110: Tohoku Industry Analysis and Outlook Value (US$ Million) Analysis by Component, 2019 to 2034
Figure 111: Tohoku Industry Analysis and Outlook Value Share (%) and BPS Analysis by Component, 2024 to 2034
Figure 112: Tohoku Industry Analysis and Outlook Y-o-Y Growth (%) Projections by Component, 2024 to 2034
Figure 113: Tohoku Industry Analysis and Outlook Value (US$ Million) Analysis by Application, 2019 to 2034
Figure 114: Tohoku Industry Analysis and Outlook Value Share (%) and BPS Analysis by Application, 2024 to 2034
Figure 115: Tohoku Industry Analysis and Outlook Y-o-Y Growth (%) Projections by Application, 2024 to 2034
Figure 116: Tohoku Industry Analysis and Outlook Value (US$ Million) Analysis by Deployment Type, 2019 to 2034
Figure 117: Tohoku Industry Analysis and Outlook Value Share (%) and BPS Analysis by Deployment Type, 2024 to 2034
Figure 118: Tohoku Industry Analysis and Outlook Y-o-Y Growth (%) Projections by Deployment Type, 2024 to 2034
Figure 119: Tohoku Industry Analysis and Outlook Value (US$ Million) Analysis by End User, 2019 to 2034
Figure 120: Tohoku Industry Analysis and Outlook Value Share (%) and BPS Analysis by End User, 2024 to 2034
Figure 121: Tohoku Industry Analysis and Outlook Y-o-Y Growth (%) Projections by End User, 2024 to 2034
Figure 122: Tohoku Industry Analysis and Outlook Attractiveness by Component, 2024 to 2034
Figure 123: Tohoku Industry Analysis and Outlook Attractiveness by Application, 2024 to 2034
Figure 124: Tohoku Industry Analysis and Outlook Attractiveness by Deployment Type, 2024 to 2034
Figure 125: Tohoku Industry Analysis and Outlook Attractiveness by End User, 2024 to 2034
Figure 126: Rest of Industry Analysis and Outlook Value (US$ Million) by Component, 2024 to 2034
Figure 127: Rest of Industry Analysis and Outlook Value (US$ Million) by Application, 2024 to 2034
Figure 128: Rest of Industry Analysis and Outlook Value (US$ Million) by Deployment Type, 2024 to 2034
Figure 129: Rest of Industry Analysis and Outlook Value (US$ Million) by End User, 2024 to 2034
Figure 130: Rest of Industry Analysis and Outlook Value (US$ Million) Analysis by Component, 2019 to 2034
Figure 131: Rest of Industry Analysis and Outlook Value Share (%) and BPS Analysis by Component, 2024 to 2034
Figure 132: Rest of Industry Analysis and Outlook Y-o-Y Growth (%) Projections by Component, 2024 to 2034
Figure 133: Rest of Industry Analysis and Outlook Value (US$ Million) Analysis by Application, 2019 to 2034
Figure 134: Rest of Industry Analysis and Outlook Value Share (%) and BPS Analysis by Application, 2024 to 2034
Figure 135: Rest of Industry Analysis and Outlook Y-o-Y Growth (%) Projections by Application, 2024 to 2034
Figure 136: Rest of Industry Analysis and Outlook Value (US$ Million) Analysis by Deployment Type, 2019 to 2034
Figure 137: Rest of Industry Analysis and Outlook Value Share (%) and BPS Analysis by Deployment Type, 2024 to 2034
Figure 138: Rest of Industry Analysis and Outlook Y-o-Y Growth (%) Projections by Deployment Type, 2024 to 2034
Figure 139: Rest of Industry Analysis and Outlook Value (US$ Million) Analysis by End User, 2019 to 2034
Figure 140: Rest of Industry Analysis and Outlook Value Share (%) and BPS Analysis by End User, 2024 to 2034
Figure 141: Rest of Industry Analysis and Outlook Y-o-Y Growth (%) Projections by End User, 2024 to 2034
Figure 142: Rest of Industry Analysis and Outlook Attractiveness by Component, 2024 to 2034
Figure 143: Rest of Industry Analysis and Outlook Attractiveness by Application, 2024 to 2034
Figure 144: Rest of Industry Analysis and Outlook Attractiveness by Deployment Type, 2024 to 2034
Figure 145: Rest of Industry Analysis and Outlook Attractiveness by End User, 2024 to 2034
The expected CAGR until 2034 stands at 7.9%.
The demand for on-shelf availability solution in Japan is projected to reach USD 667.2 million by 2034.
Advanced analytics and AI integration trends influence on-shelf availability solution in Japan.
On-shelf availability solution providers emphasize technological innovations for continued growth.
Software is highly popular in on-shelf availability solution in Japan.
Explore Vertical Solution Insights
Thank you!
You will receive an email from our Business Development Manager. Please be sure to check your SPAM/JUNK folder too.