The global baking and cooking paper market is valued at USD 3.2 billion in 2025 and is set to reach USD 6.8 billion by 2035, recording an absolute increase of USD 3.6 billion over the forecast period. As reported in Future Market Insights (FMI)’s verified packaging intelligence series, covering sustainability and material lifecycle trends, this translates into a total growth of 112.5%, with the market forecast to expand at a compound annual growth rate (CAGR) of 7.9% between 2025 and 2035. The overall market size is expected to grow by approximately 2.1X during the same period, supported by increasing demand for convenient cooking solutions, growing adoption of hygienic food preparation materials, and rising requirements for non-stick baking products across commercial bakeries, home cooking applications, and professional culinary establishments.
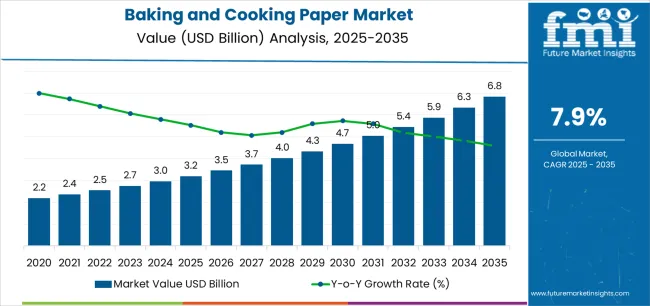
Between 2025 and 2030, the baking and cooking paper market is projected to expand from USD 3.2 billion to USD 4.7 billion, resulting in a value increase of USD 1.5 billion, which represents 41.7% of the total forecast growth for the decade. This phase of development will be shaped by increasing demand for convenient food preparation solutions, rising home baking trends enabling specialized cooking applications, and growing availability of advanced coating technologies across commercial production facilities and specialty paper manufacturing operations.
Between 2030 and 2035, the market is forecast to grow from USD 4.7 billion to USD 6.8 billion, adding another USD 2.1 billion, which constitutes 58.3% of the overall ten-year expansion. This period is expected to be characterized by the advancement of heat-resistant formulations, the integration of biodegradable coating systems for environmental compatibility, and the development of premium release properties across diverse culinary categories. The growing emphasis on food safety standards and professional culinary infrastructure will drive demand for advanced paper varieties with enhanced grease resistance, improved temperature tolerance, and superior non-stick characteristics.
Between 2020 and 2024, the baking and cooking paper market experienced robust growth, driven by increasing consumer demand for home baking solutions and growing recognition of parchment paper's effectiveness in supporting safe food preparation across residential kitchens and commercial bakery operations. The market developed as businesses recognized the potential for baking paper to deliver consistent release performance while meeting modern requirements for heat stability and cost-effective production patterns. Technological advancement in silicone coating processes and fiber composition practices began emphasizing the critical importance of maintaining release quality while enhancing manufacturing efficiency and improving material durability.
| Metric | Value |
|---|---|
| Estimated Value in (2025E) | USD 3.2 billion |
| Forecast Value in (2035F) | USD 6.8 billion |
| Forecast CAGR (2025 to 2035) | 7.9% |
From 2030 to 2035, the market is forecast to grow from USD 4.7 billion to USD 6.8 billion, adding another USD 2.1 billion, which constitutes 58.3% of the overall ten-year expansion. This period is expected to be characterized by the advancement of integrated cutting systems, the integration of pre-cut sheet formats for consumer convenience, and the development of specialized quilted patterns for enhanced absorption applications. The growing emphasis on culinary innovation and professional kitchen equipment will drive demand for premium varieties with enhanced moisture barrier credentials, improved dimensional stability options, and superior performance characteristics.
Between 2020 and 2024, the baking and cooking paper market experienced significant growth, driven by increasing awareness of food contact safety benefits and growing recognition of baking paper's effectiveness in supporting efficient cooking operations across retail segments and foodservice applications. The market developed as users recognized the potential for baking paper to deliver economic advantages while meeting modern requirements for oven compatibility and reliable release practices. Technological advancement in coating uniformity processes and quality control systems began emphasizing the critical importance of maintaining consistent performance while extending usage temperature capabilities and improving customer satisfaction across diverse culinary categories.
Market expansion is being supported by the increasing global demand for hygienic food preparation solutions and the corresponding shift toward disposable cooking materials that can provide superior non-stick characteristics while meeting user requirements for heat resistance and material-efficient production processes. Modern consumers are increasingly focused on incorporating cooking aids that can enhance baking convenience while satisfying demands for consistent, reliably performing products and optimized culinary practices. Baking paper's proven ability to deliver release performance, grease resistance, and diverse application possibilities makes it essential for home bakers and quality-conscious foodservice operators.
The growing emphasis on convenient food preparation and culinary versatility is driving demand for high-performance baking paper systems that can support distinctive recipe execution and comprehensive cooking applications across pastries, roasted vegetables, and confectionery categories. User preference for materials that combine functional excellence with ease of use is creating opportunities for innovative implementations in both traditional and emerging cooking applications. The rising influence of digital recipe platforms and modern kitchen equipment is also contributing to increased adoption of baking paper that can provide authentic performance benefits and reliable cooking characteristics.
The market is segmented by paper type, coating material, format, end-use application, and region. By paper type, the market is divided into bleached paper, unbleached paper, and specialty paper grades. Based on coating material, the market is categorized into silicone coated, wax coated, quilon coated, and uncoated paper. By format, the market includes sheets, rolls, pre-cut sizes, and custom formats. By end-use application, the market encompasses bakery, restaurants & catering, household, confectionery, and other applications. Regionally, the market is divided into North America, Europe, Asia Pacific, Latin America, Middle East & Africa, and other regions.
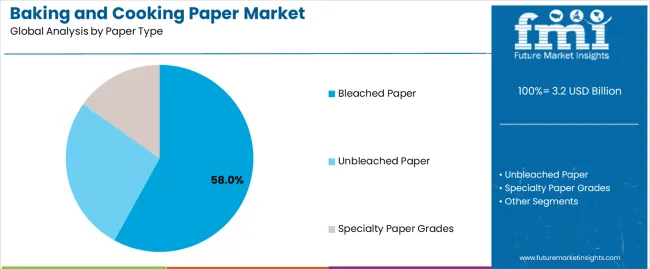
The bleached paper segment is projected to account for 58% of the baking and cooking paper market in 2025, reaffirming its position as the leading product category. Businesses and commercial bakeries increasingly utilize bleached paper for its superior aesthetic appeal characteristics, established consumer acceptance, and essential functionality in diverse cooking applications across multiple culinary categories. Bleached paper's standardized appearance characteristics and proven visual appeal directly address user requirements for reliable food contact materials and optimal presentation value in professional applications.
This product segment forms the foundation of modern baking paper consumption patterns, as it represents the format with the greatest commercial adoption potential and established compatibility across multiple baking systems. Business investments in whiteness standards and brightness consistency continue to strengthen adoption among quality-conscious manufacturers. With users prioritizing visual cleanliness and material purity perception, bleached paper aligns with both aesthetic objectives and performance requirements, making it the central component of comprehensive cooking material strategies.
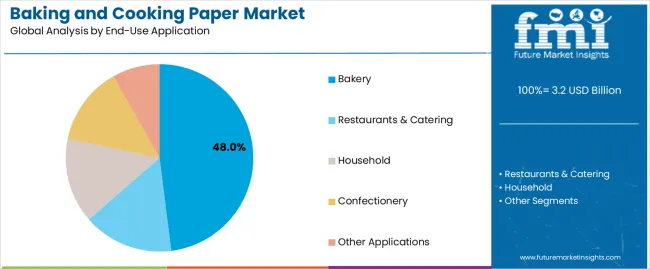
Bakery is projected to represent 48% of the baking and cooking paper market in 2025, underscoring its critical role as the primary application for quality-focused businesses seeking superior release properties and enhanced operational efficiency credentials. Commercial users and bakery operators prefer bakery applications for their established production patterns, proven batch consistency, and ability to maintain exceptional food safety profiles while supporting versatile product offerings during diverse baking experiences. Positioned as essential applications for discerning bakers, bakery offerings provide both production efficiency excellence and product quality advantages.
The segment is supported by continuous improvement in coating technology and the widespread availability of established food safety frameworks that enable regulatory compliance and premium positioning at the commercial level. Additionally, bakery operators are optimizing paper specifications to support production standardization and cost-effective sourcing strategies. As coating technology continues to advance and bakers seek reliable release formats, bakery applications will continue to drive market growth while supporting product consistency and operational reliability strategies.
The baking and cooking paper market is advancing rapidly due to increasing culinary convenience consciousness and growing need for disposable cooking aid choices that emphasize superior release performance outcomes across bakery segments and foodservice applications. However, the market faces challenges, including competition from reusable baking mats, raw material price fluctuations affecting production economics, and manufacturing complexity in achieving uniform coating distribution. Innovation in biodegradable coating integration and advanced paper manufacturing systems continues to influence market development and expansion patterns.
The growing adoption of baking and cooking paper in home baking activities and social recipe sharing is enabling consumers to develop cooking patterns that provide distinctive non-stick benefits while commanding culinary success positioning and enhanced convenience characteristics. Home baking applications provide superior ease-of-use properties while allowing more sophisticated clean-up advantages across various recipe categories. Users are increasingly recognizing the functional advantages of baking paper positioning for premium cooking results and efficiency-conscious kitchen integration.
Modern baking paper manufacturers are incorporating advanced biodegradable coatings, natural fiber compositions, and compostable material systems to enhance environmental credentials, improve disposal outcomes, and meet consumer demands for responsible cooking products. These systems improve ecological effectiveness while enabling new applications, including home composting compatibility and waste reduction programs. Advanced coating integration also allows manufacturers to support environmental leadership positioning and regulatory compliance beyond traditional paper operations.
| Country | CAGR (2025-2035) |
|---|---|
| USA | 7.6% |
| Germany | 7.3% |
| UK | 7.1% |
| China | 8.9% |
| Japan | 6.8% |
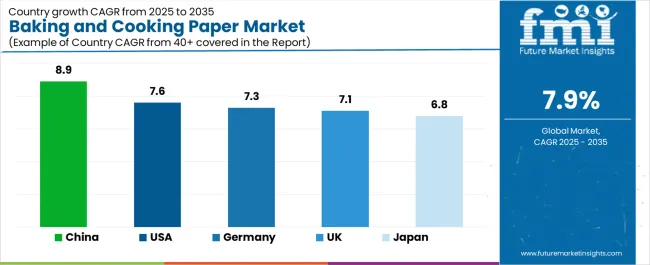
The baking and cooking paper market is experiencing robust growth globally, with China leading at an 8.9% CAGR through 2035, driven by the expanding bakery industry, growing middle-class consumption, and increasing adoption of Western baking practices. The USA follows at 7.6%, supported by rising home baking trends, expanding artisan bakery infrastructure, and growing acceptance of convenient cooking solutions. Germany shows growth at 7.3%, emphasizing established bakery traditions and comprehensive food safety standards. The UK records 7.1%, focusing on premium bakery goods and foodservice expansion. Japan demonstrates 6.8% growth, prioritizing quality culinary materials and technological precision.
The report covers an in-depth analysis of 40+ countries top-performing countries are highlighted below.
Revenue from baking and cooking paper consumption and sales in the USA is projected to exhibit exceptional growth with a CAGR of 7.6% through 2035, driven by the country's rapidly expanding home baking culture, favorable consumer attitudes toward convenient cooking aids, and initiatives promoting culinary creativity across major metropolitan regions. The USA's position as a leading food innovation market and increasing focus on artisan bakery development are creating substantial demand for high-quality baking paper in both commercial and residential markets. Major bakery chains and specialty pastry shops are establishing comprehensive material sourcing capabilities to serve growing demand and emerging culinary opportunities.
Revenue from baking and cooking paper products in Germany is expanding at a CAGR of 7.3%, supported by rising bakery sophistication, growing professional kitchen requirements, and expanding confectionery infrastructure. The country's developing food safety capabilities and increasing commercial investment in advanced baking operations are driving demand for baking paper across both imported and domestically produced applications. International paper companies and domestic manufacturers are establishing comprehensive operational networks to address growing market demand for quality baking paper and efficient cooking materials.
Revenue from baking and cooking paper products in the UK is projected to grow at a CAGR of 7.1% through 2035, supported by the country's mature foodservice market, established bakery culture, and leadership in food safety standards. Britain's sophisticated retail infrastructure and strong support for professional culinary practices are creating steady demand for both traditional and innovative baking paper varieties. Leading bakery chains and specialty patisseries are establishing comprehensive operational strategies to serve both domestic markets and growing export opportunities.
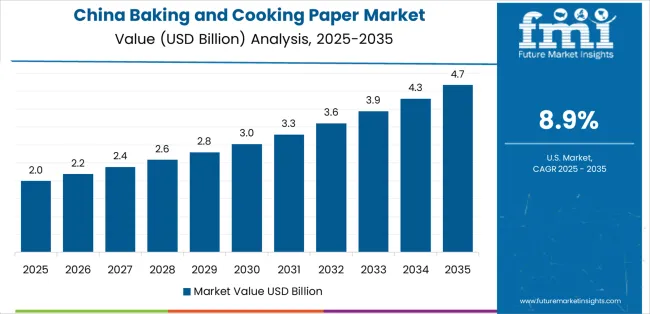
Revenue from baking and cooking paper products in China is projected to grow at a CAGR of 8.9% through 2035, driven by the country's emphasis on bakery modernization, manufacturing leadership, and sophisticated production capabilities for materials requiring specialized coating varieties. Chinese manufacturers and distributors consistently seek commercial-grade cooking paper that enhances product differentiation and supports bakery operations for both traditional and innovative culinary applications. The country's position as an Asian manufacturing leader continues to drive innovation in specialty baking paper applications and commercial production standards.
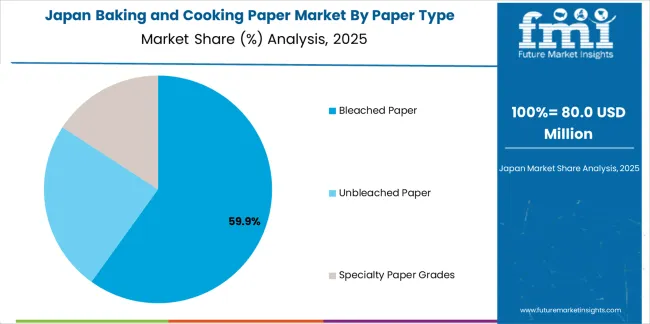
Revenue from baking and cooking paper products in Japan is projected to grow at a CAGR of 6.8% through 2035, supported by the country's emphasis on quality manufacturing, food safety standards, and advanced coating technology integration requiring efficient culinary solutions. Japanese businesses and bakery brands prioritize material performance and manufacturing precision, making baking paper essential for both traditional and modern cooking applications. The country's comprehensive quality excellence and advancing culinary patterns support continued market expansion.
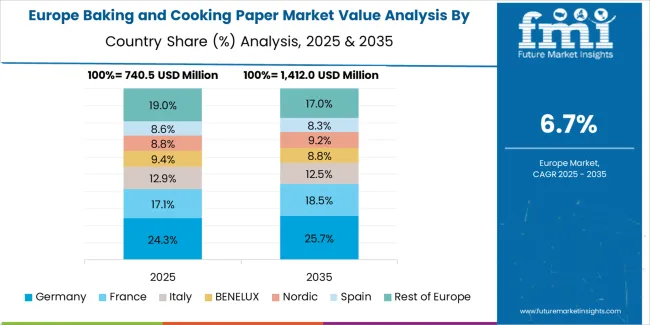
The Europe baking and cooking paper market is projected to grow from USD 1.1 billion in 2025 to USD 2.3 billion by 2035, recording a CAGR of 7.6% over the forecast period. Germany leads the region with a 35.0% share in 2025, moderating slightly to 34.5% by 2035, supported by its strong bakery traditions and demand for premium, food-safe paper products. The United Kingdom follows with 24.0% in 2025, easing to 23.5% by 2035, driven by a sophisticated foodservice market and emphasis on professional culinary standards. France accounts for 20.0% in 2025, rising to 20.5% by 2035, reflecting steady adoption of patisserie applications and artisan baking solutions.
Italy holds 10.0% in 2025, expanding to 10.8% by 2035 as bakery innovation and specialty confectionery applications grow. Spain contributes 6.5% in 2025, growing to 7.0% by 2035, supported by expanding bakery sector and food preparation handling. The Nordic countries rise from 3.0% in 2025 to 3.2% by 2035 on the back of strong food safety adoption and advanced coating technologies. BENELUX remains at 1.5% share across both 2025 and 2035, reflecting mature, quality-focused markets.
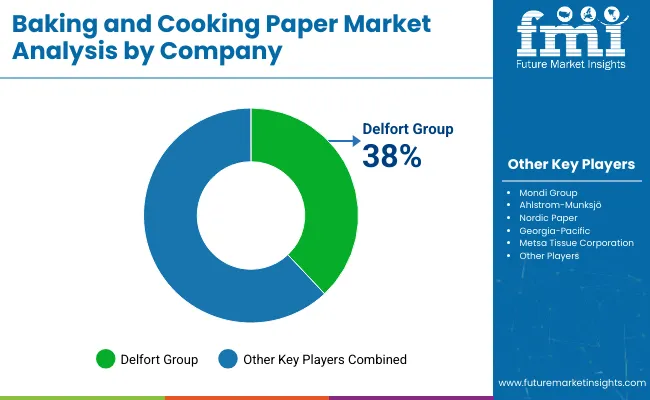
The baking and cooking paper market is characterized by competition among established paper manufacturers, specialized coating companies, and integrated material solution providers. Companies are investing in coating technologies, advanced fiber selection systems, product innovation capabilities, and comprehensive distribution networks to deliver consistent, high-quality, and reliable baking paper systems. Innovation in release enhancement, heat resistance methods, and application-specific product development is central to strengthening market position and customer satisfaction.
Nordic Paper leads the market with a strong focus on specialty paper innovation and comprehensive baking paper solutions, offering commercial material systems with emphasis on manufacturing excellence and coating heritage. Tesco Corporation provides specialized paper capabilities with a focus on retail market applications and consumer packaging networks. Koninklijke Ahrend N.V. delivers integrated paper solutions with a focus on foodservice positioning and operational efficiency. Reynolds Consumer Products specializes in comprehensive household cooking materials with an emphasis on consumer applications. Cheever Specialty Paper Company focuses on comprehensive specialty grades with advanced coating and premium positioning capabilities.
The success of baking and cooking paper in meeting commercial culinary demands, consumer-driven convenience requirements, and performance integration will not only enhance food preparation outcomes but also strengthen global specialty paper manufacturing capabilities. It will consolidate emerging regions' positions as hubs for efficient coating production and align advanced economies with commercial cooking material systems. This calls for a concerted effort by all stakeholders -- governments, industry bodies, manufacturers, distributors, and investors. Each can be a crucial enabler in preparing the market for its next phase of growth.
How Governments Could Spur Local Production and Adoption?
How Industry Bodies Could Support Market Development?
How Distributors and Foodservice Industry Players Could Strengthen the Ecosystem?
How Manufacturers Could Navigate the Shift?
| Items | Values |
|---|---|
| Quantitative Units (2025) | USD 3.2 billion |
| Paper Type | Bleached Paper, Unbleached Paper, Specialty Paper Grades |
| Coating Material | Silicone Coated, Wax Coated, Quilon Coated, Uncoated Paper |
| Format | Sheets, Rolls, Pre-cut Sizes, Custom Formats |
| End-Use Application | Bakery, Restaurants & Catering, Household, Confectionery, Other Applications |
| Regions Covered | North America, Europe, Asia Pacific, Latin America, Middle East & Africa, Other Regions |
| Countries Covered | United States, Germany, United Kingdom, China, Japan, and 40+ countries |
| Key Companies Profiled | Nordic Paper, Tesco Corporation, Koninklijke Ahrend N.V., Reynolds Consumer Products, Cheever Specialty Paper Company, and other leading baking paper companies |
| Additional Attributes | Dollar sales by paper type, coating material, format, end-use application, and region; regional demand trends, competitive landscape, technological advancements in coating engineering, heat resistance integration initiatives, release property enhancement programs, and premium product development strategies |
The global baking and cooking paper market is estimated to be valued at USD 3.2 billion in 2025.
The market size for the baking and cooking paper market is projected to reach USD 6.8 billion by 2035.
The baking and cooking paper market is expected to grow at a 7.9% CAGR between 2025 and 2035.
The key product types in baking and cooking paper market are bleached paper, unbleached paper and specialty paper grades.
In terms of end-use application, bakery segment to command 48.0% share in the baking and cooking paper market in 2025.


Full Research Suite comprises of:
Market outlook & trends analysis
Interviews & case studies
Strategic recommendations
Vendor profiles & capabilities analysis
5-year forecasts
8 regions and 60+ country-level data splits
Market segment data splits
12 months of continuous data updates
DELIVERED AS:
PDF EXCEL ONLINE
Market Share Breakdown of the Baking and Cooking Paper Market
Baking Ingredients Market Size and Share Forecast Outlook 2025 to 2035
Baking Tools Market Size and Share Forecast Outlook 2025 to 2035
Baking Soda Substitute Market Analysis - Size, Share, & Forecast Outlook 2025 to 2035
Baking Paper Market
Baking Molds And Trays Market Size and Share Forecast Outlook 2025 to 2035
Home Baking Ingredients Market Growth - Consumer Trends 2025 to 2035
Alpha-Amylase Baking Enzyme Market Analysis - Size, Share, and Forecast Outlook 2025 to 2035
Android Automotive OS (AAOS) Market Size and Share Forecast Outlook 2025 to 2035
Anderson Cascade Impactor Market Size and Share Forecast Outlook 2025 to 2035
Andersen-Tawil Syndrome Treatment Market Trends - Growth & Future Prospects 2025 to 2035
Andro Supplements Market
Hand Towel Automatic Folding Machine Market Size and Share Forecast Outlook 2025 to 2035
Handheld Ultrasound Scanner Market Size and Share Forecast Outlook 2025 to 2035
Handheld Tagging Gun Market Forecast and Outlook 2025 to 2035
Handheld Imaging Systems Market Size and Share Forecast Outlook 2025 to 2035
Sandwich Panel System Market Size and Share Forecast Outlook 2025 to 2035
Hand Tools Market Size and Share Forecast Outlook 2025 to 2035
Land Survey Equipment Market Size and Share Forecast Outlook 2025 to 2035
Handloom Product Market Size and Share Forecast Outlook 2025 to 2035

Thank you!
You will receive an email from our Business Development Manager. Please be sure to check your SPAM/JUNK folder too.
Chat With
MaRIA