Nutraceutical Packaging Market
Market Insights on Nutraceutical Packaging covering sales outlook, demand forecast & up-to-date key trends
Nutraceutical Packaging Market By Packaging Type (Blisters, Bottles & Jars, Bags & Pouches, Stick Packs, Boxes & Cartons, Containers), Product Form (Tablets & Capsules, Powder & Granules, Liquid, Solid), Material (Glass, Paperboard, Plastic, Aluminum), Product Type (Dietary Supplements, Functional Foods, Functional Beverages) & Region - Forecast 2022 - 2029
Nutraceutical Packaging Market Outlook (2022-2029)
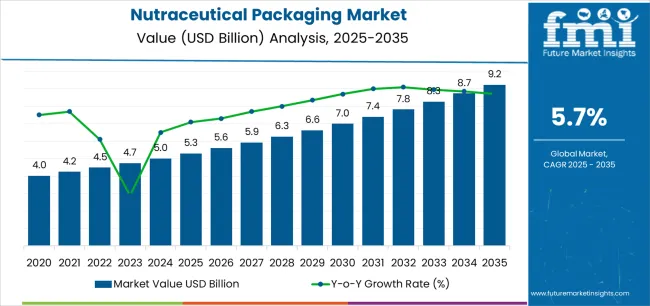
[272 pages Report] Global consumption of nutraceutical packaging currently accounts for a net worth of US$ 3.6 Bn, and is slated to expand at a CAGR of 5.4% to reach a market valuation of US$ 5.2 Bn by 2029.
Nutraceutical Packaging Market Size (2022) |
US$ 3.6 Bn |
Predicted Market Revenue (2029) |
US$ 5.2 Bn |
Forecasted Growth Rate (2022-2029) |
5.4% CAGR |
Product Type with Highest Market Share |
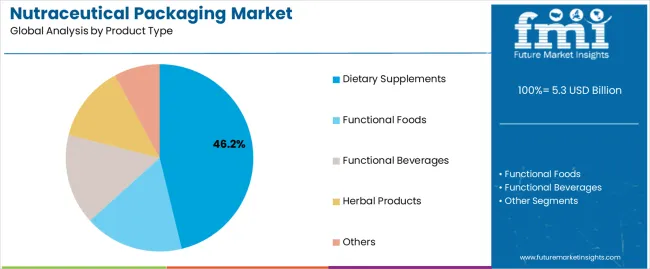
Dietary Supplements – 66.6% |
Substantial rise in health consciousness on a global level has majorly influenced packaging for nutraceuticals as these products are now being served to a larger demographic on a bigger scale than ever before. Developments in the packaging industry and sustainability trends have also shaped the advancements in packaging for nutraceuticals over the past few years.
Let us know your requirement to get
100% FREE customization
Consumption Analysis of Nutraceutical Packaging (2014 to 2021) Vs Market Estimates (2022 to 2029)
Urbanization and digitization have drastically influenced our lifestyles and altered them in ways that have adversely affected the overall health, and this has now become a serious issue due to the rising prevalence of health disorders on a mass scale.
Focus on health and fitness has risen significantly over the past years, and this has driven demand for nutraceuticals on a global scale. As such, nutraceutical packaging consumption rose at a CAGR of 4% from 2014 to 2021.
Emerging economies and developing nations are expected to prove to be the most rewarding markets for nutraceutical packaging suppliers over the coming years. Untapped potential from these markets could boost sales of nutraceutical packaging on a global level.
Packaging for nutraceuticals is anticipated to see major developments due to rising demand for sustainable packaging solutions across the world amidst increasing environmental concerns. Stringent packaging mandates from governments are expected to restrain the market potential to a certain extent.
Rising popularity of preventive healthcare, increasing geriatric population, growing consumption of nutraceuticals by the younger population, rising consumer awareness about packaging trends, increasing per capita disposable income, rising availability & affordability of multiple nutraceutical products, etc., are some of the majordivfactors that are expected to drive shipments of nutraceutical packaging at 5.4% CAGR through 2029.
What is the Regional Outlook for the Nutraceutical Packaging Industry?
This global nutraceutical packaging industry analysis provides detailed insights across multiple geographies such as North America, Latin America, Europe, East Asia, South Asia & Pacific, and the Middle East & Africa (MEA).
The North America market nutraceutical packaging is expected to account for a prominent share in the global landscape. Increasing awareness about health and fitness is expected to be a major trend propelling demand for nutraceutical packaging over the forecast period.
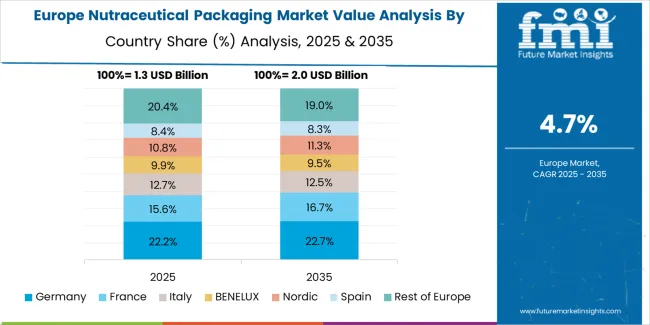
The European nutraceutical packaging market is also predicted to hold a significant market share over the forecast. Nutraceutical packaging demand in the region is expected to be driven by factors such as increasing consumption of nutritional supplements, rising focus on health & fitness, rising prevalence of health disorders due to bad lifestyle habits and poor nutritional choices.
Demand for nutraceutical packaging in East Asia is expected to have a prominent impact on the global market landscape over the forecast period. A highly fragmented market landscape in East Asia makes it a lucrative region for nutraceutical packaging manufacturers. Moreover, rising per capita disposable income of the population in the region coupled with increasing health & fitness awareness is expected to boost sales of nutraceutical packaging.
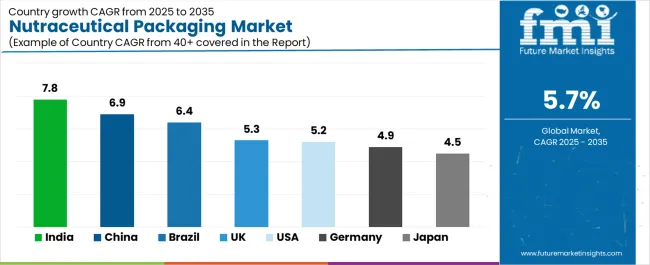
India and China are expected to be prominent markets for nutraceutical packaging over the forecast period owing to changing lifestyle trends in these countries.
Country-wise Analysis
Why the U.S. is a Highly Lucrative Market for Nutraceutical Packaging Vendors?
“Changing Health Preferences to Provide Opportunities for Nutraceutical Packaging Companies”
Nutraceutical packaging demand in the U.S. is majorly driven by increasing health consciousness and changing consumer preference towards more healthy products. Increasing demand for natural and organic nutrition is also set to influence nutraceutical packaging consumption over the forecast period.
The nation has seen a massive change in the sales trend of dietary supplements, nutritional supplements, vitamin supplements, mineral supplements, etc., and this has subsequently shaped nutraceutical packaging demand. High consumer spending potential in the U.S. favors the nutraceutical industry, in turn driving the sales of nutraceutical packaging in the nation, and this is expected to be a prominent factor throughout the forecast period.
What is the Outlook for Nutraceutical Packaging in India?
“Nutraceutical Packaging Companies to Benefit from Increasing Consumer Product Awareness”
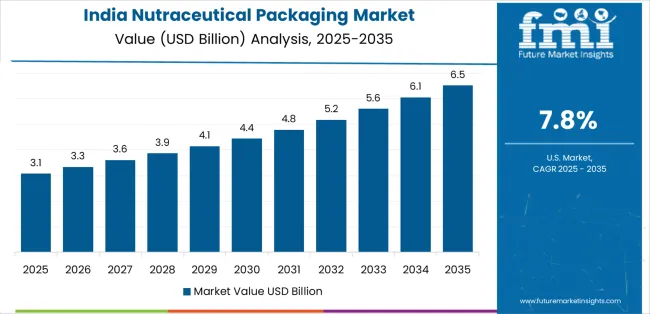
India, the second-most populated country in the world, offers a lucrative setting and is one of the most important markets in the world. Nutraceutical packaging shipments in India are predicted to rise at a good pace from 2022 to 2029.
Increase in demand for nutraceutical packaging can be attributed to rising nutraceutical consumption, on the back of factors such as increasing per capita disposable income, rising purchasing power, increasing awareness for preventive healthcare, etc.
The developmental nature of the Indian economy provides a lucrative setting for nutraceutical packaging companies, and is expected to emerge as one of the most important markets in the global landscape by 2029.
Find your sweet spots for generating winning opportunities in this market.
Talk to AnalystCategory-wise Analysis
Which Product Type Drives Most Consumption of Nutraceutical Packaging?
“Dietary Supplement Packaging to Have Dominant Outlook”
There has been a substantial increase in consumption of dietary supplements by the population across the world and this can be attributed to changing lifestyle trends across the world. Urbanization and digitization have fundamentally changed our lifestyles and the induction of poor eating habits has largely affected the collective health trends of the world population.
Dietary supplements help people balance their intake of nutrition that they miss out on due to poor lifestyle choices and improper eating habits. Dietary supplement packaging holds a dominant market share of 66.6% in the global nutraceutical packaging marketplace.
COVID-19 Crisis Evaluation
There was steady growth observed in the nutraceutical packaging market in the pre-pandemic era, and this growth was disrupted by the COVID-19 pandemic in 2020. The pandemic affected the world in many different aspects and most economies took a major hit during this period.
Increased focus on immunity during the pandemic propelled demand for vitamin supplements, and this substantially impacted nutraceutical packaging shipments. However, due to restricted manufacturing activity and disruptions to supply chains, sales of nutraceutical packaging were impacted negatively and saw a drop in 2020.
This is expected to change in the post-pandemic era as the world returns to normal and manufacturing facilities come back to their full production potential. As people are now more aware of their health and fitness, it is expected to propel demand for packaging for nutraceuticals on a global level.
Nutraceutical packaging consumption is expected to see an increase for dietary supplements, vitamin supplements, etc., especially due to rising use of nutraceuticals by the younger population across the world.

An unified Market Research Subscription Platform, built for today’s disparate research needs.
Competitive Landscape
Nutraceutical packaging manufacturers are focusing on new product launches to expand their product portfolios and boost sales across various regions. Nutraceutical packaging companies are also investing in mergers & acquisitions to increase their market share in the global landscape.
- In April 2021, Origin Pharma Packaging, a leading name in the pharmaceutical packaging industry, announced the launch of its new packaging design agency for its nutraceutical businesses. Design Innovation Development (DiD) will be working with international firms as well as local businesses to provide customized packaging solutions.
- In September 2021, a U.K.-based nutricosmetics and supplements company called HEBE LIFE featured its products in a new packaging format. The new tamper-evident label is equipped with a QR code that enables product authentication, geolocation tracking, anti-counterfeiting, and band protection, and delivers a packaging solution for smart consumers.
Nutraceutical Packaging Industry Report Scope
Attribute |
Details |
Forecast Period |
2022-2029 |
Historical Data Available for |
2014-2021 |
Market Analysis |
US$ Mn for Value |
Key Regions Covered |
|
Key Countries Covered |
|
Key Market Segments Covered |
|
Key Companies Profiled |
|
Pricing |
Available upon Request |
Key Segments of Nutraceutical Packaging Industry Survey
By Packaging Type:
- Blisters
- Bottles & Jars
- Bags & Pouches
- Stick Packs
- Boxes & Cartons
- Containers
- Sprays
- VSP & MAP
By Product Type:
- Nutraceutical Packaging for Dietary Supplements
- Nutraceutical Packaging for Functional Foods
- Nutraceutical Packaging for Functional Beverages
By Product Form:
- Tablets & Capsules
- Powder & Granules
- Liquid
- Solid
By Material:
- Glass Nutraceutical Packaging
- Paperboard Nutraceutical Packaging
- Plastic Nutraceutical Packaging
- Aluminium Nutraceutical Packaging
By Ingredient:
- Vitamins
- Minerals
- Prebiotics
- Probiotics
- Amino Acids
- Omega 3 Fatty Acids
- Others
By Region:
- North America Nutraceutical Packaging Market
- Latin America Nutraceutical Packaging Market
- Europe Nutraceutical Packaging Market
- East Asia Nutraceutical Packaging Market
- South Asia & Pacific Nutraceutical Packaging Market
- Middle East & Africa (MEA) Nutraceutical Packaging Market
Frequently Asked Questions
In 2022, the global nutraceutical packaging market is set to be worth US$ 3.6 Bn.
Nutraceutical packaging sales are projected to attain an estimated worth of US$ 5.2 Bn by the end of 2029.
Key nutraceutical packaging companies such as Alpha Packaging, Amcor Limited, Gerresheimer AG, Mondi Plc., RPC Group, Graham Packaging Company, Sonoco Products Company, Constantia Flexible Group GmbH, ALPLA Werke Alwin Lehner GmbH & Co KG, and Flex-pack are profiled in this research report.
As per this nutraceutical packaging research analysis, how did the market perform from 2014 to 2021?
The nutraceutical packaging market depicted expansion at a CAGR of 4% from 2014 to 2021.
The nutraceutical packaging market is predicted to progress at a CAGR of 5.4% from 2022 to 2029.
1. Executive Summary
1.1. Global Market Outlook
1.2. Demand Side Trends
1.3. Supply Side Trends
1.4. Analysis and Recommendations
2. Market Overview
2.1. Market Taxonomy
2.2. Market Definition
3. Key Market Trends
3.1. Key Trends Impacting the Market
3.2. Product Innovation
4. Global Nutraceutical Packaging Market Demand Analysis 2014-2021 and Forecast, 2022-2029
4.1. Historical Market Value (US$ Mn) & Volume (Tons) Analysis, 2014-2021
4.2. Current and Future Market Value (US$ Mn) & Volume (Tons) Projections, 2022-2029
4.3. Y-o-Y Growth Trend Analysis
5. Global Nutraceutical Packaging Market - Pricing Analysis
5.1. Regional Pricing Analysis
5.2. Global Average Pricing Analysis Benchmark
6. Market Background
6.1. Macro-Economic Factors
6.1.1. GDP Growth
6.1.2. Manufacturing Value Added growth
6.1.3. Packaging Industry Growth
6.2. Forecast Factors - Relevance & Impact
6.2.1. Global Packaging Market Outlook
6.2.2. Global Flexible Packaging Market Outlook
6.2.3. Global Nutraceutical Market Outlook
6.2.4. Consumer Preference Analysis
6.2.5. Key Regulations
6.3. Value Chain
6.3.1. Key Participants
6.3.1.1. Raw Material Suppliers
6.3.1.2. Nutraceutical Packaging Manufacturers
6.3.1.3. End Users
6.3.2. Profitability Margin
6.4. Market Dynamics
6.4.1. Drivers
6.4.2. Restraints
6.4.3. Opportunity Analysis
7. Global Nutraceutical Packaging Market Analysis 2014-2021 and Forecast 2022-2029, by Packaging Type
7.1. Introduction
7.2. Historical Market Size (US$ Mn) and Volume (Tons) Analysis By Packaging Type, 2014-2021
7.3. Current and Future Market Size (US$ Mn) and Volume (Tons) Analysis and Forecast By Packaging Type, 2022-2029
7.3.1. Blister
7.3.2. Bottles and Jars
7.3.3. Bags and Pouches
7.3.4. Stick Packs
7.3.5. Boxes and Cartons
7.3.6. Container
7.3.7. Sprays
7.3.8. VSP and MAP
7.4. Market Attractiveness Analysis By Packaging Type
8. Global Nutraceutical Packaging Market Analysis 2014-2021 and Forecast 2022-2029, by Material
8.1. Introduction
8.2. Historical Market Size (US$ Mn) and Volume (Tons) Analysis By Material, 2014-2021
8.3. Current and Future Market Size (US$ Mn) and Volume (Tons) Analysis and Forecast By Material, 2022-2029
8.3.1. Glass
8.3.2. Paper and Paperboard
8.3.3. Plastics
8.3.3.1. PET
8.3.3.2. PE
8.3.3.2.1. HDPE
8.3.3.2.2. LDPE
8.3.3.2.3. LLDPE
8.3.3.3. PP
8.3.3.4. Others
8.3.4. Aluminium
8.4. Market Attractiveness Analysis By Material
9. Global Nutraceutical Packaging Market Analysis 2014-2021 and Forecast 2022-2029, by Product Form
9.1. Introduction
9.2. Historical Market Size (US$ Mn) and Volume (Tons) Analysis By Product Form, 2014-2021
9.3. Current and Future Market Size (US$ Mn) and Volume (Tons) Analysis and Forecast By Product Form, 2022-2029
9.3.1. Tablets and Capsules
9.3.2. Powder and Granules
9.3.3. Liquid
9.3.4. Solids
9.4. Market Attractiveness Analysis By Product Form
10. Global Nutraceutical Packaging Market Analysis 2014-2021 and Forecast 2022-2029, by Product Type
10.1. Introduction
10.2. Historical Market Size (US$ Mn) and Volume (Tons) Analysis By Product Type, 2014-2021
10.3. Current and Future Market Size (US$ Mn) and Volume (Tons) Analysis and Forecast By Product Type, 2022-2029
10.3.1. Dietary Supplements
10.3.2. Functional Food
10.3.3. Functional Beverages
10.4. Market Attractiveness Analysis By Product Type
11. Global Nutraceutical Packaging Market Analysis 2014-2021 and Forecast 2022-2029, by Ingredient
11.1. Introduction
11.2. Historical Market Size (US$ Mn) and Volume (Tons) Analysis By Ingredient, 2014-2021
11.3. Current and Future Market Size (US$ Mn) and Volume (Tons) Analysis and Forecast By Ingredient, 2022-2029
11.3.1. Vitamin
11.3.2. Minerals
11.3.3. Prebiotics
11.3.4. Probiotics
11.3.5. Amino Acids
11.3.6. Omega 3 Fatty Acids
11.3.7. Others
11.4. Market Attractiveness Analysis By Ingredient
12. Global Nutraceutical Packaging Market Analysis 2014-2021 and Forecast 2022-2029, by Region
12.1. Introduction
12.2. Historical Market Size (US$ Mn) and Volume (Tons) Analysis By Region, 2014-2021
12.3. Current Market Size (US$ Mn) and Volume (Tons) Analysis and Forecast By Region, 2022-2029
12.3.1. North America
12.3.2. Latin America
12.3.3. Europe
12.3.4. South Asia
12.3.5. East Asia
12.3.6. Oceania
12.3.7. Middle East and Africa (MEA)
12.4. Market Attractiveness Analysis By Region
13. North America Nutraceutical Packaging Market Analysis 2014-2021 and Forecast 2022-2029
13.1. Introduction
13.2. Historical Market Size (US$ Mn) and Volume (Tons) Trend Analysis By Market Taxonomy, 2014-2021
13.3. Market Size (US$ Mn) and Volume (Tons) Forecast By Market Taxonomy, 2022-2029
13.3.1. By Country
13.3.1.1. U.S.
13.3.1.2. Canada
13.3.2. By Packaging Type
13.3.3. By Product Form
13.3.4. By Product Type
13.3.5. By Material
13.3.6. By Ingredient
13.4. Market Attractiveness Analysis
13.4.1. By Country
13.4.2. By Packaging Type
13.4.3. By Product Form
13.4.4. By Product Type
13.4.5. By Material
13.4.6. By Ingredient
13.5. Market Trends
14. Latin America Nutraceutical Packaging Market Analysis 2014-2021 and Forecast 2022-2029
14.1. Introduction
14.2. Historical Market Size (US$ Mn) and Volume (Tons) Trend Analysis By Market Taxonomy, 2014-2021
14.3. Market Size (US$ Mn) and Volume (Tons) Forecast By Market Taxonomy, 2022-2029
14.3.1. By Country
14.3.1.1. Brazil
14.3.1.2. Mexico
14.3.1.3. Rest of Latin America
14.3.2. By Packaging Type
14.3.3. By Product Form
14.3.4. By Product Type
14.3.5. By Material
14.3.6. By Ingredient
14.4. Market Attractiveness Analysis
14.4.1. By Country
14.4.2. By Packaging Type
14.4.3. By Product Form
14.4.4. By Product Type
14.4.5. By Material
14.4.6. By Ingredient
14.5. Market Trends
15. Europe Nutraceutical Packaging Market Analysis 2014-2021 and Forecast 2022-2029
15.1. Introduction
15.2. Historical Market Size (US$ Mn) and Volume (Tons) Trend Analysis By Market Taxonomy, 2014-2021
15.3. Market Size (US$ Mn) and Volume (Tons) Forecast By Market Taxonomy, 2022-2029
15.3.1. By Country
15.3.1.1. Germany
15.3.1.2. Italy
15.3.1.3. France
15.3.1.4. U.K.
15.3.1.5. Spain
15.3.1.6. Nordic
15.3.1.7. BENELUX
15.3.1.8. Russia
15.3.1.9. Poland
15.3.1.10. Rest of Europe
15.3.2. By Packaging Type
15.3.3. By Product Form
15.3.4. By Product Type
15.3.5. By Material
15.3.6. By Ingredient
15.4. Market Attractiveness Analysis
15.4.1. By Country
15.4.2. By Packaging Type
15.4.3. By Product Form
15.4.4. By Product Type
15.4.5. By Material
15.4.6. By Ingredient
15.5. Market Trends
16. South Asia Nutraceutical Packaging Market Analysis 2014-2021 and Forecast 2022-2029
16.1. Introduction
16.2. Historical Market Size (US$ Mn) and Volume (Tons) Trend Analysis By Market Taxonomy, 2014-2021
16.3. Market Size (US$ Mn) and Volume (Tons) Forecast By Market Taxonomy, 2022-2029
16.3.1. By Country
16.3.1.1. India
16.3.1.2. Thailand
16.3.1.3. Indonesia
16.3.1.4. Malaysia
16.3.1.5. Rest of South Asia
16.3.2. By Packaging Type
16.3.3. By Product Form
16.3.4. By Product Type
16.3.5. By Material
16.3.6. By Ingredient
16.4. Market Attractiveness Analysis
16.4.1. By Country
16.4.2. By Packaging Type
16.4.3. By Product Form
16.4.4. By Product Type
16.4.5. By Material
16.4.6. By Ingredient
16.5. Market Trends
17. East Asia Nutraceutical Packaging Market Analysis 2014-2021 and Forecast 2022-2029
17.1. Introduction
17.2. Historical Market Size (US$ Mn) and Volume (Tons) Trend Analysis By Market Taxonomy, 2014-2021
17.3. Market Size (US$ Mn) and Volume (Tons) Forecast By Market Taxonomy, 2022-2029
17.3.1. By Country
17.3.1.1. China
17.3.1.2. Japan
17.3.1.3. South Korea
17.3.2. By Packaging Type
17.3.3. By Product Form
17.3.4. By Product Type
17.3.5. By Material
17.3.6. By Ingredient
17.4. Market Attractiveness Analysis
17.4.1. By Country
17.4.2. By Packaging Type
17.4.3. By Product Form
17.4.4. By Product Type
17.4.5. By Material
17.4.6. By Ingredient
17.5. Market Trends
18. Oceania Nutraceutical Packaging Market Analysis 2014-2021 and Forecast 2022-2029
18.1. Introduction
18.2. Historical Market Size (US$ Mn) and Volume (Tons) Trend Analysis By Market Taxonomy, 2014-2021
18.3. Market Size (US$ Mn) and Volume (Tons) Forecast By Market Taxonomy, 2022-2029
18.3.1. By Country
18.3.1.1. Australia
18.3.1.2. New Zealand
18.3.2. By Packaging Type
18.3.3. By Product Form
18.3.4. By Product Type
18.3.5. By Material
18.3.6. By Ingredient
18.4. Market Attractiveness Analysis
18.4.1. By Country
18.4.2. By Packaging Type
18.4.3. By Product Form
18.4.4. By Product Type
18.4.5. By Material
18.4.6. By Ingredient
18.5. Market Trends
19. Middle East and Africa Nutraceutical Packaging Market Analysis 2014-2021 and Forecast 2022-2029
19.1. Introduction
19.2. Historical Market Size (US$ Mn) and Volume (Tons) Trend Analysis By Market Taxonomy, 2014-2021
19.3. Market Size (US$ Mn) and Volume (Tons) Forecast By Market Taxonomy, 2022-2029
19.3.1. By Country
19.3.1.1. GCC Countries
19.3.1.2. Turkey
19.3.1.3. Northern Africa
19.3.1.4. South Africa
19.3.1.5. Rest of Middle East and Africa
19.3.2. By Packaging Type
19.3.3. By Product Form
19.3.4. By Product Type
19.3.5. By Material
19.3.6. By Ingredient
19.4. Market Attractiveness Analysis
19.4.1. By Country
19.4.2. By Packaging Type
19.4.3. By Product Form
19.4.4. By Product Type
19.4.5. By Material
19.4.6. By Ingredient
19.5. Market Trends
20. Emerging Countries Nutraceutical Packaging Market Analysis 2014-2021 and Forecast 2022-2029
20.1. Introduction
20.1.1. Market Value Proportion Analysis, By Key Countries
20.1.2. Global Vs. Country Growth Comparison
20.2. China Nutraceutical Packaging Market Analysis
20.2.1. Introduction
20.2.2. Market Volume (Tons) and Value (US$ Mn) Analysis and Forecast by Market Taxonomy
20.2.2.1. By Packaging Type
20.2.2.2. By Product Form
20.2.2.3. By Product Type
20.2.2.4. By Material
20.2.2.5. By Ingredient
20.3. India Nutraceutical Packaging Market Analysis
20.3.1. Introduction
20.3.2. Market Volume (Tons) and Value (US$ Mn) Analysis and Forecast by Market Taxonomy
20.3.2.1. By Packaging Type
20.3.2.2. By Product Form
20.3.2.3. By Product Type
20.3.2.4. By Material
20.3.2.5. By Ingredient
21. Market Structure Analysis
21.1. Market Analysis by Tier of Companies
21.2. Market Concentration
21.3. Market Share Analysis of Top Players
22. Competition Analysis
22.1. Competition Dashboard
22.2. Competition Deep Dive
22.2.1. Alpha Packaging.
22.2.1.1. Overview
22.2.1.2. Product Portfolio
22.2.1.3. Profitability by Market Segments
22.2.1.4. Sales Footprint
22.2.1.5. Strategy Overview
22.2.1.5.1. Marketing Strategy
22.2.1.5.2. Product Strategy
22.2.1.5.3. Channel Strategy
22.2.2. Amcor Limited
22.2.2.1. Overview
22.2.2.2. Product Portfolio
22.2.2.3. Profitability by Market Segments
22.2.2.4. Sales Footprint
22.2.2.5. Strategy Overview
22.2.2.5.1. Marketing Strategy
22.2.2.5.2. Product Strategy
22.2.2.5.3. Channel Strategy
22.2.3. Gerresheimer AG
22.2.3.1. Overview
22.2.3.2. Product Portfolio
22.2.3.3. Profitability by Market Segments
22.2.3.4. Sales Footprint
22.2.3.5. Strategy Overview
22.2.3.5.1. Marketing Strategy
22.2.3.5.2. Product Strategy
22.2.3.5.3. Channel Strategy
22.2.4. Mondi Plc.
22.2.4.1. Overview
22.2.4.2. Product Portfolio
22.2.4.3. Profitability by Market Segments
22.2.4.4. Sales Footprint
22.2.4.5. Strategy Overview
22.2.4.5.1. Marketing Strategy
22.2.4.5.2. Product Strategy
22.2.4.5.3. Channel Strategy
22.2.5. RPC Group
22.2.5.1. Overview
22.2.5.2. Product Portfolio
22.2.5.3. Profitability by Market Segments
22.2.5.4. Sales Footprint
22.2.5.5. Strategy Overview
22.2.5.5.1. Marketing Strategy
22.2.5.5.2. Product Strategy
22.2.5.5.3. Channel Strategy
22.2.6. Graham Packaging Company
22.2.6.1. Overview
22.2.6.2. Product Portfolio
22.2.6.3. Profitability by Market Segments
22.2.6.4. Sales Footprint
22.2.6.5. Strategy Overview
22.2.6.5.1. Marketing Strategy
22.2.6.5.2. Product Strategy
22.2.6.5.3. Channel Strategy
22.2.7. Sonoco Products Company
22.2.7.1. Overview
22.2.7.2. Product Portfolio
22.2.7.3. Profitability by Market Segments
22.2.7.4. Sales Footprint
22.2.7.5. Strategy Overview
22.2.7.5.1. Marketing Strategy
22.2.7.5.2. Product Strategy
22.2.7.5.3. Channel Strategy
22.2.8. Constantia Flexible Group GmbH
22.2.8.1. Overview
22.2.8.2. Product Portfolio
22.2.8.3. Profitability by Market Segments
22.2.8.4. Sales Footprint
22.2.8.5. Strategy Overview
22.2.8.5.1. Marketing Strategy
22.2.8.5.2. Product Strategy
22.2.8.5.3. Channel Strategy
22.2.9. ALPLA Werke Alwin Lehner GmbH & Co KG
22.2.9.1. Overview
22.2.9.2. Product Portfolio
22.2.9.3. Profitability by Market Segments
22.2.9.4. Sales Footprint
22.2.9.5. Strategy Overview
22.2.9.5.1. Marketing Strategy
22.2.9.5.2. Product Strategy
22.2.9.5.3. Channel Strategy
22.2.10. Flex-pack
22.2.10.1. Overview
22.2.10.2. Product Portfolio
22.2.10.3. Profitability by Market Segments
22.2.10.4. Sales Footprint
22.2.10.5. Strategy Overview
22.2.10.5.1. Marketing Strategy
22.2.10.5.2. Product Strategy
22.2.10.5.3. Channel Strategy
22.2.11. Law Print & Packaging Management Ltd
22.2.11.1. Overview
22.2.11.2. Product Portfolio
22.2.11.3. Profitability by Market Segments
22.2.11.4. Sales Footprint
22.2.11.5. Strategy Overview
22.2.11.5.1. Marketing Strategy
22.2.11.5.2. Product Strategy
22.2.11.5.3. Channel Strategy
22.2.12. American Nutritional Corporation
22.2.12.1. Overview
22.2.12.2. Product Portfolio
22.2.12.3. Profitability by Market Segments
22.2.12.4. Sales Footprint
22.2.12.5. Strategy Overview
22.2.12.5.1. Marketing Strategy
22.2.12.5.2. Product Strategy
22.2.12.5.3. Channel Strategy
22.2.13. Wasdell Packaging Group
22.2.13.1. Overview
22.2.13.2. Product Portfolio
22.2.13.3. Profitability by Market Segments
22.2.13.4. Sales Footprint
22.2.13.5. Strategy Overview
22.2.13.5.1. Marketing Strategy
22.2.13.5.2. Product Strategy
22.2.13.5.3. Channel Strategy
22.2.14. PontEurope
22.2.14.1. Overview
22.2.14.2. Product Portfolio
22.2.14.3. Profitability by Market Segments
22.2.14.4. Sales Footprint
22.2.14.5. Strategy Overview
22.2.14.5.1. Marketing Strategy
22.2.14.5.2. Product Strategy
22.2.14.5.3. Channel Strategy
22.2.15. Arizona Nutritional Supplements, LLC.
22.2.15.1. Overview
22.2.15.2. Product Portfolio
22.2.15.3. Profitability by Market Segments
22.2.15.4. Sales Footprint
22.2.15.5. Strategy Overview
22.2.15.5.1. Marketing Strategy
22.2.15.5.2. Product Strategy
22.2.15.5.3. Channel Strategy
22.2.16. Comar
22.2.16.1. Overview
22.2.16.2. Product Portfolio
22.2.16.3. Profitability by Market Segments
22.2.16.4. Sales Footprint
22.2.16.5. Strategy Overview
22.2.16.5.1. Marketing Strategy
22.2.16.5.2. Product Strategy
22.2.16.5.3. Channel Strategy
22.2.17. Medifilm AG.
22.2.17.1. Overview
22.2.17.2. Product Portfolio
22.2.17.3. Profitability by Market Segments
22.2.17.4. Sales Footprint
22.2.17.5. Strategy Overview
22.2.17.5.1. Marketing Strategy
22.2.17.5.2. Product Strategy
22.2.17.5.3. Channel Strategy
22.2.18. Origin Pharma Packaging
22.2.18.1. Overview
22.2.18.2. Product Portfolio
22.2.18.3. Profitability by Market Segments
22.2.18.4. Sales Footprint
22.2.18.5. Strategy Overview
22.2.18.5.1. Marketing Strategy
22.2.18.5.2. Product Strategy
22.2.18.5.3. Channel Strategy
22.2.19. CSB Nutrition Corporation
22.2.19.1. Overview
22.2.19.2. Product Portfolio
22.2.19.3. Profitability by Market Segments
22.2.19.4. Sales Footprint
22.2.19.5. Strategy Overview
22.2.19.5.1. Marketing Strategy
22.2.19.5.2. Product Strategy
22.2.19.5.3. Channel Strategy
22.2.20. Nutra Solutions USA
22.2.20.1. Overview
22.2.20.2. Product Portfolio
22.2.20.3. Profitability by Market Segments
22.2.20.4. Sales Footprint
22.2.20.5. Strategy Overview
22.2.20.5.1. Marketing Strategy
22.2.20.5.2. Product Strategy
22.2.20.5.3. Channel Strategy
23. Assumptions and Acronyms Used
24. Research Methodology
Let us know your requirement to get
100% FREE customization
Table 1: Global Nutraceutical Packaging Market Value (US$ Mn) and Volume (Tons) Forecast, by Packaging Type, 2014 – 2029
Table 2: Global Nutraceutical Packaging Market Value (US$ Mn) and Volume (Tons) Forecast, by Material, 2014 – 2029
Table 3: Global Nutraceutical Packaging Market Value (US$ Mn) and Volume (Tons) Forecast, by Material, 2014 – 2029
Table 4: Global Nutraceutical Packaging Market Value (US$ Mn) and Volume (Tons) Forecast, by Product Form, 2014 – 2029
Table 5: Global Nutraceutical Packaging Market Value (US$ Mn) and Volume (Tons) Forecast, by Product Type, 2014 – 2029
Table 6: Global Nutraceutical Packaging Market Value (US$ Mn) and Volume (Tons) Forecast, by Ingredient, 2014 – 2029
Table 7: Global Nutraceutical Packaging Market Value (US$ Mn) and Volume (Tons) Forecast, by Ingredient, 2014 – 2029
Table 8: Global Nutraceutical Packaging Market Value (US$ Mn) and Volume (Tons) Forecast, by Region, 2014 – 2029
Table 9: North America Nutraceutical Packaging Market Value (US$ Mn) and Volume (Tons) Forecast, by Country, 2014 – 2029
Table 10: North America Nutraceutical Packaging Market Value (US$ Mn) and Volume (Tons) Forecast, by Packaging Type, 2014 – 2029
Table 11: North America Nutraceutical Packaging Market Value (US$ Mn) and Volume (Tons) Forecast, by Material, 2014 – 2029
Table 12: North America Nutraceutical Packaging Market Value (US$ Mn) and Volume (Tons) Forecast, by Material, 2014 – 2029
Table 13: North America Nutraceutical Packaging Market Value (US$ Mn) and Volume (Tons) Forecast, by Product Form, 2014 – 2029
Table 14: North America Nutraceutical Packaging Market Value (US$ Mn) and Volume (Tons) Forecast, by Product Type, 2014 – 2029
Table 15: North America Nutraceutical Packaging Market Value (US$ Mn) and Volume (Tons) Forecast, by Ingredient, 2014 – 2029
Table 16: North America Nutraceutical Packaging Market Value (US$ Mn) and Volume (Tons) Forecast, by Ingredient, 2014 – 2029
Table 17: Latin America Nutraceutical Packaging Market Value (US$ Mn) and Volume (Tons) Forecast, by Country, 2014 – 2029
Table 18: Latin America Nutraceutical Packaging Market Value (US$ Mn) and Volume (Tons) Forecast, by Packaging Type, 2014 – 2029
Table 19: Latin America Nutraceutical Packaging Market Value (US$ Mn) and Volume (Tons) Forecast, by Material, 2014 – 2029
Table 20: Latin America Nutraceutical Packaging Market Value (US$ Mn) and Volume (Tons) Forecast, by Material, 2014 – 2029
Table 21: Latin America Nutraceutical Packaging Market Value (US$ Mn) and Volume (Tons) Forecast, by Product Form, 2014 – 2029
Table 22: Latin America Nutraceutical Packaging Market Value (US$ Mn) and Volume (Tons) Forecast, by Product Type, 2014 – 2029
Table 23: Latin America Nutraceutical Packaging Market Value (US$ Mn) and Volume (Tons) Forecast, by Ingredient, 2014 – 2029
Table 24: Latin America Nutraceutical Packaging Market Value (US$ Mn) and Volume (Tons) Forecast, by Ingredient, 2014 – 2029
Table 25: Europe Nutraceutical Packaging Market Value (US$ Mn) and Volume (Tons) Forecast, by Country, 2014 – 2029
Table 26: Europe Nutraceutical Packaging Market Value (US$ Mn) and Volume (Tons) Forecast, by Country, 2014 – 2029
Table 27: Europe Nutraceutical Packaging Market Value (US$ Mn) and Volume (Tons) Forecast, by Packaging Type, 2014 – 2029
Table 28: Europe Nutraceutical Packaging Market Value (US$ Mn) and Volume (Tons) Forecast, by Material, 2014 – 2029
Table 29: Europe Nutraceutical Packaging Market Value (US$ Mn) and Volume (Tons) Forecast, by Material, 2014 – 2029
Table 30: Europe Nutraceutical Packaging Market Value (US$ Mn) and Volume (Tons) Forecast, by Product Form, 2014 – 2029
Table 31: Europe Nutraceutical Packaging Market Value (US$ Mn) and Volume (Tons) Forecast, by Product Type, 2014 – 2029
Table 32: Europe Nutraceutical Packaging Market Value (US$ Mn) and Volume (Tons) Forecast, by Ingredient, 2014 – 2029
Table 33: Europe Nutraceutical Packaging Market Value (US$ Mn) and Volume (Tons) Forecast, by Ingredient, 2014 – 2029
Table 34: South Asia Nutraceutical Packaging Market Value (US$ Mn) and Volume (Tons) Forecast, by Country, 2014 – 2029
Table 35: South Asia Nutraceutical Packaging Market Value (US$ Mn) and Volume (Tons) Forecast, by Packaging Type, 2014 – 2029
Table 36: South Asia Nutraceutical Packaging Market Value (US$ Mn) and Volume (Tons) Forecast, by Material, 2014 – 2029
Table 37: South Asia Nutraceutical Packaging Market Value (US$ Mn) and Volume (Tons) Forecast, by Material, 2014 – 2029
Table 38: South Asia Nutraceutical Packaging Market Value (US$ Mn) and Volume (Tons) Forecast, by Product Form, 2014 – 2029
Table 39: South Asia Nutraceutical Packaging Market Value (US$ Mn) and Volume (Tons) Forecast, by Product Type, 2014 – 2029
Table 40: South Asia Nutraceutical Packaging Market Value (US$ Mn) and Volume (Tons) Forecast, by Ingredient, 2014 – 2029
Table 41: South Asia Nutraceutical Packaging Market Value (US$ Mn) and Volume (Tons) Forecast, by Ingredient, 2014 – 2029
Table 42: East Asia Nutraceutical Packaging Market Value (US$ Mn) and Volume (Tons) Forecast, by Country, 2014 – 2029
Table 43: East Asia Nutraceutical Packaging Market Value (US$ Mn) and Volume (Tons) Forecast, by Packaging Type, 2014 – 2029
Table 44: East Asia Nutraceutical Packaging Market Value (US$ Mn) and Volume (Tons) Forecast, by Material, 2014 – 2029
Table 45: East Asia Nutraceutical Packaging Market Value (US$ Mn) and Volume (Tons) Forecast, by Material, 2014 – 2029
Table 46: East Asia Nutraceutical Packaging Market Value (US$ Mn) and Volume (Tons) Forecast, by Product Form, 2014 – 2029
Table 47: East Asia Nutraceutical Packaging Market Value (US$ Mn) and Volume (Tons) Forecast, by Product Type, 2014 – 2029
Table 48: East Asia Nutraceutical Packaging Market Value (US$ Mn) and Volume (Tons) Forecast, by Ingredient, 2014 – 2029
Table 49: East Asia Nutraceutical Packaging Market Value (US$ Mn) and Volume (Tons) Forecast, by Ingredient, 2014 – 2029
Table 50: Oceania Nutraceutical Packaging Market Value (US$ Mn) and Volume (Tons) Forecast, by Country, 2014 – 2029
Table 51: Oceania Nutraceutical Packaging Market Value (US$ Mn) and Volume (Tons) Forecast, by Packaging Type, 2014 – 2029
Table 52: Oceania Nutraceutical Packaging Market Value (US$ Mn) and Volume (Tons) Forecast, by Material, 2014 – 2029
Table 53: Oceania Nutraceutical Packaging Market Value (US$ Mn) and Volume (Tons) Forecast, by Material, 2014 – 2029
Table 54: Oceania Nutraceutical Packaging Market Value (US$ Mn) and Volume (Tons) Forecast, by Product Form, 2014 – 2029
Table 55: Oceania Nutraceutical Packaging Market Value (US$ Mn) and Volume (Tons) Forecast, by Product Type, 2014 – 2029
Table 56: Oceania Nutraceutical Packaging Market Value (US$ Mn) and Volume (Tons) Forecast, by Ingredient, 2014 – 2029
Table 57: Oceania Nutraceutical Packaging Market Value (US$ Mn) and Volume (Tons) Forecast, by Ingredient, 2014 – 2029
Table 58: MEA Nutraceutical Packaging Market Value (US$ Mn) and Volume (Tons) Forecast, by Country, 2014 – 2029
Table 59: MEA Nutraceutical Packaging Market Value (US$ Mn) and Volume (Tons) Forecast, by Packaging Type, 2014 – 2029
Table 60: MEA Nutraceutical Packaging Market Value (US$ Mn) and Volume (Tons) Forecast, by Material, 2014 – 2029
Table 61: MEA Nutraceutical Packaging Market Value (US$ Mn) and Volume (Tons) Forecast, by Material, 2014 – 2029
Table 62: MEA Nutraceutical Packaging Market Value (US$ Mn) and Volume (Tons) Forecast, by Product Form, 2014 – 2029
Table 63: MEA Nutraceutical Packaging Market Value (US$ Mn) and Volume (Tons) Forecast, by Product Type, 2014 – 2029
Table 64: MEA Nutraceutical Packaging Market Value (US$ Mn) and Volume (Tons) Forecast, by Ingredient, 2014 – 2029
Table 65: MEA Nutraceutical Packaging Market Value (US$ Mn) and Volume (Tons) Forecast, by Ingredient, 2014 – 2029
Find your sweet spots for generating winning opportunities in this market.
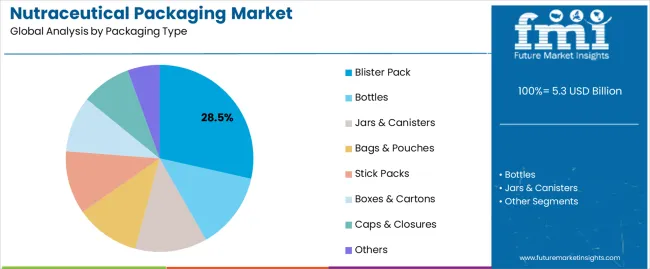
Talk to AnalystFigure 1: Global Nutraceutical Packaging Market Share Analysis, by Packaging Type, 2014(H), 2022(E) & 2029(F)
Figure 2: Global Nutraceutical Packaging Market Y-o-Y Growth, by Packaging Type, 2015(A)-2029(F)
Figure 3: Global Global Nutraceutical Packaging Market Attractiveness Index, by Packaging Type, 2022(E) – 2029(F)
Figure 4: Global Nutraceutical Packaging Market Share Analysis, by Material, 2014(H), 2022(E) & 2029(F)
Figure 5: Global Nutraceutical Packaging Market Y-o-Y Growth, by Material, 2015(A)-2029(F)
Figure 6: Global Nutraceutical Packaging Market Attractiveness Index, by Material, 2022(E) – 2029(F)
Figure 7: Global Nutraceutical Packaging Market Share Analysis, by Product Form, 2014(H), 2022(E) & 2029(F)
Figure 8: Global Nutraceutical Packaging Market Y-o-Y Growth, by Product Form, 2015(A)-2029(F)
Figure 9: Global Nutraceutical Packaging Market Attractiveness Index, by Product Form, 2022(E) – 2029(F)
Figure 10: Global Nutraceutical Packaging Market Share Analysis, by Product Type, 2014(H), 2022(E) & 2029(F)
Figure 11: Global Nutraceutical Packaging Market Y-o-Y Growth, by Product Type, 2015(A)-2029(F)
Figure 12: Global Nutraceutical Packaging Market Attractiveness Index, by Product Type, 2022(E) – 2029(F)
Figure 13: Global Nutraceutical Packaging Market Share Analysis, by Ingredient, 2014(H), 2022(E) & 2029(F)
Figure 14: Global Nutraceutical Packaging Market Y-o-Y Growth, by Ingredient, 2015(A)-2029(F)
Figure 15: Global Nutraceutical Packaging Market Attractiveness Index, by Ingredient, 2022(E) – 2029(F)
Figure 16: Global Nutraceutical Packaging Market Share Analysis, by Region , 2014(H), 2022(E) & 2029(F)
Figure 17: Global Nutraceutical Packaging Market Y-o-Y Growth, by Region, 2015(A)-2029(F)
Figure 18: Global Nutraceutical Packaging Market Attractiveness Index, by Region, 2022(E) – 2029(F)
Figure 19: North America Nutraceutical E19:E36Packaging Market Share Analysis, by Country, 2014(H), 2022(E) & 2029(F)
Figure 20: North America Nutraceutical Packaging Market Y-o-Y Growth, by Country, 2015(A)-2029(F)
Figure 21: North America Nutraceutical Packaging Market Attractiveness Index, by Country, 2022(E) – 2029(F)
Figure 22: North America Nutraceutical Packaging Market Share Analysis, by Packaging Type, 2014(H), 2022(E) & 2029(F)
Figure 23: North America Nutraceutical Packaging Market Y-o-Y Growth, by Packaging Type, 2015(A)-2029(F)
Figure 24: North America Global Nutraceutical Packaging Market Attractiveness Index, by Packaging Type, 2022(E) – 2029(F)
Figure 25: North America Nutraceutical Packaging Market Share Analysis, by Material, 2014(H), 2022(E) & 2029(F)
Figure 26: North America Nutraceutical Packaging Market Y-o-Y Growth, by Material, 2015(A)-2029(F)
Figure 27: North America Nutraceutical Packaging Market Attractiveness Index, by Material, 2022(E) – 2029(F)
Figure 28: North America Nutraceutical Packaging Market Share Analysis, by Product Form, 2014(H), 2022(E) & 2029(F)
Figure 29: North America Nutraceutical Packaging Market Y-o-Y Growth, by Product Form, 2015(A)-2029(F)
Figure 30: North America Nutraceutical Packaging Market Attractiveness Index, by Product Form, 2022(E) – 2029(F)
Figure 31: North America Nutraceutical Packaging Market Share Analysis, by Product Type, 2014(H), 2022(E) & 2029(F)
Figure 32: North America Nutraceutical Packaging Market Y-o-Y Growth, by Product Type, 2015(A)-2029(F)
Figure 33: North America Nutraceutical Packaging Market Attractiveness Index, by Product Type, 2022(E) – 2029(F)
Figure 34: North America Nutraceutical Packaging Market Share Analysis, by Ingredient, 2014(H), 2022(E) & 2029(F)
Figure 35: North America Nutraceutical Packaging Market Y-o-Y Growth, by Ingredient, 2015(A)-2029(F)
Figure 36: North America Nutraceutical Packaging Market Attractiveness Index, by Ingredient, 2022(E) – 2029(F)
Figure 37: Latin America Nutraceutical E19:E36Packaging Market Share Analysis, by Country, 2014(H), 2022(E) & 2029(F)
Figure 38: Latin America Nutraceutical Packaging Market Y-o-Y Growth, by Country, 2015(A)-2029(F)
Figure 39: Latin America Nutraceutical Packaging Market Attractiveness Index, by Country, 2022(E) – 2029(F)
Figure 40: Latin America Nutraceutical Packaging Market Share Analysis, by Packaging Type, 2014(H), 2022(E) & 2029(F)
Figure 41: Latin America Nutraceutical Packaging Market Y-o-Y Growth, by Packaging Type, 2015(A)-2029(F)
Figure 42: Latin America Global Nutraceutical Packaging Market Attractiveness Index, by Packaging Type, 2022(E) – 2029(F)
Figure 43: Latin America Nutraceutical Packaging Market Share Analysis, by Material, 2014(H), 2022(E) & 2029(F)
Figure 44: Latin America Nutraceutical Packaging Market Y-o-Y Growth, by Material, 2015(A)-2029(F)
Figure 45: Latin America Nutraceutical Packaging Market Attractiveness Index, by Material, 2022(E) – 2029(F)
Figure 46: Latin America Nutraceutical Packaging Market Share Analysis, by Product Form, 2014(H), 2022(E) & 2029(F)
Figure 47: Latin America Nutraceutical Packaging Market Y-o-Y Growth, by Product Form, 2015(A)-2029(F)
Figure 48: Latin America Nutraceutical Packaging Market Attractiveness Index, by Product Form, 2022(E) – 2029(F)
Figure 49: Latin America Nutraceutical Packaging Market Share Analysis, by Product Type, 2014(H), 2022(E) & 2029(F)
Figure 50: Latin America Nutraceutical Packaging Market Y-o-Y Growth, by Product Type, 2015(A)-2029(F)
Figure 51: Latin America Nutraceutical Packaging Market Attractiveness Index, by Product Type, 2022(E) – 2029(F)
Figure 52: Latin America Nutraceutical Packaging Market Share Analysis, by Ingredient, 2014(H), 2022(E) & 2029(F)
Figure 53: Latin America Nutraceutical Packaging Market Y-o-Y Growth, by Ingredient, 2015(A)-2029(F)
Figure 54: Latin America Nutraceutical Packaging Market Attractiveness Index, by Ingredient, 2022(E) – 2029(F)
Figure 55: Europe Nutraceutical E19:E36Packaging Market Share Analysis, by Country, 2014(H), 2022(E) & 2029(F)
Figure 56: Europe Nutraceutical Packaging Market Y-o-Y Growth, by Country, 2015(A)-2029(F)
Figure 57: Europe Nutraceutical Packaging Market Attractiveness Index, by Country, 2022(E) – 2029(F)
Figure 58: Europe Nutraceutical Packaging Market Share Analysis, by Packaging Type, 2014(H), 2022(E) & 2029(F)
Figure 59: Europe Nutraceutical Packaging Market Y-o-Y Growth, by Packaging Type, 2015(A)-2029(F)
Figure 60: Europe Global Nutraceutical Packaging Market Attractiveness Index, by Packaging Type, 2022(E) – 2029(F)
Figure 61: Europe Nutraceutical Packaging Market Share Analysis, by Material, 2014(H), 2022(E) & 2029(F)
Figure 62: Europe Nutraceutical Packaging Market Y-o-Y Growth, by Material, 2015(A)-2029(F)
Figure 63: Europe Nutraceutical Packaging Market Attractiveness Index, by Material, 2022(E) – 2029(F)
Figure 64: Europe Nutraceutical Packaging Market Share Analysis, by Product Form, 2014(H), 2022(E) & 2029(F)
Figure 65: Europe Nutraceutical Packaging Market Y-o-Y Growth, by Product Form, 2015(A)-2029(F)
Figure 66: Europe Nutraceutical Packaging Market Attractiveness Index, by Product Form, 2022(E) – 2029(F)
Figure 67: Europe Nutraceutical Packaging Market Share Analysis, by Product Type, 2014(H), 2022(E) & 2029(F)
Figure 68: Europe Nutraceutical Packaging Market Y-o-Y Growth, by Product Type, 2015(A)-2029(F)
Figure 69: Europe Nutraceutical Packaging Market Attractiveness Index, by Product Type, 2022(E) – 2029(F)
Figure 70: Europe Nutraceutical Packaging Market Share Analysis, by Ingredient, 2014(H), 2022(E) & 2029(F)
Figure 71: Europe Nutraceutical Packaging Market Y-o-Y Growth, by Ingredient, 2015(A)-2029(F)
Figure 72: Europe Nutraceutical Packaging Market Attractiveness Index, by Ingredient, 2022(E) – 2029(F)
Figure 73: South Asia Nutraceutical E19:E36Packaging Market Share Analysis, by Country, 2014(H), 2022(E) & 2029(F)
Figure 74: South Asia Nutraceutical Packaging Market Y-o-Y Growth, by Country, 2015(A)-2029(F)
Figure 75: South Asia Nutraceutical Packaging Market Attractiveness Index, by Country, 2022(E) – 2029(F)
Figure 76: South Asia Nutraceutical Packaging Market Share Analysis, by Packaging Type, 2014(H), 2022(E) & 2029(F)
Figure 77: South Asia Nutraceutical Packaging Market Y-o-Y Growth, by Packaging Type, 2015(A)-2029(F)
Figure 78: South Asia Global Nutraceutical Packaging Market Attractiveness Index, by Packaging Type, 2022(E) – 2029(F)
Figure 79: South Asia Nutraceutical Packaging Market Share Analysis, by Material, 2014(H), 2022(E) & 2029(F)
Figure 80: South Asia Nutraceutical Packaging Market Y-o-Y Growth, by Material, 2015(A)-2029(F)
Figure 81: South Asia Nutraceutical Packaging Market Attractiveness Index, by Material, 2022(E) – 2029(F)
Figure 82: South Asia Nutraceutical Packaging Market Share Analysis, by Product Form, 2014(H), 2022(E) & 2029(F)
Figure 83: South Asia Nutraceutical Packaging Market Y-o-Y Growth, by Product Form, 2015(A)-2029(F)
Figure 84: South Asia Nutraceutical Packaging Market Attractiveness Index, by Product Form, 2022(E) – 2029(F)
Figure 85: South Asia Nutraceutical Packaging Market Share Analysis, by Product Type, 2014(H), 2022(E) & 2029(F)
Figure 86: South Asia Nutraceutical Packaging Market Y-o-Y Growth, by Product Type, 2015(A)-2029(F)
Figure 87: South Asia Nutraceutical Packaging Market Attractiveness Index, by Product Type, 2022(E) – 2029(F)
Figure 88: South Asia Nutraceutical Packaging Market Share Analysis, by Ingredient, 2014(H), 2022(E) & 2029(F)
Figure 89: South Asia Nutraceutical Packaging Market Y-o-Y Growth, by Ingredient, 2015(A)-2029(F)
Figure 90: South Asia Nutraceutical Packaging Market Attractiveness Index, by Ingredient, 2022(E) – 2029(F)
Figure 91: East Asia Nutraceutical E19:E36Packaging Market Share Analysis, by Country, 2014(H), 2022(E) & 2029(F)
Figure 92: East Asia Nutraceutical Packaging Market Y-o-Y Growth, by Country, 2015(A)-2029(F)
Figure 93: East Asia Nutraceutical Packaging Market Attractiveness Index, by Country, 2022(E) – 2029(F)
Figure 94: East Asia Nutraceutical Packaging Market Share Analysis, by Packaging Type, 2014(H), 2022(E) & 2029(F)
Figure 95: East Asia Nutraceutical Packaging Market Y-o-Y Growth, by Packaging Type, 2015(A)-2029(F)
Figure 96: East Asia Nutraceutical Packaging Market Attractiveness Index, by Packaging Type, 2022(E) – 2029(F)
Figure 97: East Asia Nutraceutical Packaging Market Share Analysis, by Material, 2014(H), 2022(E) & 2029(F)
Figure 98: East Asia Nutraceutical Packaging Market Y-o-Y Growth, by Material, 2015(A)-2029(F)
Figure 99: East Asia Nutraceutical Packaging Market Attractiveness Index, by Material, 2022(E) – 2029(F)
Figure 100: East Asia Nutraceutical Packaging Market Share Analysis, by Product Form, 2014(H), 2022(E) & 2029(F)
Figure 101: East Asia Nutraceutical Packaging Market Y-o-Y Growth, by Product Form, 2015(A)-2029(F)
Figure 102: East Asia Nutraceutical Packaging Market Attractiveness Index, by Product Form, 2022(E) – 2029(F)
Figure 103: East Asia Nutraceutical Packaging Market Share Analysis, by Product Type, 2014(H), 2022(E) & 2029(F)
Figure 104: East Asia Nutraceutical Packaging Market Y-o-Y Growth, by Product Type, 2015(A)-2029(F)
Figure 105: East Asia Nutraceutical Packaging Market Attractiveness Index, by Product Type, 2022(E) – 2029(F)
Figure 106: East Asia Nutraceutical Packaging Market Share Analysis, by Ingredient, 2014(H), 2022(E) & 2029(F)
Figure 107: East Asia Nutraceutical Packaging Market Y-o-Y Growth, by Ingredient, 2015(A)-2029(F)
Figure 108: East Asia Nutraceutical Packaging Market Attractiveness Index, by Ingredient, 2022(E) – 2029(F)
Figure 109: Oceania Nutraceutical E19:E36Packaging Market Share Analysis, by Country, 2014(H), 2022(E) & 2029(F)
Figure 110: Oceania Nutraceutical Packaging Market Y-o-Y Growth, by Country, 2015(A)-2029(F)
Figure 111: Oceania Nutraceutical Packaging Market Attractiveness Index, by Country, 2022(E) – 2029(F)
Figure 112: Oceania Nutraceutical Packaging Market Share Analysis, by Packaging Type, 2014(H), 2022(E) & 2029(F)
Figure 113: Oceania Nutraceutical Packaging Market Y-o-Y Growth, by Packaging Type, 2015(A)-2029(F)
Figure 114: Oceania Global Nutraceutical Packaging Market Attractiveness Index, by Packaging Type, 2022(E) – 2029(F)
Figure 115: Oceania Nutraceutical Packaging Market Share Analysis, by Material, 2014(H), 2022(E) & 2029(F)
Figure 116: Oceania Nutraceutical Packaging Market Y-o-Y Growth, by Material, 2015(A)-2029(F)
Figure 117: Oceania Nutraceutical Packaging Market Attractiveness Index, by Material, 2022(E) – 2029(F)
Figure 118: Oceania Nutraceutical Packaging Market Share Analysis, by Product Form, 2014(H), 2022(E) & 2029(F)
Figure 119: Oceania Nutraceutical Packaging Market Y-o-Y Growth, by Product Form, 2015(A)-2029(F)
Figure 120: Oceania Nutraceutical Packaging Market Attractiveness Index, by Product Form, 2022(E) – 2029(F)
Figure 121: Oceania Nutraceutical Packaging Market Share Analysis, by Product Type, 2014(H), 2022(E) & 2029(F)
Figure 122: Oceania Nutraceutical Packaging Market Y-o-Y Growth, by Product Type, 2015(A)-2029(F)
Figure 123: Oceania Nutraceutical Packaging Market Attractiveness Index, by Product Type, 2022(E) – 2029(F)
Figure 124: Oceania Nutraceutical Packaging Market Share Analysis, by Ingredient, 2014(H), 2022(E) & 2029(F)
Figure 125: Oceania Nutraceutical Packaging Market Y-o-Y Growth, by Ingredient, 2015(A)-2029(F)
Figure 126: Oceania Nutraceutical Packaging Market Attractiveness Index, by Ingredient, 2022(E) – 2029(F)
Figure 127: MEA Nutraceutical E19:E36Packaging Market Share Analysis, by Country, 2014(H), 2022(E) & 2029(F)
Figure 128: MEA Nutraceutical Packaging Market Y-o-Y Growth, by Country, 2015(A)-2029(F)
Figure 129: MEA Nutraceutical Packaging Market Attractiveness Index, by Country, 2022(E) – 2029(F)
Figure 130: MEA Nutraceutical Packaging Market Share Analysis, by Packaging Type, 2014(H), 2022(E) & 2029(F)
Figure 131: MEA Nutraceutical Packaging Market Y-o-Y Growth, by Packaging Type, 2015(A)-2029(F)
Figure 132: MEA Global Nutraceutical Packaging Market Attractiveness Index, by Packaging Type, 2022(E) – 2029(F)
Figure 133: MEA Nutraceutical Packaging Market Share Analysis, by Material, 2014(H), 2022(E) & 2029(F)
Figure 134: MEA Nutraceutical Packaging Market Y-o-Y Growth, by Material, 2015(A)-2029(F)
Figure 135: MEA Nutraceutical Packaging Market Attractiveness Index, by Material, 2022(E) – 2029(F)
Figure 136: MEA Nutraceutical Packaging Market Share Analysis, by Product Form, 2014(H), 2022(E) & 2029(F)
Figure 137: MEA Nutraceutical Packaging Market Y-o-Y Growth, by Product Form, 2015(A)-2029(F)
Figure 138: MEA Nutraceutical Packaging Market Attractiveness Index, by Product Form, 2022(E) – 2029(F)
Figure 139: MEA Nutraceutical Packaging Market Share Analysis, by Product Type, 2014(H), 2022(E) & 2029(F)
Figure 140: MEA Nutraceutical Packaging Market Y-o-Y Growth, by Product Type, 2015(A)-2029(F)
Figure 141: MEA Nutraceutical Packaging Market Attractiveness Index, by Product Type, 2022(E) – 2029(F)
Figure 142: MEA Nutraceutical Packaging Market Share Analysis, by Ingredient, 2014(H), 2022(E) & 2029(F)
Figure 143: MEA Nutraceutical Packaging Market Y-o-Y Growth, by Ingredient, 2015(A)-2029(F)
Figure 144: MEA Nutraceutical Packaging Market Attractiveness Index, by Ingredient, 2022(E) – 2029(F)
Figure 145: Emerging Countries Nutraceutical Packaging Market Value (US$ Mn) and Volume (Tons) analysis, 2014 (A) – 2021 (A)
Figure 146: Emerging Countries Nutraceutical Packaging Market Value (US$ Mn) and Volume (Tons) Forecast, 2022 (E) -2029 (F)
Figure 147: Global Vs. India Nutraceutical Packaging Market, Y-o-Y Analysis, 2015(A) - 2029(F)
Figure 148: Global Vs. Mexico Nutraceutical Packaging Market, Y-o-Y Analysis, 2015(A) - 2029(F)
Figure 149: India Nutraceutical Packaging Market Value (US$ Mn) and Volume (Tons) analysis, 2014 (A) – 2021 (A)
Figure 150: India Nutraceutical Packaging Market Value (US$ Mn) and Volume (Tons) Forecast, 2022 (E) -2029 (F)
Figure 152: Mexico Nutraceutical Packaging Market Value (US$ Mn) and Volume (Tons) analysis, 2014 (A) – 2021 (A)
Figure 153: Mexico Nutraceutical Packaging Market Value (US$ Mn) and Volume (Tons) Forecast, 2022(E) -2029 (F)7.65
Need specific information?
Request CustomizationExplore Packaging Insights
View Reports