Nutraceutical Actives Market Size, Share, and Forecast Outlook 2025 to 2035

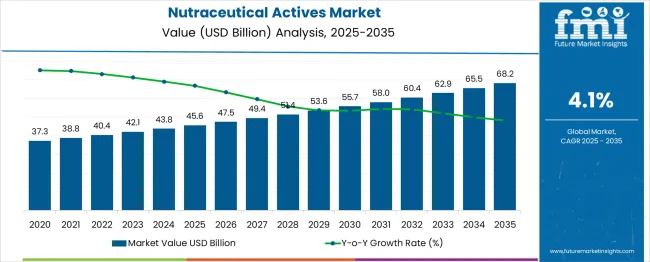
The nutraceutical actives market, starting at USD 45.6 billion in 2025, grows at a steady CAGR of 4.1%, reaching USD 68.2 billion by 2035. Annual gains rise incrementally from USD 1.87 billion in 2026 to nearly USD 2.65 billion in 2035.
Quick Stats of the Nutraceutical Actives Market

  • Nutraceutical Actives Market Size (2025): USD 45.6 billion
  • Projected Nutraceutical Actives Market Size (2035): USD 68.2 billion
  • Forecast CAGR of Nutraceutical Actives Market (2025 to 2035): 4.1%
  • Leading Segment of Nutraceutical Actives Market (2025): Botanical Extracts (21.30%)
  • Key Growth Regions of Nutraceutical Actives Market: South Asia & Pacific
  • Top Key Players of Nutraceutical Actives Market: DSM-Firmenich, Lonza, Glanbia Nutritionals, ADM, BASF

Nutraceutical Actives Market Value Analysis

Metric Value
Industry Size (2025E) USD 45.6 billion
Industry Value (2035F) USD 68.2 billion
CAGR (2025 to 2035) 4.1%

This consistent increase signals stable demand for active compounds like polyphenols, amino acids, and omega-3s, driven by functional health concerns. Between 2027 to 2030, the largest YoY jumps coincide with rising demand for personalized nutrition, sports recovery, and cognitive health. North America and Europe remain high-value industries while Asia leads volume growth.

The nutraceutical actives market commands a significant footprint across its parent industries. It contributes approximately 35-40% of the overall nutraceuticals market, being the functional core of fortified foods, supplements, and health beverages.

Within the functional ingredients market, its share stands at 30-35%, led by botanicals, amino acids, and probiotics. In the dietary supplements market, nutraceutical actives represent about 25-28%, powering most capsule and powder formulations.

Within the broader health and wellness ingredients segment, their contribution is estimated at 20-25%, as they drive innovation in preventive nutrition. In the bioactive compounds market, nutraceutical actives comprise nearly 45-50% due to their central role in delivering physiological benefits.

Analyzing Nutraceutical Actives Market by Top Segments

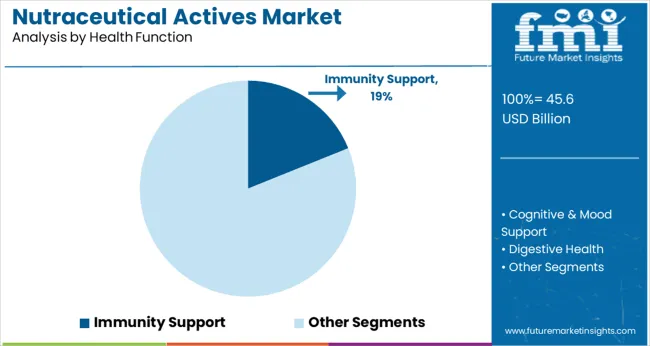
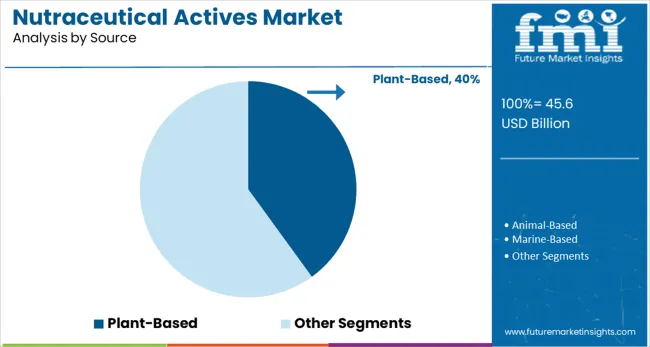
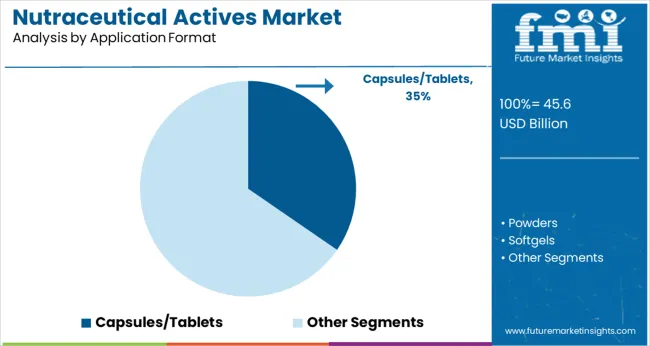
The industryis led by botanical extracts, holding a 21.3% share, driven by their wide use in various health supplements. Immunity support is the leading health function at 19%, while plant-based sources account for 40%. Capsules/tablets are the dominant application format at 35%, showing their convenience and widespread use.

Botanical Extracts Leading Active Type Category

Botanical extracts lead the active type segment with a 21.3% share. Their popularity can be attributed to their numerous health benefits, including immunity-boosting and antioxidant properties. As the preference for plant-based and natural ingredients rises, botanical extracts have become essential in nutraceutical products.

They are widely used in dietary supplements and functional foods, offering an eco-friendly and consumer-trusted alternative to synthetic options. The trend towards plant-based products and their role in preventive health strategies ensures that botanical extracts will continue to hold a significant share in the nutraceuticals industry.
  • Increasing demand for plant-based active ingredients
  • Gaining traction in both functional foods and supplements
  • Strong consumer preference for natural alternatives

Immunity Support Dominates Health Function

Nutraceutical Actives Market Analysis By Health Function

Immunity support holds an 19% share within the health function segment. As awareness about the importance of immunity rises, especially in light of recent global health events, nutraceutical products aimed at boosting immunity are in high demand. Active ingredients such as vitamin C, zinc, and herbal extracts like echinacea and elderberry are widely incorporated into supplements.

This segment is set for steady growth as consumers continue to seek preventive health measures to protect against illnesses. Immunity support remains a key selling point for nutraceutical brands, contributing to a strong industry presence.
  • Rising consumer awareness of immunity-boosting benefits
  • Demand for natural ingredients in immunity supplements
  • Continued growth driven by preventive health trends

Plant-Based Sources Hold Dominant Share

Nutraceutical Actives Market Analysis By Source

Plant-based sources capture a significant 40% share in the source type category. As the shift towards vegan and vegetarian diets continues, plant-based nutraceuticals are gaining substantial traction. These products are perceived as healthier and more environmentally friendly, further driving their demand.

The plant-based sources align with consumer trends focused on clean-label and organic ingredients. This segment’s growth is reinforced by its appeal to a wide demographic, including those who are increasingly adopting plant-based lifestyles, thus ensuring plant-based sources maintain dominance.
  • Plant-based ingredients meet the demand for vegan and vegetarian options
  • Strong alignment with clean-label and organic trends
  • Increased industryshares driven by consumer lifestyle changes

Capsules/Tablets Remain Preferred Format

Nutraceutical Actives Market Analysis By Application Format

Capsules and tablets are the dominant format, holding a 35% share in the application format segment. Their convenience, ease of consumption, and precise dosage control make them the go-to option for nutraceutical products. This format is particularly popular for multivitamins, minerals, and herbal supplements.

Capsules and tablets also offer a longer shelf life and are easy to store, making them ideal for global distribution. The widespread acceptance of this format ensures its continued dominance, as it provides a reliable method of delivering active ingredients to consumers.

  • Convenient format for precise dosage and easy consumption
  • Long shelf life and storage advantages for global distribution
  • Preferred choice for nutraceutical and dietary supplement delivery

Top Nutraceutical Actives Market Dynamics

The industry is growing as consumers seek health-boosting ingredients like botanicals, probiotics, and vitamins. The regulatory challenges and varying quality standards across regions hinder industry expansion. Companies focusing on compliance, quality control, and ingredient efficacy are well-positioned to capitalize on the growing demand for natural health solutions.

Growing Demand for Health Boosting Ingredients

The demand for nutraceutical actives is surging, with consumers seeking products that offer health benefits beyond basic nutrition. Active ingredients such as botanical extracts, probiotics, and vitamins are gaining prominence due to their proven efficacy in supporting immunity, cognitive health, and overall wellness. The growing preference for preventive health measures and natural alternatives is expanding opportunities for nutraceutical ingredient manufacturers.

  • Botanicals and herbal ingredients lead the industry in consumer preference.
  • Natural supplements, such as omega-3 fatty acids and probiotics, dominate the industry.
  • Increased awareness about wellness and holistic health influences product trends.

Regulatory Challenges and Ingredient Quality Assurance

Despite growing consumer interest, the nutraceutical actives industry faces significant barriers related to inconsistent regulations across regions. Companies must navigate complex regulatory environments, which can lead to delays in product launches and increased compliance costs. ensuring the efficacy and safety of nutraceutical ingredients remains a challenge, with varying standards for ingredient sourcing and processing.
  • Differing regulations across regions create barriers to expansion.
  • Ingredient sourcing and quality control practices face increased scrutiny.
  • Companies investing in compliance and quality assurance processes are better positioned.

Top Countries Developing, Extracting and Scaling Nutraceutical Actives Demand

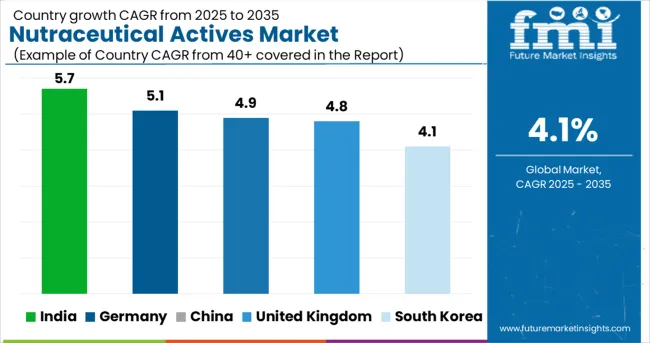
Nutraceutical Actives Market Cagr Analysis By Country

Countries CAGR (2025 to 2035)
India 5.7%
Germany 5.1%
China 4.9%
United Kingdom 4.8%
South Korea 4.1%

The nutraceutical actives market is forecast to grow at a 4.1% CAGR from 2025 to 2035, driven by clinical ingredient adoption, bioavailability innovation, and therapeutic diversification. India, part of BRICS, leads with 5.7%, supported by strong extraction capacity for curcumin, ashwagandha, and fenugreek actives.

Germany, a key OECD economy, follows at 5.1%, propelled by EFSA-compliant compounds in metabolic and immune health formats. China, also within BRICS, posts 4.9% as TCM-derived actives become embedded in modern health portfolios.

The United Kingdom, part of the OECD, records 4.8%, with growth driven by gut-health and adaptogenic SKUs. South Korea, another OECD member, grows at 4.1%, in line with the global average, anchored in nutricosmetic peptide applications.

The report includes analysis of over 40 countries, with five profiled below for reference.

Demand Outlook for Nutraceutical Actives in India

Sales for nutraceutical actives in India are expanding at a CAGR of 5.7% from 2025 to 2035. This growth is primarily driven by the increasing adoption of functional foods and supplements. Between 2020 to 2024, demand surged in metropolitan areas, particularly for plant-based extracts and immunity-boosting ingredients.

local manufacturers are intensifying R&D efforts, with advancements in the availability of bioactive compounds and encapsulation technologies. The sector is expected to benefit from broader distribution through online platforms, providing easier access to a wider consumer base.

  • The demand for botanical extracts grew by 15% in major cities from 2020 to 2024.
  • E-commerce now accounts for 35% of nutraceutical product sales.
  • Innovations in bioavailability technologies improved product efficacy by 22% in the last two years.

Sales Analysis of Nutraceutical Actives in Germany

Demand for nutraceutical actives in Germany is growing at a CAGR of 5.1% from 2025 to 2035. Growth is being bolstered by a shift toward preventive health solutions and the increasing popularity of clean-label products. Between 2020 to 2024, demand was concentrated in both natural food colors and immune-supporting supplements.

Regulatory adjustments in the European Union also provided a favorable environment for the development of high-quality active ingredients. A surge in the popularity of functional beverages further enhanced market opportunities.

  • Immune-boosting supplements accounted for 25% of sales in 2024.
  • Clean-label nutraceuticals saw a 30% increase in consumer adoption in 2024.
  • Germany’s nutraceutical industry experienced a 4% rise in export demand between 2020 to 2024.

Opportunity Analysis of Nutraceutical Actives in China

The nutraceutical actives market in China is forecast to grow at a CAGR of 4.9% from 2025 to 2035. Growth is expected to be propelled by increasing consumer awareness around health and wellness, along with greater integration of natural products into daily diets.

From 2020 to 2024, the demand was led by products like collagen, vitamins, and antioxidants, which were commonly found in dietary supplements. Furthermore, investments in product innovation and enhanced local distribution networks have positioned China as a key growth market for nutraceuticals.

  • Collagen-based supplements grew 28% between 2020 to 2024.
  • Online retail channels captured 40% of total sales by 2024.
  • China’s domestic nutraceutical industry grew by 15% in the past two years.

Sales Outlook for Nutraceutical Actives in the United Kingdom

The nutraceutical actives market in the United Kingdom is projected to expand at a CAGR of 4.8% from 2025 to 2035. This expansion is primarily driven by consumer demand for personalized nutrition and clean-label products. Between 2020 to 2024, sales of immune-enhancing products and functional ingredients saw a marked increase.

demand for high-quality botanical extracts and adaptogens has been rising steadily, especially in the wellness and fitness sectors. With a growing preference for plant-based supplements, the UK market is set for continued growth.
  • The popularity of plant-based supplements surged by 20% from 2020 to 2024.
  • Immune support products saw a 16% increase in sales in 2024.
  • Personalized nutrition services accounted for 10% of industry growth in 2024.

Demand Analysis for Nutraceutical Actives in South Korea

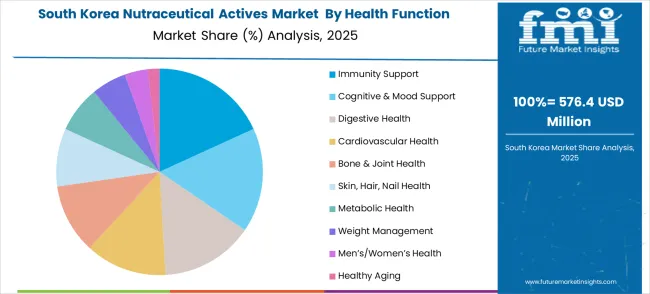
Nutraceutical Actives Market South Korea Market Share Analysis By Health Function

Sales for nutraceutical actives in South Korea areexpected to rise at a CAGR of 4.1% from 2025 to 2035. Consumer interest in functional foods and supplements that support gut health and skin care is driving industry expansion.

Between 2020 to 2024, the demand for probiotics and herbal supplements saw consistent growth, particularly among younger populations. Korean manufacturers are focusing on creating unique formulations to cater to domestic and international markets, ensuring a steady growth trajectory for the industry.
  • Probiotics sales grew by 18% from 2020 to 2024.
  • The popularity of skincare supplements increased by 22% among female consumers in 2024.
  • Local brands strengthened their global presence with new export agreements in 2024.

Competitive Landscape for Nutraceutical Actives Market

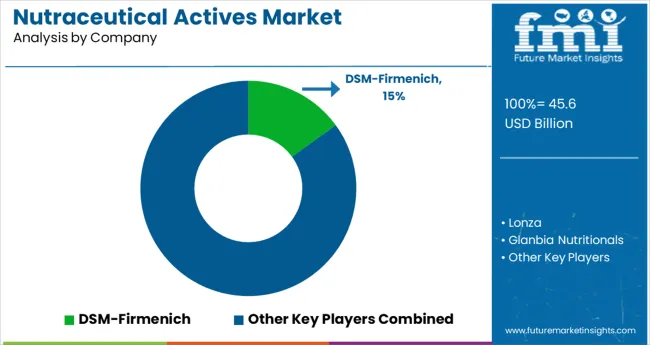
Nutraceutical Actives Market Analysis By Company

The nutraceutical actives market is highly competitive, driven by major players like DSM-Firmenich, Lonza, Glanbia Nutritionals, ADM, and BASF. DSM-Firmenich leads with its extensive portfolio of vitamins and minerals, enhancing functional ingredient offerings through strategic partnerships and innovations.

Lonza stands out for its plant-based ingredients and personalized nutrition solutions, with a strong focus on scientific efficacy. Glanbia Nutritionals specializes in bioactives, particularly in immunity support and gut health.

ADM offers a wide range of botanicals and functional ingredients, meeting rising consumer demand for health-enhancing products. BASF's focus on bioactive ingredients and scientifically-backed solutions positions it as a key player in the market.

Recent Industry News

  • In July 2025, ADM released its 2025 Protein Trend Report, spotlighting innovation in plant-based and functional proteins shaping the nutraceutical market.
  • In Dec 2024, BASF agreed to sell its Food & Health Performance Ingredients division (including Illertissen site) to Louis Dreyfus Company signaling a strategic pivot away from certain nutraceutical segments.

Leading Companies in Nutraceutical Actives Market

  • DSM-Firmenich
  • Lonza
  • Glanbia Nutritionals
  • ADM
  • BASF

Research Coverage and Scope Summary

Report Attributes Details
Industry Size (2025) USD 45.57 billion
Projected Industry Size (2035) USD 68.24 billion
CAGR (2025 to 2035) 4.1%
Base Year for Estimation 2024
Historical Period 2020 to 2024
Projections Period 2025 to 2035
Quantitative Units USD billion for value and thousand metric tons for volume
Active Types Analyzed (Segment 1) Vitamins (A, B1-B12, C, D2/D3, E, K1/K2), Minerals (Calcium, Magnesium, Iron, Zinc, Selenium, Iodine, Chromium, Manganese, Copper), Amino Acids (L-glutamine, L-carnitine, L-theanine, BCAAs), Fatty Acids (Omega-3, 6, 9), Antioxidants (CoQ10, Astaxanthin, Resveratrol, Polyphenols, Lycopene, Lutein, Zeaxanthin), Probiotics & Prebiotics (Lactobacillus spp., Bifidobacterium spp., Inulin, FOS, GOS, XOS), Botanical Extracts (Curcumin, Green Tea, Ashwagandha, Ginseng, Ginkgo Biloba, Rhodiola, Elderberry), Enzymes (Bromelain, Papain, Amylase, Protease, Lipase, Lactase, Cellulase), Fibers (Psyllium Husk, Beta-glucan, Pectin, Inulin, Guar Gum, Cellulose), Specialty Actives (Collagen Peptides, Hyaluronic Acid, Glucosamine, Chondroitin, NAC, ALA), Hormonal Support Actives (Melatonin, DHEA, Phytoestrogens)
Health Functions Analyzed (Segment 2) Immunity Support, Cognitive & Mood Support, Digestive Health, Cardiovascular Health, Bone & Joint Health, Skin/Hair/Nail Health, Metabolic Health, Weight Management, Men’s /Women’s Health, Healthy Aging.
Sources Analyzed (Segment 3) Plant-Based, Animal-Based, Marine-Based, Microbial (fermentation-derived), Synthetic
Application Formats Analyzed (Segment 4) Capsules/Tablets, Powders, Softgels, Gummies, Liquids & Shots, Functional Foods/Beverages, Sachets & Stick Packs
Regions Covered North America, Europe, East Asia, South Asia & Pacific, Latin America, Middle East & Africa
Countries Covered United States, Canada, Germany, United Kingdom, France, Italy, Spain, China, India, Japan, South Korea, Australia, Brazil, Mexico, Argentina, Saudi Arabia, UAE, South Africa
Key Players DSM-Firmenich, Lonza, Glanbia Nutritionals, ADM, BASF
Additional Attributes Dollar sales, share by active type and health function, demand shift toward cognitive and immunity blends, rise in gummies and stick-pack formats, clean-label and fermentation-derived innovations, application diversification into functional foods

Key Segments

By Active Type:

The segment is categorized into Vitamins (A, B, C, D, E, K), Minerals (Calcium, Magnesium, Iron, Zinc, Selenium), Amino Acids (L-glutamine, L-carnitine, BCAAs), Fatty Acids (Omega-3, Omega-6, Omega-9), Antioxidants (Coenzyme Q10, Astaxanthin, Resveratrol), Probiotics & Prebiotics (Lactobacillus, Bifidobacterium), Botanical Extracts (Curcumin, Green Tea Extract), Enzymes (Bromelain, Amylase, Lipase), Fibers (Psyllium Husk, Beta-glucan), Specialty Actives (Collagen peptides, Hyaluronic acid), and Hormonal Support Actives (Melatonin, DHEA).

By Health Function:

This includes Immunity Support, Cognitive & Mood Support, Digestive Health, Cardiovascular Health, Bone & Joint Health, Skin, Hair & Nail Health, Metabolic Health, Weight Management, Men’s/Women’s Health, Healthy Aging.

By Source:

The industry is segmented into Plant-Based, Animal-Based, Marine-Based, Microbial (fermentation-derived), and Synthetic sources.

By Application Format:

This includes Capsules/Tablets, Powders, Softgels, Gummies, Liquids & Shots, Functional Foods/Beverages, and Sachets & Stick Packs.

By Region:

Regional analysis covers North America, Europe, East Asia, South Asia & Pacific, Latin America, and the Middle East & Africa.

Table of Content

  1. Executive Summary
    • Global Market Outlook
    • Demand-side Trends
    • Supply-side Trends
    • Technology Roadmap Analysis
    • Analysis and Recommendations
  2. Market Overview
    • Market Coverage / Taxonomy
    • Market Definition / Scope / Limitations
  3. Market Background
    • Market Dynamics
      • Drivers
      • Restraints
      • Opportunity
      • Trends
    • Scenario Forecast
      • Demand in Optimistic Scenario
      • Demand in Likely Scenario
      • Demand in Conservative Scenario
    • Opportunity Map Analysis
    • Product Life Cycle Analysis
    • Supply Chain Analysis
      • Supply Side Participants and their Roles
        • Producers
        • Mid-Level Participants (Traders/ Agents/ Brokers)
        • Wholesalers and Distributors
      • Value Added and Value Created at Node in the Supply Chain
      • List of Raw Material Suppliers
      • List of Existing and Potential Buyer’s
    • Investment Feasibility Matrix
    • Value Chain Analysis
      • Profit Margin Analysis
      • Wholesalers and Distributors
      • Retailers
    • PESTLE and Porter’s Analysis
    • Regulatory Landscape
      • By Key Regions
      • By Key Countries
    • Regional Parent Market Outlook
    • Production and Consumption Statistics
    • Import and Export Statistics
  4. Global Market Analysis 2020 to 2024 and Forecast, 2025 to 2035
    • Historical Market Size Value (USD Billion) & Volume (Thousand Metric Tons) Analysis, 2020 to 2024
    • Current and Future Market Size Value (USD Billion) & Volume (Thousand Metric Tons) Projections, 2025 to 2035
      • Y-o-Y Growth Trend Analysis
      • Absolute $ Opportunity Analysis
  5. Global Market Pricing Analysis 2020 to 2024 and Forecast 2025 to 2035
  6. Global Market Analysis 2020 to 2024 and Forecast 2025 to 2035, By Active Type
    • Introduction / Key Findings
    • Historical Market Size Value (USD Billion) & Volume (Thousand Metric Tons) Analysis By Active Type, 2020 to 2024
    • Current and Future Market Size Value (USD Billion) & Volume (Thousand Metric Tons) Analysis and Forecast By Active Type, 2025 to 2035
      • Vitamins
      • Minerals
      • Amino Acids
      • Fatty Acids
      • Antioxidants
      • Probiotics & Prebiotics
      • Botanical Extracts
      • Enzymes
      • Fibers
      • Specialty Actives
      • Hormonal Support Actives
    • Y-o-Y Growth Trend Analysis By Active Type, 2020 to 2024
    • Absolute $ Opportunity Analysis By Active Type, 2025 to 2035
  7. Global Market Analysis 2020 to 2024 and Forecast 2025 to 2035, By Health Function
    • Introduction / Key Findings
    • Historical Market Size Value (USD Billion) & Volume (Thousand Metric Tons) Analysis By Health Function, 2020 to 2024
    • Current and Future Market Size Value (USD Billion) & Volume (Thousand Metric Tons) Analysis and Forecast By Health Function, 2025 to 2035
      • Immunity Support
      • Cognitive & Mood Support
      • Digestive Health
      • Cardiovascular Health
      • Cardiovascular Health
      • Bone & Joint Health
      • Skin, Hair, Nail Health
      • Metabolic Health
      • Weight Management
      • Men’s/Women’s Health
      • Healthy Aging
    • Y-o-Y Growth Trend Analysis By Health Function, 2020 to 2024
    • Absolute $ Opportunity Analysis By Health Function, 2025 to 2035
  8. Global Market Analysis 2020 to 2024 and Forecast 2025 to 2035, By Source
    • Introduction / Key Findings
    • Historical Market Size Value (USD Billion) & Volume (Thousand Metric Tons) Analysis By Source, 2020 to 2024
    • Current and Future Market Size Value (USD Billion) & Volume (Thousand Metric Tons) Analysis and Forecast By Source, 2025 to 2035
      • Plant-Based
      • Animal-Based
      • Marine-Based
      • Microbial (fermentation-derived)
      • Synthetic
    • Y-o-Y Growth Trend Analysis By Source, 2020 to 2024
    • Absolute $ Opportunity Analysis By Source, 2025 to 2035
  9. Global Market Analysis 2020 to 2024 and Forecast 2025 to 2035, By Application Format
    • Introduction / Key Findings
    • Historical Market Size Value (USD Billion) & Volume (Thousand Metric Tons) Analysis By Application Format, 2020 to 2024
    • Current and Future Market Size Value (USD Billion) & Volume (Thousand Metric Tons) Analysis and Forecast By Application Format, 2025 to 2035
      • Capsules/Tablets
      • Powders
      • Softgels
      • Gummies
      • Liquids & Shots
      • Functional Foods/Beverages
      • Sachets & Stick Packs
    • Y-o-Y Growth Trend Analysis By Application Format, 2020 to 2024
    • Absolute $ Opportunity Analysis By Application Format, 2025 to 2035
  10. Global Market Analysis 2020 to 2024 and Forecast 2025 to 2035, By Region
    • Introduction
    • Historical Market Size Value (USD Billion) & Volume (Thousand Metric Tons) Analysis By Region, 2020 to 2024
    • Current Market Size Value (USD Billion) & Volume (Thousand Metric Tons) Analysis and Forecast By Region, 2025 to 2035
      • North America
      • Latin America
      • Western Europe
      • Eastern Europe
      • East Asia
      • South Asia & Pacific
      • Middle East and Africa
    • Market Attractiveness Analysis By Region
  11. North America Market Analysis 2020 to 2024 and Forecast 2025 to 2035, By Country
    • Historical Market Size Value (USD Billion) & Volume (Thousand Metric Tons) Trend Analysis By Market Taxonomy, 2020 to 2024
    • Market Size Value (USD Billion) & Volume (Thousand Metric Tons) Forecast By Market Taxonomy, 2025 to 2035
      • By Country
        • USA
        • Canada
        • Mexico
      • By Active Type
      • By Health Function
      • By Source
      • By Application Format
    • Market Attractiveness Analysis
      • By Country
      • By Active Type
      • By Health Function
      • By Source
      • By Application Format
    • Key Takeaways
  12. Latin America Market Analysis 2020 to 2024 and Forecast 2025 to 2035, By Country
    • Historical Market Size Value (USD Billion) & Volume (Thousand Metric Tons) Trend Analysis By Market Taxonomy, 2020 to 2024
    • Market Size Value (USD Billion) & Volume (Thousand Metric Tons) Forecast By Market Taxonomy, 2025 to 2035
      • By Country
        • Brazil
        • Argentina
        • Rest of LATAM
      • By Active Type
      • By Health Function
      • By Source
      • By Application Format
    • Market Attractiveness Analysis
      • By Country
      • By Active Type
      • By Health Function
      • By Source
      • By Application Format
    • Key Takeaways
  13. Western Europe Market Analysis 2020 to 2024 and Forecast 2025 to 2035, By Country
    • Historical Market Size Value (USD Billion) & Volume (Thousand Metric Tons) Trend Analysis By Market Taxonomy, 2020 to 2024
    • Market Size Value (USD Billion) & Volume (Thousand Metric Tons) Forecast By Market Taxonomy, 2025 to 2035
      • By Country
        • Germany
        • Italy
        • France
        • UK
        • Spain
        • BENELUX
        • Nordic
        • Rest of W.Europe
      • By Active Type
      • By Health Function
      • By Source
      • By Application Format
    • Market Attractiveness Analysis
      • By Country
      • By Active Type
      • By Health Function
      • By Source
      • By Application Format
    • Key Takeaways
  14. Eastern Europe Market Analysis 2020 to 2024 and Forecast 2025 to 2035, By Country
    • Historical Market Size Value (USD Billion) & Volume (Thousand Metric Tons) Trend Analysis By Market Taxonomy, 2020 to 2024
    • Market Size Value (USD Billion) & Volume (Thousand Metric Tons) Forecast By Market Taxonomy, 2025 to 2035
      • By Country
        • Russia
        • Hungary
        • Poland
        • Balkan & Baltics
        • Rest of E. Europe
      • By Active Type
      • By Health Function
      • By Source
      • By Application Format
    • Market Attractiveness Analysis
      • By Country
      • By Active Type
      • By Health Function
      • By Source
      • By Application Format
    • Key Takeaways
  15. East Asia Market Analysis 2020 to 2024 and Forecast 2025 to 2035, By Country
    • Historical Market Size Value (USD Billion) & Volume (Thousand Metric Tons) Trend Analysis By Market Taxonomy, 2020 to 2024
    • Market Size Value (USD Billion) & Volume (Thousand Metric Tons) Forecast By Market Taxonomy, 2025 to 2035
      • By Country
        • China
        • Japan
        • South Korea
      • By Active Type
      • By Health Function
      • By Source
      • By Application Format
    • Market Attractiveness Analysis
      • By Country
      • By Active Type
      • By Health Function
      • By Source
      • By Application Format
    • Key Takeaways
  16. South Asia & Pacific Market Analysis 2020 to 2024 and Forecast 2025 to 2035, By Country
    • Historical Market Size Value (USD Billion) & Volume (Thousand Metric Tons) Trend Analysis By Market Taxonomy, 2020 to 2024
    • Market Size Value (USD Billion) & Volume (Thousand Metric Tons) Forecast By Market Taxonomy, 2025 to 2035
      • By Country
        • India
        • Australia & New Zealand
        • ASEAN
        • Rest of SAP
      • By Active Type
      • By Health Function
      • By Source
      • By Application Format
    • Market Attractiveness Analysis
      • By Country
      • By Active Type
      • By Health Function
      • By Source
      • By Application Format
    • Key Takeaways
  17. Middle East and Africa Market Analysis 2020 to 2024 and Forecast 2025 to 2035, By Country
    • Historical Market Size Value (USD Billion) & Volume (Thousand Metric Tons) Trend Analysis By Market Taxonomy, 2020 to 2024
    • Market Size Value (USD Billion) & Volume (Thousand Metric Tons) Forecast By Market Taxonomy, 2025 to 2035
      • By Country
        • GCC Countries
        • Northern Africa
        • South Africa
        • Turkiye
        • Rest of MEA
      • By Active Type
      • By Health Function
      • By Source
      • By Application Format
    • Market Attractiveness Analysis
      • By Country
      • By Active Type
      • By Health Function
      • By Source
      • By Application Format
    • Key Takeaways
  18. Key Countries Market Analysis
    • USA
      • Pricing Analysis
      • Market Share Analysis, 2024
        • By Active Type
        • By Health Function
        • By Source
        • By Application Format
    • Canada
      • Pricing Analysis
      • Market Share Analysis, 2024
        • By Active Type
        • By Health Function
        • By Source
        • By Application Format
    • Brazil
      • Pricing Analysis
      • Market Share Analysis, 2024
        • By Active Type
        • By Health Function
        • By Source
        • By Application Format
    • Mexico
      • Pricing Analysis
      • Market Share Analysis, 2024
        • By Active Type
        • By Health Function
        • By Source
        • By Application Format
    • Argentina
      • Pricing Analysis
      • Market Share Analysis, 2024
        • By Active Type
        • By Health Function
        • By Source
        • By Application Format
  19. Market Structure Analysis
    • Competition Dashboard
    • Competition Benchmarking
    • Market Share Analysis of Top Players
      • By Regional
      • By Active Type
      • By Health Function
      • By Source
      • By Application Format
  20. Competition Analysis
    • Competition Deep Dive
      • DSM-Firmenich
        • Overview
        • Product Portfolio
        • Profitability by Market Segments (Product/Age /Sales Channel/Region)
        • Sales Footprint
        • Strategy Overview
          • Marketing Strategy
          • Product Strategy
          • Channel Strategy
      • Lonza
        • Overview
        • Product Portfolio
        • Profitability by Market Segments (Product/Age /Sales Channel/Region)
        • Sales Footprint
        • Strategy Overview
          • Marketing Strategy
          • Product Strategy
          • Channel Strategy
      • Glanbia Nutritionals
        • Overview
        • Product Portfolio
        • Profitability by Market Segments (Product/Age /Sales Channel/Region)
        • Sales Footprint
        • Strategy Overview
          • Marketing Strategy
          • Product Strategy
          • Channel Strategy
      • ADM
        • Overview
        • Product Portfolio
        • Profitability by Market Segments (Product/Age /Sales Channel/Region)
        • Sales Footprint
        • Strategy Overview
          • Marketing Strategy
          • Product Strategy
          • Channel Strategy
      • BASF
        • Overview
        • Product Portfolio
        • Profitability by Market Segments (Product/Age /Sales Channel/Region)
        • Sales Footprint
        • Strategy Overview
          • Marketing Strategy
          • Product Strategy
          • Channel Strategy
  21. Assumptions & Acronyms Used
  22. Research Methodology

List of Tables

  • Table 1: Global Market Value (USD Billion) Forecast by Region, 2020-2035
  • Table 2: Global Market Volume (Thousand Metric Tons) Forecast by Region, 2020-2035
  • Table 3: Global Market Value (USD Billion) Forecast by Active Type, 2020-2035
  • Table 4: Global Market Volume (Thousand Metric Tons) Forecast by Active Type, 2020-2035
  • Table 5: Global Market Value (USD Billion) Forecast by Health Function, 2020-2035
  • Table 6: Global Market Volume (Thousand Metric Tons) Forecast by Health Function, 2020-2035
  • Table 7: Global Market Value (USD Billion) Forecast by Source, 2020-2035
  • Table 8: Global Market Volume (Thousand Metric Tons) Forecast by Source, 2020-2035
  • Table 9: Global Market Value (USD Billion) Forecast by Application Format, 2020-2035
  • Table 10: Global Market Volume (Thousand Metric Tons) Forecast by Application Format, 2020-2035
  • Table 11: North America Market Value (USD Billion) Forecast by Country, 2020-2035
  • Table 12: North America Market Volume (Thousand Metric Tons) Forecast by Country, 2020-2035
  • Table 13: North America Market Value (USD Billion) Forecast by Active Type, 2020-2035
  • Table 14: North America Market Volume (Thousand Metric Tons) Forecast by Active Type, 2020-2035
  • Table 15: North America Market Value (USD Billion) Forecast by Health Function, 2020-2035
  • Table 16: North America Market Volume (Thousand Metric Tons) Forecast by Health Function, 2020-2035
  • Table 17: North America Market Value (USD Billion) Forecast by Source, 2020-2035
  • Table 18: North America Market Volume (Thousand Metric Tons) Forecast by Source, 2020-2035
  • Table 19: North America Market Value (USD Billion) Forecast by Application Format, 2020-2035
  • Table 20: North America Market Volume (Thousand Metric Tons) Forecast by Application Format, 2020-2035
  • Table 21: Latin America Market Value (USD Billion) Forecast by Country, 2020-2035
  • Table 22: Latin America Market Volume (Thousand Metric Tons) Forecast by Country, 2020-2035
  • Table 23: Latin America Market Value (USD Billion) Forecast by Active Type, 2020-2035
  • Table 24: Latin America Market Volume (Thousand Metric Tons) Forecast by Active Type, 2020-2035
  • Table 25: Latin America Market Value (USD Billion) Forecast by Health Function, 2020-2035
  • Table 26: Latin America Market Volume (Thousand Metric Tons) Forecast by Health Function, 2020-2035
  • Table 27: Latin America Market Value (USD Billion) Forecast by Source, 2020-2035
  • Table 28: Latin America Market Volume (Thousand Metric Tons) Forecast by Source, 2020-2035
  • Table 29: Latin America Market Value (USD Billion) Forecast by Application Format, 2020-2035
  • Table 30: Latin America Market Volume (Thousand Metric Tons) Forecast by Application Format, 2020-2035
  • Table 31: Western Europe Market Value (USD Billion) Forecast by Country, 2020-2035
  • Table 32: Western Europe Market Volume (Thousand Metric Tons) Forecast by Country, 2020-2035
  • Table 33: Western Europe Market Value (USD Billion) Forecast by Active Type, 2020-2035
  • Table 34: Western Europe Market Volume (Thousand Metric Tons) Forecast by Active Type, 2020-2035
  • Table 35: Western Europe Market Value (USD Billion) Forecast by Health Function, 2020-2035
  • Table 36: Western Europe Market Volume (Thousand Metric Tons) Forecast by Health Function, 2020-2035
  • Table 37: Western Europe Market Value (USD Billion) Forecast by Source, 2020-2035
  • Table 38: Western Europe Market Volume (Thousand Metric Tons) Forecast by Source, 2020-2035
  • Table 39: Western Europe Market Value (USD Billion) Forecast by Application Format, 2020-2035
  • Table 40: Western Europe Market Volume (Thousand Metric Tons) Forecast by Application Format, 2020-2035
  • Table 41: Eastern Europe Market Value (USD Billion) Forecast by Country, 2020-2035
  • Table 42: Eastern Europe Market Volume (Thousand Metric Tons) Forecast by Country, 2020-2035
  • Table 43: Eastern Europe Market Value (USD Billion) Forecast by Active Type, 2020-2035
  • Table 44: Eastern Europe Market Volume (Thousand Metric Tons) Forecast by Active Type, 2020-2035
  • Table 45: Eastern Europe Market Value (USD Billion) Forecast by Health Function, 2020-2035
  • Table 46: Eastern Europe Market Volume (Thousand Metric Tons) Forecast by Health Function, 2020-2035
  • Table 47: Eastern Europe Market Value (USD Billion) Forecast by Source, 2020-2035
  • Table 48: Eastern Europe Market Volume (Thousand Metric Tons) Forecast by Source, 2020-2035
  • Table 49: Eastern Europe Market Value (USD Billion) Forecast by Application Format, 2020-2035
  • Table 50: Eastern Europe Market Volume (Thousand Metric Tons) Forecast by Application Format, 2020-2035
  • Table 51: East Asia Market Value (USD Billion) Forecast by Country, 2020-2035
  • Table 52: East Asia Market Volume (Thousand Metric Tons) Forecast by Country, 2020-2035
  • Table 53: East Asia Market Value (USD Billion) Forecast by Active Type, 2020-2035
  • Table 54: East Asia Market Volume (Thousand Metric Tons) Forecast by Active Type, 2020-2035
  • Table 55: East Asia Market Value (USD Billion) Forecast by Health Function, 2020-2035
  • Table 56: East Asia Market Volume (Thousand Metric Tons) Forecast by Health Function, 2020-2035
  • Table 57: East Asia Market Value (USD Billion) Forecast by Source, 2020-2035
  • Table 58: East Asia Market Volume (Thousand Metric Tons) Forecast by Source, 2020-2035
  • Table 59: East Asia Market Value (USD Billion) Forecast by Application Format, 2020-2035
  • Table 60: East Asia Market Volume (Thousand Metric Tons) Forecast by Application Format, 2020-2035
  • Table 61: South Asia & Pacific Market Value (USD Billion) Forecast by Country, 2020-2035
  • Table 62: South Asia & Pacific Market Volume (Thousand Metric Tons) Forecast by Country, 2020-2035
  • Table 63: South Asia & Pacific Market Value (USD Billion) Forecast by Active Type, 2020-2035
  • Table 64: South Asia & Pacific Market Volume (Thousand Metric Tons) Forecast by Active Type, 2020-2035
  • Table 65: South Asia & Pacific Market Value (USD Billion) Forecast by Health Function, 2020-2035
  • Table 66: South Asia & Pacific Market Volume (Thousand Metric Tons) Forecast by Health Function, 2020-2035
  • Table 67: South Asia & Pacific Market Value (USD Billion) Forecast by Source, 2020-2035
  • Table 68: South Asia & Pacific Market Volume (Thousand Metric Tons) Forecast by Source, 2020-2035
  • Table 69: South Asia & Pacific Market Value (USD Billion) Forecast by Application Format, 2020-2035
  • Table 70: South Asia & Pacific Market Volume (Thousand Metric Tons) Forecast by Application Format, 2020-2035
  • Table 71: Middle East and Africa Market Value (USD Billion) Forecast by Country, 2020-2035
  • Table 72: Middle East and Africa Market Volume (Thousand Metric Tons) Forecast by Country, 2020-2035
  • Table 73: Middle East and Africa Market Value (USD Billion) Forecast by Active Type, 2020-2035
  • Table 74: Middle East and Africa Market Volume (Thousand Metric Tons) Forecast by Active Type, 2020-2035
  • Table 75: Middle East and Africa Market Value (USD Billion) Forecast by Health Function, 2020-2035
  • Table 76: Middle East and Africa Market Volume (Thousand Metric Tons) Forecast by Health Function, 2020-2035
  • Table 77: Middle East and Africa Market Value (USD Billion) Forecast by Source, 2020-2035
  • Table 78: Middle East and Africa Market Volume (Thousand Metric Tons) Forecast by Source, 2020-2035
  • Table 79: Middle East and Africa Market Value (USD Billion) Forecast by Application Format, 2020-2035
  • Table 80: Middle East and Africa Market Volume (Thousand Metric Tons) Forecast by Application Format, 2020-2035

List of Figures

  • Figure 1: Global Market Volume (Thousand Metric Tons) Forecast 2020-2035
  • Figure 2: Global Market Pricing Analysis
  • Figure 3: Global Market Value (USD Billion) Forecast 2020-2035
  • Figure 4: Global Market Value Share and BPS Analysis by Active Type, 2025 and 2035
  • Figure 5: Global Market Y-o-Y Growth Comparison by Active Type, 2025-2035
  • Figure 6: Global Market Attractiveness Analysis by Active Type
  • Figure 7: Global Market Value Share and BPS Analysis by Health Function, 2025 and 2035
  • Figure 8: Global Market Y-o-Y Growth Comparison by Health Function, 2025-2035
  • Figure 9: Global Market Attractiveness Analysis by Health Function
  • Figure 10: Global Market Value Share and BPS Analysis by Source, 2025 and 2035
  • Figure 11: Global Market Y-o-Y Growth Comparison by Source, 2025-2035
  • Figure 12: Global Market Attractiveness Analysis by Source
  • Figure 13: Global Market Value Share and BPS Analysis by Application Format, 2025 and 2035
  • Figure 14: Global Market Y-o-Y Growth Comparison by Application Format, 2025-2035
  • Figure 15: Global Market Attractiveness Analysis by Application Format
  • Figure 16: Global Market Value (USD Billion) Share and BPS Analysis by Region, 2025 and 2035
  • Figure 17: Global Market Y-o-Y Growth Comparison by Region, 2025-2035
  • Figure 18: Global Market Attractiveness Analysis by Region
  • Figure 19: North America Market Incremental $ Opportunity, 2025-2035
  • Figure 20: Latin America Market Incremental $ Opportunity, 2025-2035
  • Figure 21: Western Europe Market Incremental $ Opportunity, 2025-2035
  • Figure 22: Eastern Europe Market Incremental $ Opportunity, 2025-2035
  • Figure 23: East Asia Market Incremental $ Opportunity, 2025-2035
  • Figure 24: South Asia & Pacific Market Incremental $ Opportunity, 2025-2035
  • Figure 25: Middle East and Africa Market Incremental $ Opportunity, 2025-2035
  • Figure 26: North America Market Value Share and BPS Analysis by Country, 2025 and 2035
  • Figure 27: North America Market Value Share and BPS Analysis by Active Type, 2025 and 2035
  • Figure 28: North America Market Y-o-Y Growth Comparison by Active Type, 2025-2035
  • Figure 29: North America Market Attractiveness Analysis by Active Type
  • Figure 30: North America Market Value Share and BPS Analysis by Health Function, 2025 and 2035
  • Figure 31: North America Market Y-o-Y Growth Comparison by Health Function, 2025-2035
  • Figure 32: North America Market Attractiveness Analysis by Health Function
  • Figure 33: North America Market Value Share and BPS Analysis by Source, 2025 and 2035
  • Figure 34: North America Market Y-o-Y Growth Comparison by Source, 2025-2035
  • Figure 35: North America Market Attractiveness Analysis by Source
  • Figure 36: North America Market Value Share and BPS Analysis by Application Format, 2025 and 2035
  • Figure 37: North America Market Y-o-Y Growth Comparison by Application Format, 2025-2035
  • Figure 38: North America Market Attractiveness Analysis by Application Format
  • Figure 39: Latin America Market Value Share and BPS Analysis by Country, 2025 and 2035
  • Figure 40: Latin America Market Value Share and BPS Analysis by Active Type, 2025 and 2035
  • Figure 41: Latin America Market Y-o-Y Growth Comparison by Active Type, 2025-2035
  • Figure 42: Latin America Market Attractiveness Analysis by Active Type
  • Figure 43: Latin America Market Value Share and BPS Analysis by Health Function, 2025 and 2035
  • Figure 44: Latin America Market Y-o-Y Growth Comparison by Health Function, 2025-2035
  • Figure 45: Latin America Market Attractiveness Analysis by Health Function
  • Figure 46: Latin America Market Value Share and BPS Analysis by Source, 2025 and 2035
  • Figure 47: Latin America Market Y-o-Y Growth Comparison by Source, 2025-2035
  • Figure 48: Latin America Market Attractiveness Analysis by Source
  • Figure 49: Latin America Market Value Share and BPS Analysis by Application Format, 2025 and 2035
  • Figure 50: Latin America Market Y-o-Y Growth Comparison by Application Format, 2025-2035
  • Figure 51: Latin America Market Attractiveness Analysis by Application Format
  • Figure 52: Western Europe Market Value Share and BPS Analysis by Country, 2025 and 2035
  • Figure 53: Western Europe Market Value Share and BPS Analysis by Active Type, 2025 and 2035
  • Figure 54: Western Europe Market Y-o-Y Growth Comparison by Active Type, 2025-2035
  • Figure 55: Western Europe Market Attractiveness Analysis by Active Type
  • Figure 56: Western Europe Market Value Share and BPS Analysis by Health Function, 2025 and 2035
  • Figure 57: Western Europe Market Y-o-Y Growth Comparison by Health Function, 2025-2035
  • Figure 58: Western Europe Market Attractiveness Analysis by Health Function
  • Figure 59: Western Europe Market Value Share and BPS Analysis by Source, 2025 and 2035
  • Figure 60: Western Europe Market Y-o-Y Growth Comparison by Source, 2025-2035
  • Figure 61: Western Europe Market Attractiveness Analysis by Source
  • Figure 62: Western Europe Market Value Share and BPS Analysis by Application Format, 2025 and 2035
  • Figure 63: Western Europe Market Y-o-Y Growth Comparison by Application Format, 2025-2035
  • Figure 64: Western Europe Market Attractiveness Analysis by Application Format
  • Figure 65: Eastern Europe Market Value Share and BPS Analysis by Country, 2025 and 2035
  • Figure 66: Eastern Europe Market Value Share and BPS Analysis by Active Type, 2025 and 2035
  • Figure 67: Eastern Europe Market Y-o-Y Growth Comparison by Active Type, 2025-2035
  • Figure 68: Eastern Europe Market Attractiveness Analysis by Active Type
  • Figure 69: Eastern Europe Market Value Share and BPS Analysis by Health Function, 2025 and 2035
  • Figure 70: Eastern Europe Market Y-o-Y Growth Comparison by Health Function, 2025-2035
  • Figure 71: Eastern Europe Market Attractiveness Analysis by Health Function
  • Figure 72: Eastern Europe Market Value Share and BPS Analysis by Source, 2025 and 2035
  • Figure 73: Eastern Europe Market Y-o-Y Growth Comparison by Source, 2025-2035
  • Figure 74: Eastern Europe Market Attractiveness Analysis by Source
  • Figure 75: Eastern Europe Market Value Share and BPS Analysis by Application Format, 2025 and 2035
  • Figure 76: Eastern Europe Market Y-o-Y Growth Comparison by Application Format, 2025-2035
  • Figure 77: Eastern Europe Market Attractiveness Analysis by Application Format
  • Figure 78: East Asia Market Value Share and BPS Analysis by Country, 2025 and 2035
  • Figure 79: East Asia Market Value Share and BPS Analysis by Active Type, 2025 and 2035
  • Figure 80: East Asia Market Y-o-Y Growth Comparison by Active Type, 2025-2035
  • Figure 81: East Asia Market Attractiveness Analysis by Active Type
  • Figure 82: East Asia Market Value Share and BPS Analysis by Health Function, 2025 and 2035
  • Figure 83: East Asia Market Y-o-Y Growth Comparison by Health Function, 2025-2035
  • Figure 84: East Asia Market Attractiveness Analysis by Health Function
  • Figure 85: East Asia Market Value Share and BPS Analysis by Source, 2025 and 2035
  • Figure 86: East Asia Market Y-o-Y Growth Comparison by Source, 2025-2035
  • Figure 87: East Asia Market Attractiveness Analysis by Source
  • Figure 88: East Asia Market Value Share and BPS Analysis by Application Format, 2025 and 2035
  • Figure 89: East Asia Market Y-o-Y Growth Comparison by Application Format, 2025-2035
  • Figure 90: East Asia Market Attractiveness Analysis by Application Format
  • Figure 91: South Asia & Pacific Market Value Share and BPS Analysis by Country, 2025 and 2035
  • Figure 92: South Asia & Pacific Market Value Share and BPS Analysis by Active Type, 2025 and 2035
  • Figure 93: South Asia & Pacific Market Y-o-Y Growth Comparison by Active Type, 2025-2035
  • Figure 94: South Asia & Pacific Market Attractiveness Analysis by Active Type
  • Figure 95: South Asia & Pacific Market Value Share and BPS Analysis by Health Function, 2025 and 2035
  • Figure 96: South Asia & Pacific Market Y-o-Y Growth Comparison by Health Function, 2025-2035
  • Figure 97: South Asia & Pacific Market Attractiveness Analysis by Health Function
  • Figure 98: South Asia & Pacific Market Value Share and BPS Analysis by Source, 2025 and 2035
  • Figure 99: South Asia & Pacific Market Y-o-Y Growth Comparison by Source, 2025-2035
  • Figure 100: South Asia & Pacific Market Attractiveness Analysis by Source
  • Figure 101: South Asia & Pacific Market Value Share and BPS Analysis by Application Format, 2025 and 2035
  • Figure 102: South Asia & Pacific Market Y-o-Y Growth Comparison by Application Format, 2025-2035
  • Figure 103: South Asia & Pacific Market Attractiveness Analysis by Application Format
  • Figure 104: Middle East and Africa Market Value Share and BPS Analysis by Country, 2025 and 2035
  • Figure 105: Middle East and Africa Market Value Share and BPS Analysis by Active Type, 2025 and 2035
  • Figure 106: Middle East and Africa Market Y-o-Y Growth Comparison by Active Type, 2025-2035
  • Figure 107: Middle East and Africa Market Attractiveness Analysis by Active Type
  • Figure 108: Middle East and Africa Market Value Share and BPS Analysis by Health Function, 2025 and 2035
  • Figure 109: Middle East and Africa Market Y-o-Y Growth Comparison by Health Function, 2025-2035
  • Figure 110: Middle East and Africa Market Attractiveness Analysis by Health Function
  • Figure 111: Middle East and Africa Market Value Share and BPS Analysis by Source, 2025 and 2035
  • Figure 112: Middle East and Africa Market Y-o-Y Growth Comparison by Source, 2025-2035
  • Figure 113: Middle East and Africa Market Attractiveness Analysis by Source
  • Figure 114: Middle East and Africa Market Value Share and BPS Analysis by Application Format, 2025 and 2035
  • Figure 115: Middle East and Africa Market Y-o-Y Growth Comparison by Application Format, 2025-2035
  • Figure 116: Middle East and Africa Market Attractiveness Analysis by Application Format
  • Figure 117: Global Market - Tier Structure Analysis
  • Figure 118: Global Market - Company Share Analysis

Frequently Asked Questions

What is the projected industry value of the nutraceutical actives market in 2025?

The industry is projected to reach USD 45.57 billion in 2025.

What is the expected global CAGR for the nutraceutical actives market from 2025 to 2035?

The industry is expected to grow at a CAGR of 4.1% from 2025 to 2035.

Which segment is expected to dominate the nutraceutical actives market in 2025?

Botanical extracts are expected to capture 21.30% in 2025.

Which region is forecasted to show significant growth in the nutraceutical actives market by 2025?

The Asia Pacific region, particularly India and China, is projected to register significant growth.

What is the forecasted industry value of the nutraceutical actives market by 2035?

The industry is projected to reach USD 68.24 billion by 2035.

Explore Similar Insights

Future Market Insights

Nutraceutical Actives Market