Bio-Fermented Actives Market Forecast and Outlook 2025 to 2035

The global bio-fermented actives market is projected to grow from USD 1,651.4 million in 2025 to approximately USD 5,752.6 million by 2035, recording an absolute increase of USD 4,101.2 million over the forecast period. This translates into a total growth of 248.3%, with the market forecast to expand at a compound annual growth rate (CAGR) of 13.3% between 2025 and 2035. The overall market size is expected to grow by nearly 3.5X during the same period, supported by the rising adoption of biotechnology in skincare formulation and increasing demand for sustainable, naturally-derived beauty solutions.
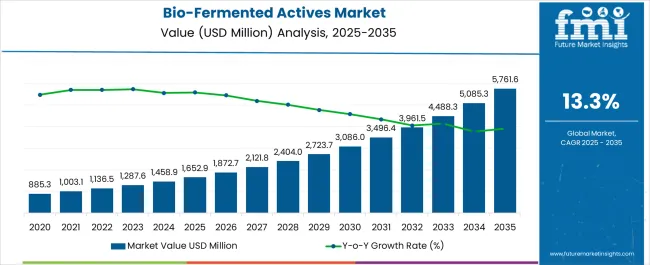
Quick Stats for Bio-Fermented Actives Market

  • Bio-Fermented Actives Market Value (2025): USD 1,651.4 million
  • Bio-Fermented Actives Market Forecast Value (2035): USD 5,752.6 million
  • Bio-Fermented Actives Market Forecast CAGR: 13.3%
  • Leading Function in Bio-Fermented Actives Market: Skin barrier strengthening (52.5%)
  • Key Growth Regions in Bio-Fermented Actives Market: Asia Pacific, North America, and Europe
  • Top Key Players in Bio-Fermented Actives Market: Amorepacific, Missha, Cosrx, Sulwhasoo, L'Oréal, Dr. Jart+, SK-II, The Face Shop, Neogen, Innisfree

Bio Fermented Actives Market Market Value Analysis

Between 2025 and 2030, the Bio-Fermented Actives market is projected to expand from USD 1,651.4 million to USD 3,083.6 million, resulting in a value increase of USD 1,432.2 million, which represents 34.9% of the total forecast growth for the decade. This phase of growth will be shaped by rising penetration of biotechnology in beauty and skincare, increasing consumer demand for clean-label solutions, and growing awareness about the benefits of fermented skincare ingredients. Service providers are expanding their fermentation capabilities to address the growing complexity of sustainable beauty requirements.

From 2030 to 2035, the market is forecast to grow from USD 3,083.6 million to USD 5,752.6 million, adding another USD 2,669.0 million, which constitutes 65.1% of the overall ten-year expansion. This period is expected to be characterized by advancement of fermentation technologies for skincare applications, integration of probiotic-derived formulations, and development of sophisticated biotechnology platforms across different product categories. The growing adoption of K-beauty trends and clean-label personalization will drive demand for more advanced bio-fermented formulation capabilities.

Between 2020 and 2025, the Bio-Fermented Actives market experienced rapid expansion, driven by technological breakthroughs in fermentation processes and increasing consumer awareness of sustainable beauty solutions. The market developed as consumers became increasingly interested in naturally-derived, science-backed ingredients and beauty brands recognized the potential of bio-fermented actives to differentiate their offerings and enhance product efficacy.

Bio-Fermented Actives Market Key Takeaways

Metric Value
Estimated Size (2025E) USD 1,651.4 million
Projected Value (2035F) USD 5,752.6 million
CAGR (2025 to 2035) 13.3%

Why the Bio-Fermented Actives Market is Growing?

Market expansion is being supported by the rapid advancement of biotechnology and increasing consumer demand for sustainable skincare solutions that deliver enhanced bioavailability and potency through fermentation processes. Modern consumers seek products that are naturally-derived yet scientifically-proven, moving away from synthetic alternatives toward bio-compatible formulations that work in harmony with skin's natural microbiome.

The growing sophistication of fermentation technologies, including precision fermentation, microbial cultivation, and biotechnology integration, is enabling more effective ingredient delivery and driving demand for bio-fermented formulation platforms. Beauty brands are increasingly investing in fermentation capabilities to offer differentiated products that provide superior skin benefits while meeting clean-label and sustainability requirements.

Segmental Analysis

The market is segmented by source, function, product type, claim, and channel. By source, the market is divided into yeast-fermented extracts, lactobacillus-fermented peptides, rice/soy fermentation, and fruit/plant ferments. Based on function, the market is categorized into skin barrier strengthening, anti-aging, brightening, and soothing. In terms of product type, the market is segmented into serums, essences, creams, and masks. By claim, the market is classified into probiotic-derived, clean-label, vegan, and COSMOS/ECOCERT certified. By channel, the market is divided into e-commerce, K-beauty specialty retail, pharmacies, and mass retail. Regionally, the market is divided into North America, Europe, East Asia, South Asia & Pacific, Latin America, and Middle East & Africa.

By Source, Yeast-Fermented Extracts Segment Leads Market Growth

Yeast-fermented extracts are projected to account for the largest share of the Bio-Fermented Actives market in 2025, with values ranging from USD 1,652.9 million to USD 5,752.6 million by 2035, establishing their position as the leading source category in the global marketplace. This dominant market position is fundamentally supported by the superior bioavailability and enhanced penetration properties of yeast-derived compounds, combined with their proven efficacy in skincare applications.

The preference for yeast-fermented extracts stems from their ability to provide multiple skin benefits including improved hydration, enhanced barrier function, and accelerated cellular renewal. Yeast fermentation processes break down complex molecules into smaller, more bioactive compounds that can be easily absorbed by the skin, resulting in more effective product formulations compared to non-fermented alternatives.

The market leadership of yeast-fermented extracts is further reinforced by extensive research supporting their anti-aging and skin-strengthening properties, as well as their compatibility with various product formulations. The segment benefits from established production methods and growing consumer recognition of yeast-derived ingredients as premium, science-backed skincare solutions.
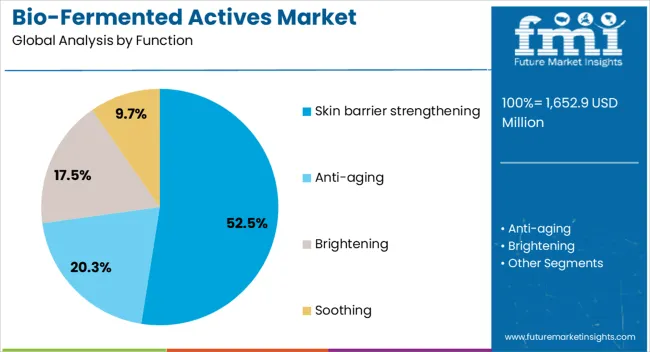
By Function, Skin Barrier Strengthening Segment Accounts for 52.5% Market Share

Bio Fermented Actives Market Analysis By Function

Skin barrier strengthening function is expected to represent 52.5% of bio-fermented actives demand in 2025, valued at USD 866.7 million, establishing its dominance in the global market landscape. This commanding market position reflects the growing awareness of skin barrier health importance and the proven effectiveness of fermented ingredients in strengthening the skin's natural protective functions.

The skin barrier strengthening segment benefits from the unique properties of bio-fermented actives that can enhance ceramide production, improve lipid barrier integrity, and support the skin microbiome balance. Modern bio-fermented formulations feature specialized peptides, amino acids, and postbiotic compounds that work synergistically to restore and maintain optimal barrier function.

The segment's growth is further supported by increasing incidence of sensitive skin conditions, growing awareness of environmental damage to skin barrier, and the effectiveness of fermented ingredients in providing gentle yet powerful barrier support. Bio-fermented actives enable the creation of products that strengthen skin resilience while providing long-term protective benefits.

By Product Type, Serums Segment Dominates Market Applications

Serums represent the leading product type for bio-fermented actives delivery, capitalizing on the concentrated nature of fermented ingredients and consumer preference for targeted skincare treatments. The lightweight, fast-absorbing format of serums provides optimal delivery for bio-fermented compounds, enabling maximum bioavailability and skin penetration.

The competitive advantage of serums lies in their ability to deliver high concentrations of active fermented ingredients without heavy textures, making them ideal for layering in multi-step skincare routines. This format aligns perfectly with K-beauty and Asian skincare trends that emphasize essence-like products with potent active ingredients.

Serums offer consumers precision targeting of specific skin concerns while maximizing the benefits of expensive fermented actives through concentrated formulations. The format supports premium positioning and enables brands to showcase the sophisticated nature of their bio-fermentation technology.
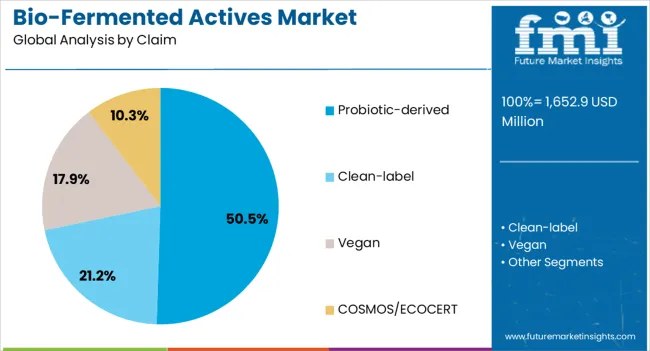
By Claim, Probiotic-Derived Segment Accounts for 50.5% Market Share

Bio Fermented Actives Market Analysis By Claim

Probiotic-derived claims are projected to contribute 50.5% of the bio-fermented actives market in 2025, valued at USD 833.3 million, representing the preferred positioning for fermented skincare solutions. This claim category aligns perfectly with consumer interest in microbiome-friendly skincare and the scientific understanding of skin health as connected to beneficial microorganisms.

The competitive advantage of probiotic-derived positioning lies in its ability to communicate both the natural origin and scientific sophistication of fermented ingredients. This claim supports premium pricing while building consumer trust through association with proven health benefits of probiotics in other categories.

Probiotic-derived claims offer brands differentiation in the crowded skincare market while educating consumers about the benefits of fermentation processes. The positioning creates strong consumer appeal among health-conscious buyers who understand the connection between microbiome health and skin appearance.
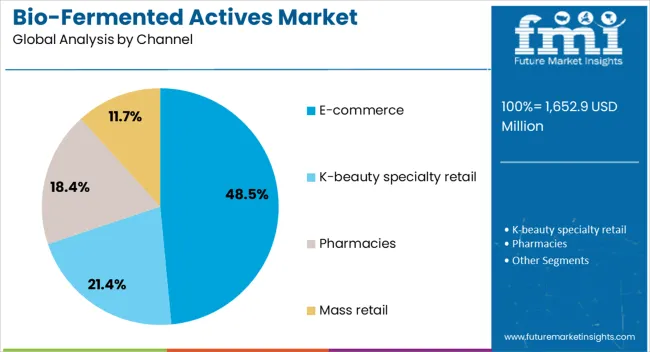
By Channel, E-commerce Segment Accounts for 48.5% Market Share

Bio Fermented Actives Market Analysis By Channel

E-commerce channels are projected to contribute 48.5% of the bio-fermented actives market in 2025, valued at USD 800.1 million, representing the preferred distribution method for fermented skincare products. This channel dominance reflects the educational nature of bio-fermented products and the need for detailed product information that online platforms can provide effectively.

The competitive advantage of e-commerce distribution lies in its ability to reach educated consumers who research ingredients and understand the benefits of fermented actives. Online channels enable brands to provide comprehensive education about fermentation processes, ingredient benefits, and usage instructions that are essential for bio-fermented product success.

E-commerce platforms offer consumers access to specialized K-beauty and niche brands that lead innovation in bio-fermented actives, while providing detailed reviews and ingredient analysis that support informed purchasing decisions. The channel supports direct-to-consumer relationships that are crucial for premium fermented skincare brands.

What are the Drivers, Restraints, and Key Trends of the Bio-Fermented Actives Market?

The Bio-Fermented Actives market is advancing rapidly due to technological innovation in fermentation processes and increasing consumer demand for sustainable, naturally-derived beauty solutions. However, the market faces challenges including high production costs for fermentation facilities, need for specialized storage and handling requirements, and varying regulatory acceptance of novel fermented ingredients across different regions. Standardization of fermentation processes and efficacy testing continue to influence market development patterns.

Integration of Advanced Fermentation Technologies

The growing deployment of sophisticated fermentation technologies including precision fermentation, controlled environment cultivation, and multi-strain fermentation systems is enabling more consistent and potent ingredient production. These technologies provide enhanced bioactivity and stability that improves product efficacy and enables continuous quality optimization based on fermentation parameters.

Expansion of K-Beauty and Asian Skincare Influence

Modern beauty trends are incorporating traditional Asian fermentation wisdom with contemporary biotechnology to create innovative skincare solutions. Integration of time-honored fermentation practices with modern science provides deeper understanding of ingredient synergies and enables development of culturally-inspired yet scientifically-advanced formulations.
Analysis of Bio-Fermented Actives Market by Key Country

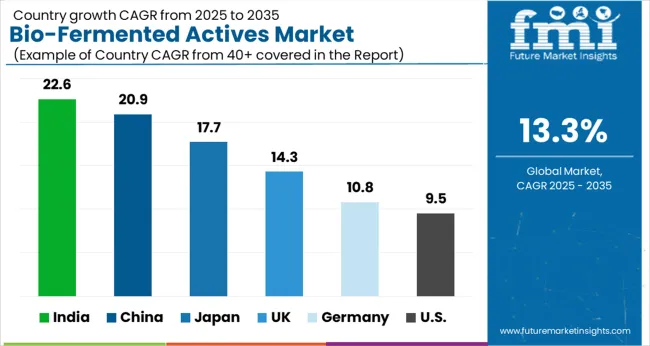
Bio Fermented Actives Market Cagr Analysis By Country

Countries CAGR (2025 to 2035)
India 22.6%
China 20.9%
Japan 17.7%
UK 14.3%
Germany 10.8%
USA 9.5%

The bio-fermented actives market is growing rapidly across key regions, with India leading at a 22.6% CAGR through 2035, driven by rising interest in Ayurvedic fermentation traditions combined with modern biotechnology. China follows at 20.9%, supported by strong manufacturing capabilities and consumer acceptance of fermented skincare solutions. Japan grows at 17.7%, emphasizing traditional fermentation expertise and premium product development. The UK records 14.3% growth with focus on clean-label beauty trends. Germany shows 10.8% growth driven by biotechnology innovation and quality standards. The USA demonstrates steady 9.5% growth with established market adoption and diverse consumer segments.

India Leads Global Market Growth with Traditional Innovation

Revenue from bio-fermented actives in India is projected to exhibit the highest growth rate with a CAGR of 22.6% through 2035, driven by the country's rich tradition of fermentation in wellness and beauty applications, combined with increasing modern biotechnology adoption. The convergence of traditional Ayurvedic fermentation practices with contemporary skincare science creates unique opportunities for indigenous innovation and culturally-relevant product development.

  • Traditional fermentation knowledge is being modernized through biotechnology applications, enabling Indian companies to develop unique fermented actives that combine cultural wisdom with scientific validation, appealing to both domestic and international markets seeking authentic, traditional beauty solutions.
  • Growing domestic beauty industry investment in fermentation facilities and research capabilities is supporting development of cost-effective, scalable production methods that can serve both local demand and export opportunities in the global fermented actives market.
  • Consumer acceptance of fermented foods and traditional wellness practices creates natural market receptivity for fermented skincare products, while increasing disposable income enables investment in premium beauty products featuring sophisticated fermentation technology.

China Demonstrates Exceptional Market Potential with Manufacturing Excellence

Revenue from bio-fermented actives in China is expanding at a CAGR of 20.9%, supported by advanced biotechnology infrastructure, significant investment in fermentation research, and strong consumer adoption of innovative skincare solutions. The country's leadership in biotechnology manufacturing and established beauty industry create favorable conditions for large-scale bio-fermented actives production and consumption.
  • Biotechnology sector leadership in fermentation processes is facilitating breakthrough innovations in skincare-specific fermented ingredients, enabling development of highly sophisticated actives that address diverse skin concerns while meeting strict quality and safety standards for both domestic and export markets.
  • Beauty industry integration with biotechnology sector is accelerating development of comprehensive fermentation platforms that combine ingredient production, formulation development, and product manufacturing, creating vertically-integrated ecosystems for bio-fermented skincare solutions.
  • Consumer behavior trends toward science-backed natural products and growing awareness of fermentation benefits are driving demand for premium bio-fermented solutions, particularly among urban consumers who value both traditional wisdom and modern innovation in their skincare routines.

Japan Maintains Strong Growth with Technology Leadership

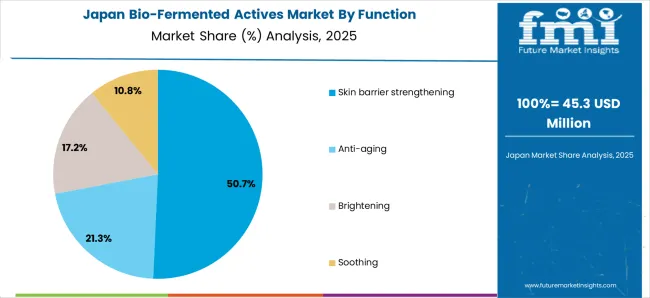
Bio Fermented Actives Market Japan Market Share Analysis By Function

Revenue from bio-fermented actives in Japan is growing at a CAGR of 17.7%, driven by the country's centuries-old fermentation expertise, advanced biotechnology capabilities, and sophisticated consumer preferences for high-quality skincare ingredients. Japanese companies lead global innovation in fermentation applications for beauty, combining traditional sake and koji fermentation knowledge with cutting-edge biotechnology.

  • Fermentation technology leadership is enabling development of proprietary bio-fermented actives that incorporate traditional Japanese ingredients like rice, sake, and koji with modern biotechnology processes, creating unique competitive advantages in the premium skincare market through culturally-rooted innovation.
  • Consumer preference for artisanal quality and proven efficacy drives demand for carefully-crafted fermented ingredients, while cultural appreciation for fermentation processes supports premium positioning of bio-fermented skincare products that deliver measurable results through traditional wisdom.
  • Beauty industry collaboration between traditional fermentation masters and modern biotechnology companies is facilitating development of next-generation fermented actives that honor traditional methods while meeting contemporary performance and safety standards.

United Kingdom Focuses on Clean-Label Innovation

Demand for bio-fermented actives in the UK is projected to grow at a CAGR of 14.3%, supported by strong consumer interest in clean-label beauty solutions, established biotechnology sector, and growing awareness of fermentation benefits for skincare. British consumers demonstrate high interest in naturally-derived yet scientifically-validated ingredients that align with clean beauty trends.
  • Clean beauty market evolution is incorporating bio-fermented actives as premium alternatives to synthetic ingredients, appealing to consumers who seek products that are both naturally-derived and scientifically-proven, with transparent ingredient sourcing and sustainable production methods.
  • Biotechnology innovation in fermentation processes is emphasizing sustainability, traceability, and environmental responsibility, building consumer trust through clear communication of production methods and proven efficacy of fermented ingredients in skincare applications.
  • Beauty industry focus on ingredient transparency and efficacy validation is driving adoption of bio-fermented actives that can demonstrate clear benefits through scientific testing while meeting consumer demand for naturally-derived, environmentally-conscious skincare solutions.

Germany Emphasizes Scientific Validation and Quality

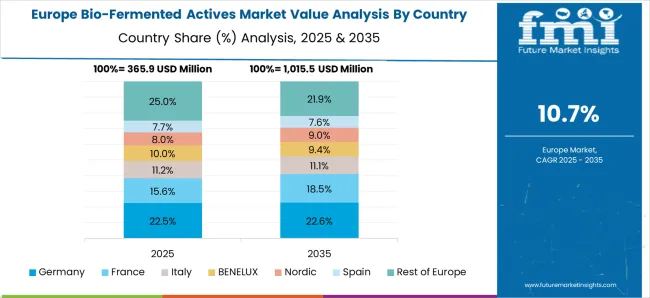
Bio Fermented Actives Market Europe Country Market Share Analysis, 2025 & 2035

Demand for bio-fermented actives in Germany is expanding at a CAGR of 10.8%, driven by the country's strength in biotechnology research, rigorous quality standards, and consumer preference for scientifically-validated ingredients. German companies excel in developing fermentation processes that meet strict regulatory requirements while delivering consistent, high-quality actives for skincare applications.
  • Biotechnology research excellence is driving development of precisely-controlled fermentation processes that ensure consistent quality, optimal bioactivity, and regulatory compliance for bio-fermented skincare ingredients, establishing German suppliers as premium quality sources in the global market.
  • Consumer preference for proven efficacy and safety supports adoption of bio-fermented actives that undergo rigorous testing and validation, while appreciation for sustainable production methods aligns with fermentation processes that minimize environmental impact compared to synthetic alternatives.
  • Beauty industry emphasis on scientific substantiation is facilitating development of bio-fermented actives with comprehensive efficacy data, clinical validation, and clear mode of action documentation that supports premium positioning and regulatory acceptance across international markets.

United States Balances Innovation with Market Diversity

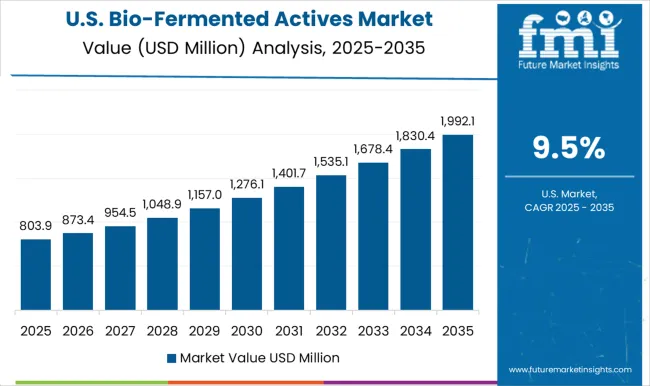
Bio Fermented Actives Market Country Value Analysis

Demand for bio-fermented actives in the USA is growing at a CAGR of 9.5%, characterized by diverse consumer segments, established beauty industry infrastructure, and steady adoption of fermentation-based skincare solutions. The American market demonstrates growing interest in naturally-derived actives while maintaining focus on proven efficacy and convenient application.
  • Beauty technology ecosystem development is enabling comprehensive platforms that combine fermentation expertise with skincare formulation capabilities, supported by investment in biotechnology startups and established beauty industry partnerships across multiple consumer demographics and price points.
  • Consumer adoption patterns demonstrate increasing acceptance of fermented ingredients in skincare, particularly among consumers interested in K-beauty trends and clean-label products, while mainstream acceptance grows through education about fermentation benefits and ingredient efficacy.
  • Market maturation is driving focus on proven results, sustainable sourcing, and integration with existing skincare routines, creating sustainable growth through repeat purchases and positive consumer experiences rather than novelty-driven initial trials of fermented skincare products.

Competitive Landscape of Bio-Fermented Actives Market

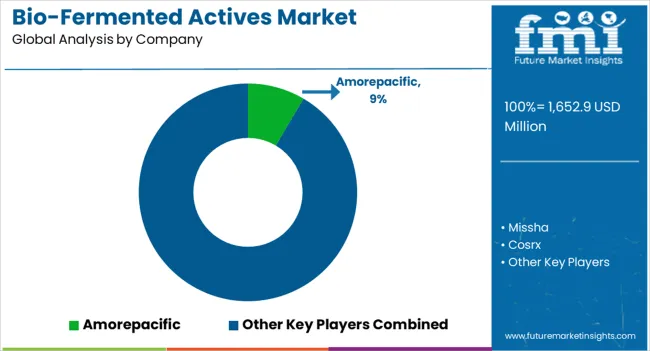
Bio Fermented Actives Market Analysis By Company

The bio-fermented actives market is characterized by competition among K-beauty leaders, established personal care companies, and specialized biotechnology ingredient suppliers. Companies are investing in proprietary fermentation processes, unique ingredient development, sustainable production methods, and comprehensive product portfolios to deliver effective, naturally-derived, and scientifically-validated fermented actives for skincare applications.

Amorepacific leads the market with an 8.5% global value share in 2025, focusing on traditional Korean fermentation expertise combined with modern biotechnology capabilities. The company's leadership position is built on decades of fermentation research and development of proprietary fermented ingredients that combine cultural heritage with scientific innovation.

Other key players maintain competitive positions through specialized expertise: Missha emphasizes accessible fermented skincare with proven ingredients; Cosrx focuses on targeted treatments using fermented actives; Sulwhasoo positions premium fermented formulations rooted in traditional Asian medicine; L'Oréal leverages global research capabilities for fermentation innovation; Dr. Jart+ combines dermatological expertise with fermented ingredients; SK-II builds on signature fermentation technology; The Face Shop offers accessible K-beauty fermentation; Neogen emphasizes innovative fermented treatments; and Innisfree focuses on natural fermentation aligned with clean beauty trends.

The Asia Pacific region leads global bio-fermented actives consumption, driven by traditional fermentation knowledge, established K-beauty trends, and sophisticated consumer understanding of fermented ingredients. Countries like South Korea and Japan leverage centuries of fermentation expertise to create innovative skincare solutions that combine cultural wisdom with modern science.

Key Players in the Bio-Fermented Actives Market

  • Amorepacific
  • Missha
  • Cosrx
  • Sulwhasoo
  • L'Oréal
  • Dr. Jart+
  • SK-II
  • The Face Shop
  • Neogen
  • Innisfree

Scope of the Report

Items Values
Quantitative Units (2025) USD 1,651.4 Million
Source Yeast-fermented extracts, Lactobacillus-fermented peptides, Rice/soy fermentation, Fruit/plant ferments
Function Skin barrier strengthening, Anti-aging, Brightening, Soothing
Product Type Serums, Essences, Creams, Masks
Claim Probiotic-derived, Clean-label, Vegan, COSMOS/ECOCERT
Channel E-commerce, K-beauty specialty retail, Pharmacies, Mass retail
Regions Covered North America, Europe, East Asia, South Asia & Pacific, Latin America, Middle East & Africa
Countries Covered United States, Canada, United Kingdom, Germany, France, China, Japan, South Korea, India, Brazil, Australia and 40+ countries
Key Companies Profiled Amorepacific, Missha, Cosrx, Sulwhasoo, L'Oréal, Dr. Jart+, SK-II, The Face Shop, Neogen, and Innisfree

Bio-Fermented Actives Market by Segments

Source:

  • Yeast-fermented extracts
  • Lactobacillus-fermented peptides
  • Rice/soy fermentation
  • Fruit/plant ferments

Function:

  • Skin barrier strengthening
  • Anti-aging
  • Brightening
  • Soothing

Product Type:

  • Serums
  • Essences
  • Creams
  • Masks

Claim:

  • Probiotic-derived
  • Clean-label
  • Vegan
  • COSMOS/ECOCERT

Channel:

  • E-commerce
  • K-beauty specialty retail
  • Pharmacies
  • Mass retail

Region:

  • North America
    • United States
    • Canada
    • Mexico
  • Europe
    • Germany
    • United Kingdom
    • France
    • Italy
    • Spain
    • Nordic
    • BENELUX
    • Rest of Europe
  • East Asia
    • China
    • Japan
    • South Korea
  • South Asia & Pacific
    • India
    • ASEAN
    • Australia & New Zealand
    • Rest of South Asia & Pacific
  • Latin America
    • Brazil
    • Argentina
    • Chile
    • Rest of Latin America
  • Middle East & Africa
    • Kingdom of Saudi Arabia
    • Other GCC Countries
    • Turkiye
    • South Africa
    • Other African Union
    • Rest of Middle East & Africa

Table of Content

  1. Executive Summary
    • Global Market Outlook
    • Demand-side Trends
    • Supply-side Trends
    • Technology Roadmap Analysis
    • Analysis and Recommendations
  2. Market Overview
    • Market Coverage / Taxonomy
    • Market Definition / Scope / Limitations
  3. Market Background
    • Market Dynamics
      • Drivers
      • Restraints
      • Opportunity
      • Trends
    • Scenario Forecast
      • Demand in Optimistic Scenario
      • Demand in Likely Scenario
      • Demand in Conservative Scenario
    • Opportunity Map Analysis
    • Product Life Cycle Analysis
    • Supply Chain Analysis
    • Investment Feasibility Matrix
    • Value Chain Analysis
    • PESTLE and Porter’s Analysis
    • Regulatory Landscape
    • Regional Parent Market Outlook
    • Production and Consumption Statistics
    • Import and Export Statistics
  4. Global Market Analysis 2020-2024 and Forecast, 2025-2035
    • Historical Market Size Value (USD Million) Analysis, 2020-2024
    • Current and Future Market Size Value (USD Million) Projections, 2025-2035
      • Y-o-Y Growth Trend Analysis
      • Absolute $ Opportunity Analysis
  5. Global Market Pricing Analysis 2020-2024 and Forecast 2025-2035
  6. Global Market Analysis 2020-2024 and Forecast 2025-2035, By Function
    • Introduction / Key Findings
    • Historical Market Size Value (USD Million) Analysis By Function , 2020-2024
    • Current and Future Market Size Value (USD Million) Analysis and Forecast By Function , 2025-2035
      • Skin barrier strengthening
      • Anti-aging
      • Brightening
      • Soothing
    • Y-o-Y Growth Trend Analysis By Function , 2020-2024
    • Absolute $ Opportunity Analysis By Function , 2025-2035
  7. Global Market Analysis 2020-2024 and Forecast 2025-2035, By Claim
    • Introduction / Key Findings
    • Historical Market Size Value (USD Million) Analysis By Claim, 2020-2024
    • Current and Future Market Size Value (USD Million) Analysis and Forecast By Claim, 2025-2035
      • Probiotic-derived
      • Clean-label
      • Vegan
      • COSMOS/ECOCERT
    • Y-o-Y Growth Trend Analysis By Claim, 2020-2024
    • Absolute $ Opportunity Analysis By Claim, 2025-2035
  8. Global Market Analysis 2020-2024 and Forecast 2025-2035, By Channel
    • Introduction / Key Findings
    • Historical Market Size Value (USD Million) Analysis By Channel, 2020-2024
    • Current and Future Market Size Value (USD Million) Analysis and Forecast By Channel, 2025-2035
      • E-commerce
      • K-beauty specialty retail
      • Pharmacies
      • Mass retail
    • Y-o-Y Growth Trend Analysis By Channel, 2020-2024
    • Absolute $ Opportunity Analysis By Channel, 2025-2035
  9. Global Market Analysis 2020-2024 and Forecast 2025-2035, By Region
    • Introduction
    • Historical Market Size Value (USD Million) Analysis By Region, 2020-2024
    • Current Market Size Value (USD Million) Analysis and Forecast By Region, 2025-2035
      • North America
      • Latin America
      • Western Europe
      • Eastern Europe
      • East Asia
      • South Asia and Pacific
      • Middle East & Africa
    • Market Attractiveness Analysis By Region
  10. North America Market Analysis 2020-2024 and Forecast 2025-2035, By Country
    • Historical Market Size Value (USD Million) Trend Analysis By Market Taxonomy, 2020-2024
    • Market Size Value (USD Million) Forecast By Market Taxonomy, 2025-2035
      • By Country
        • USA
        • Canada
        • Mexico
      • By Function
      • By Claim
      • By Channel
    • Market Attractiveness Analysis
      • By Country
      • By Function
      • By Claim
      • By Channel
    • Key Takeaways
  11. Latin America Market Analysis 2020-2024 and Forecast 2025-2035, By Country
    • Historical Market Size Value (USD Million) Trend Analysis By Market Taxonomy, 2020-2024
    • Market Size Value (USD Million) Forecast By Market Taxonomy, 2025-2035
      • By Country
        • Brazil
        • Chile
        • Rest of Latin America
      • By Function
      • By Claim
      • By Channel
    • Market Attractiveness Analysis
      • By Country
      • By Function
      • By Claim
      • By Channel
    • Key Takeaways
  12. Western Europe Market Analysis 2020-2024 and Forecast 2025-2035, By Country
    • Historical Market Size Value (USD Million) Trend Analysis By Market Taxonomy, 2020-2024
    • Market Size Value (USD Million) Forecast By Market Taxonomy, 2025-2035
      • By Country
        • Germany
        • UK
        • Italy
        • Spain
        • France
        • Nordic
        • BENELUX
        • Rest of Western Europe
      • By Function
      • By Claim
      • By Channel
    • Market Attractiveness Analysis
      • By Country
      • By Function
      • By Claim
      • By Channel
    • Key Takeaways
  13. Eastern Europe Market Analysis 2020-2024 and Forecast 2025-2035, By Country
    • Historical Market Size Value (USD Million) Trend Analysis By Market Taxonomy, 2020-2024
    • Market Size Value (USD Million) Forecast By Market Taxonomy, 2025-2035
      • By Country
        • Russia
        • Poland
        • Hungary
        • Balkan & Baltic
        • Rest of Eastern Europe
      • By Function
      • By Claim
      • By Channel
    • Market Attractiveness Analysis
      • By Country
      • By Function
      • By Claim
      • By Channel
    • Key Takeaways
  14. East Asia Market Analysis 2020-2024 and Forecast 2025-2035, By Country
    • Historical Market Size Value (USD Million) Trend Analysis By Market Taxonomy, 2020-2024
    • Market Size Value (USD Million) Forecast By Market Taxonomy, 2025-2035
      • By Country
        • China
        • Japan
        • South Korea
      • By Function
      • By Claim
      • By Channel
    • Market Attractiveness Analysis
      • By Country
      • By Function
      • By Claim
      • By Channel
    • Key Takeaways
  15. South Asia and Pacific Market Analysis 2020-2024 and Forecast 2025-2035, By Country
    • Historical Market Size Value (USD Million) Trend Analysis By Market Taxonomy, 2020-2024
    • Market Size Value (USD Million) Forecast By Market Taxonomy, 2025-2035
      • By Country
        • India
        • ASEAN
        • Australia & New Zealand
        • Rest of South Asia and Pacific
      • By Function
      • By Claim
      • By Channel
    • Market Attractiveness Analysis
      • By Country
      • By Function
      • By Claim
      • By Channel
    • Key Takeaways
  16. Middle East & Africa Market Analysis 2020-2024 and Forecast 2025-2035, By Country
    • Historical Market Size Value (USD Million) Trend Analysis By Market Taxonomy, 2020-2024
    • Market Size Value (USD Million) Forecast By Market Taxonomy, 2025-2035
      • By Country
        • Kingdom of Saudi Arabia
        • Other GCC Countries
        • Turkiye
        • South Africa
        • Other African Union
        • Rest of Middle East & Africa
      • By Function
      • By Claim
      • By Channel
    • Market Attractiveness Analysis
      • By Country
      • By Function
      • By Claim
      • By Channel
    • Key Takeaways
  17. Key Countries Market Analysis
    • USA
      • Pricing Analysis
      • Market Share Analysis, 2024
        • By Function
        • By Claim
        • By Channel
    • Canada
      • Pricing Analysis
      • Market Share Analysis, 2024
        • By Function
        • By Claim
        • By Channel
    • Mexico
      • Pricing Analysis
      • Market Share Analysis, 2024
        • By Function
        • By Claim
        • By Channel
    • Brazil
      • Pricing Analysis
      • Market Share Analysis, 2024
        • By Function
        • By Claim
        • By Channel
    • Chile
      • Pricing Analysis
      • Market Share Analysis, 2024
        • By Function
        • By Claim
        • By Channel
    • Germany
      • Pricing Analysis
      • Market Share Analysis, 2024
        • By Function
        • By Claim
        • By Channel
    • UK
      • Pricing Analysis
      • Market Share Analysis, 2024
        • By Function
        • By Claim
        • By Channel
    • Italy
      • Pricing Analysis
      • Market Share Analysis, 2024
        • By Function
        • By Claim
        • By Channel
    • Spain
      • Pricing Analysis
      • Market Share Analysis, 2024
        • By Function
        • By Claim
        • By Channel
    • France
      • Pricing Analysis
      • Market Share Analysis, 2024
        • By Function
        • By Claim
        • By Channel
    • India
      • Pricing Analysis
      • Market Share Analysis, 2024
        • By Function
        • By Claim
        • By Channel
    • ASEAN
      • Pricing Analysis
      • Market Share Analysis, 2024
        • By Function
        • By Claim
        • By Channel
    • Australia & New Zealand
      • Pricing Analysis
      • Market Share Analysis, 2024
        • By Function
        • By Claim
        • By Channel
    • China
      • Pricing Analysis
      • Market Share Analysis, 2024
        • By Function
        • By Claim
        • By Channel
    • Japan
      • Pricing Analysis
      • Market Share Analysis, 2024
        • By Function
        • By Claim
        • By Channel
    • South Korea
      • Pricing Analysis
      • Market Share Analysis, 2024
        • By Function
        • By Claim
        • By Channel
    • Russia
      • Pricing Analysis
      • Market Share Analysis, 2024
        • By Function
        • By Claim
        • By Channel
    • Poland
      • Pricing Analysis
      • Market Share Analysis, 2024
        • By Function
        • By Claim
        • By Channel
    • Hungary
      • Pricing Analysis
      • Market Share Analysis, 2024
        • By Function
        • By Claim
        • By Channel
    • Kingdom of Saudi Arabia
      • Pricing Analysis
      • Market Share Analysis, 2024
        • By Function
        • By Claim
        • By Channel
    • Turkiye
      • Pricing Analysis
      • Market Share Analysis, 2024
        • By Function
        • By Claim
        • By Channel
    • South Africa
      • Pricing Analysis
      • Market Share Analysis, 2024
        • By Function
        • By Claim
        • By Channel
  18. Market Structure Analysis
    • Competition Dashboard
    • Competition Benchmarking
    • Market Share Analysis of Top Players
      • By Regional
      • By Function
      • By Claim
      • By Channel
  19. Competition Analysis
    • Competition Deep Dive
      • Amorepacific
        • Overview
        • Product Portfolio
        • Profitability by Market Segments (Product/Age /Sales Channel/Region)
        • Sales Footprint
        • Strategy Overview
          • Marketing Strategy
          • Product Strategy
          • Channel Strategy
      • Missha
      • Cosrx
      • Sulwhasoo
      • L’Oréal
      • Dr. Jart+
      • SK-II
      • The Face Shop
      • Neogen
      • Innisfree
  20. Assumptions & Acronyms Used
  21. Research Methodology

List of Tables

  • Table 1: Global Market Value (USD Million) Forecast by Region, 2020-2035
  • Table 2: Global Market Value (USD Million) Forecast by Function , 2020-2035
  • Table 3: Global Market Value (USD Million) Forecast by Claim, 2020-2035
  • Table 4: Global Market Value (USD Million) Forecast by Channel, 2020-2035
  • Table 5: North America Market Value (USD Million) Forecast by Country, 2020-2035
  • Table 6: North America Market Value (USD Million) Forecast by Function , 2020-2035
  • Table 7: North America Market Value (USD Million) Forecast by Claim, 2020-2035
  • Table 8: North America Market Value (USD Million) Forecast by Channel, 2020-2035
  • Table 9: Latin America Market Value (USD Million) Forecast by Country, 2020-2035
  • Table 10: Latin America Market Value (USD Million) Forecast by Function , 2020-2035
  • Table 11: Latin America Market Value (USD Million) Forecast by Claim, 2020-2035
  • Table 12: Latin America Market Value (USD Million) Forecast by Channel, 2020-2035
  • Table 13: Western Europe Market Value (USD Million) Forecast by Country, 2020-2035
  • Table 14: Western Europe Market Value (USD Million) Forecast by Function , 2020-2035
  • Table 15: Western Europe Market Value (USD Million) Forecast by Claim, 2020-2035
  • Table 16: Western Europe Market Value (USD Million) Forecast by Channel, 2020-2035
  • Table 17: Eastern Europe Market Value (USD Million) Forecast by Country, 2020-2035
  • Table 18: Eastern Europe Market Value (USD Million) Forecast by Function , 2020-2035
  • Table 19: Eastern Europe Market Value (USD Million) Forecast by Claim, 2020-2035
  • Table 20: Eastern Europe Market Value (USD Million) Forecast by Channel, 2020-2035
  • Table 21: East Asia Market Value (USD Million) Forecast by Country, 2020-2035
  • Table 22: East Asia Market Value (USD Million) Forecast by Function , 2020-2035
  • Table 23: East Asia Market Value (USD Million) Forecast by Claim, 2020-2035
  • Table 24: East Asia Market Value (USD Million) Forecast by Channel, 2020-2035
  • Table 25: South Asia and Pacific Market Value (USD Million) Forecast by Country, 2020-2035
  • Table 26: South Asia and Pacific Market Value (USD Million) Forecast by Function , 2020-2035
  • Table 27: South Asia and Pacific Market Value (USD Million) Forecast by Claim, 2020-2035
  • Table 28: South Asia and Pacific Market Value (USD Million) Forecast by Channel, 2020-2035
  • Table 29: Middle East & Africa Market Value (USD Million) Forecast by Country, 2020-2035
  • Table 30: Middle East & Africa Market Value (USD Million) Forecast by Function , 2020-2035
  • Table 31: Middle East & Africa Market Value (USD Million) Forecast by Claim, 2020-2035
  • Table 32: Middle East & Africa Market Value (USD Million) Forecast by Channel, 2020-2035

List of Figures

  • Figure 1: Global Market Pricing Analysis
  • Figure 2: Global Market Value (USD Million) Forecast 2020-2035
  • Figure 3: Global Market Value (USD Million) Share and BPS Analysis by Region, 2025 and 2035
  • Figure 4: Global Market Y-o-Y Growth Comparison by Region, 2025-2035
  • Figure 5: Global Market Attractiveness Analysis by Region
  • Figure 6: North America Market Incremental Dollar Opportunity, 2025-2035
  • Figure 7: Latin America Market Incremental Dollar Opportunity, 2025-2035
  • Figure 8: Western Europe Market Incremental Dollar Opportunity, 2025-2035
  • Figure 9: Eastern Europe Market Incremental Dollar Opportunity, 2025-2035
  • Figure 10: East Asia Market Incremental Dollar Opportunity, 2025-2035
  • Figure 11: South Asia and Pacific Market Incremental Dollar Opportunity, 2025-2035
  • Figure 12: Middle East & Africa Market Incremental Dollar Opportunity, 2025-2035
  • Figure 13: North America Market Value Share and BPS Analysis by Country, 2025 and 2035
  • Figure 14: Latin America Market Value Share and BPS Analysis by Country, 2025 and 2035
  • Figure 15: Western Europe Market Value Share and BPS Analysis by Country, 2025 and 2035
  • Figure 16: Eastern Europe Market Value Share and BPS Analysis by Country, 2025 and 2035
  • Figure 17: East Asia Market Value Share and BPS Analysis by Country, 2025 and 2035
  • Figure 18: South Asia and Pacific Market Value Share and BPS Analysis by Country, 2025 and 2035
  • Figure 19: Middle East & Africa Market Value Share and BPS Analysis by Country, 2025 and 2035
  • Figure 20: Global Market - Tier Structure Analysis
  • Figure 21: Global Market - Company Share Analysis

Frequently Asked Questions

How big is the bio-fermented actives market in 2025?

The global bio-fermented actives market is estimated to be valued at USD 1,652.9 million in 2025.

What will be the size of bio-fermented actives market in 2035?

The market size for the bio-fermented actives market is projected to reach USD 5,761.6 million by 2035.

How much will be the bio-fermented actives market growth between 2025 and 2035?

The bio-fermented actives market is expected to grow at a 13.3% CAGR between 2025 and 2035.

What are the key product types in the bio-fermented actives market?

The key product types in bio-fermented actives market are skin barrier strengthening, anti-aging, brightening and soothing.

Which claim segment to contribute significant share in the bio-fermented actives market in 2025?

In terms of claim, probiotic-derived segment to command 50.5% share in the bio-fermented actives market in 2025.

Explore Similar Insights

Future Market Insights

Bio-Fermented Actives Market

Chat With

MaRIA

Hi There, I am MaRIA, Your Market Research Intelligence Assistant. How may I help you?