Biorhythmic Skincare Actives Market Size and Share Forecast Outlook 2025 to 2035

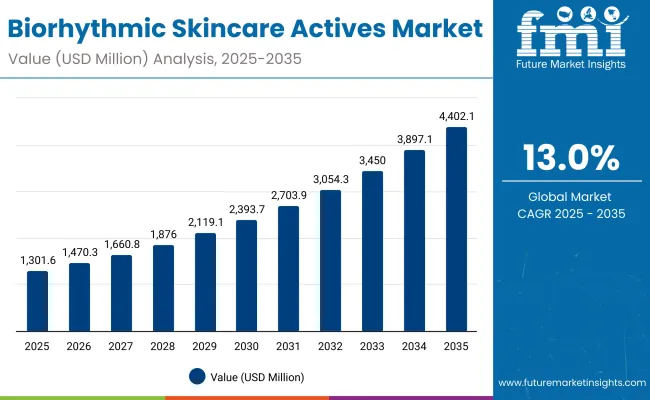
A market valuation of USD 1,301.60 Million has been estimated for 2025 in biorhythmic skincare actives, with expansion projected to reach USD 4,402.10 Million by 2035. The rise of USD 3,100.50 Million over the decade reflects a 238% increase in size, equal to a CAGR of 13.00%. This trajectory is set to be underpinned by circadian rhythm alignment technologies, clinically validated claims, and consumer prioritization of recovery-led formulations that align with natural biorhythms.
Quick Stats for Biorhythmic Skincare Actives Market

  • Market Value (2025): USD 1,301.60 Million
  • Market Forecast Value (2035): USD 4,402.10 Million
  • Market Forecast CAGR (2025 to 2035): 13.00%
  • Leading Segment in 2025: Night repair & regeneration (55.60%)
  • Key Growth Regions: China, India, Japan, United States, Germany
  • Top Key Players: Estée Lauder, Shiseido, L’Oréal, Lancôme, Clarins, SK-II, Kiehl’s, Amorepacific, Murad, Clinique

Biorhythmic Skincare Actives Market

Biorhythmic Skincare Actives Market Key Takeaways

Metric Value
Biorhythmic Skincare Actives Market Estimated Value in (2025E) USD 1,301.60 Million
Biorhythmic Skincare Actives Market Forecast Value in (2035F) USD 4,402.10 Million
Forecast CAGR (2025 to 2035) 13.00%

Between 2025 and 2030, the market is projected to expand from USD 1,301.60 Mn to USD 2,393.70 Mn, adding USD 1,092.10 Mn in just five years. This contribution accounts for more than one-third of the overall decade growth. Uptake is expected to be driven by increasing awareness of skin’s circadian cycles, demand for clinical-grade protocols, and the emergence of advanced chrono-peptide actives. Night repair & regeneration is anticipated to remain the dominant function throughout this period, representing 55.60% of the global value in 2025, equal to USD 722.20 Mn.

The second half of the decade from 2030 to 2035 is forecast to deliver accelerated momentum as the market rises from USD 2,393.70 Mn to USD 4,402.10 Mn, contributing USD 2,008.40 Mn—about 65% of total growth. This phase is expected to be powered by advanced time-stamped efficacy trials, integration of AI-driven regimen timing, and expanded participation of emerging markets such as China and India. Clinical-grade claims are projected to retain leadership with a 52.10% share in 2025, reflecting consumer reliance on dermatologist-tested validation and professional trust signals.

From 2020 to 2024, the foundation of circadian skincare was established through targeted R&D and early consumer adoption, which set the stage for exponential growth from 2025 onward. By 2025, demand for evidence-based formulations is expected to reach USD 1,301.60 Mn, with clinically validated actives gaining early trust.

Over the decade, value is projected to rise to USD 4,402.10 Mn, as expansion in Asia-Pacific, especially China and India, accelerates adoption and drives category depth. The competitive landscape is anticipated to shift toward clinical-grade claims, plant circadian extracts, and melatonin-pathway boosters, with premium players defending share through transparent assay protocols and dermatologist partnerships.

Competitive advantage is expected to evolve away from traditional branding strength toward science-backed innovation, timing-specific actives, and ecosystem integration across retail, clinics, and digital platforms. Recurring value streams are likely to emerge from subscription-based regimens and AI-driven adherence solutions, establishing new growth layers.

Why the Biorhythmic Skincare Actives Market is growing?

Growth in the Biorhythmic Skincare Actives Market is being driven by rising consumer preference for formulations synchronized with circadian rhythms and backed by clinical validation. Night repair and regeneration actives are expected to dominate as measurable overnight results are prioritized. Scientific advances in chrono-peptides, melatonin boosters, and plant circadian extracts are being translated into differentiated claims that resonate strongly with evidence-seeking consumers. Expansion in Asia-Pacific, particularly China and India, is projected to accelerate adoption as younger demographics embrace clinical-grade and dermatologist-tested products. Premium positioning is being reinforced by transparent efficacy trials and AI-guided regimen personalization, which are anticipated to boost consumer trust and long-term engagement. Growth momentum is also supported by increasing availability of premium channels, including e-commerce platforms and dermatology clinics, which ensure broad access. Over the decade, innovation pipelines, clinical claim substantiation, and alignment with wellness-focused lifestyles are expected to remain central growth catalysts across global markets.

Segmental Analysis

The Biorhythmic Skincare Actives Market has been segmented on the basis of Function, Claim, and Product Type, highlighting the core areas that shape adoption and consumer preference. These segments reflect how circadian alignment, clinical validation, and delivery formats are being positioned to address evolving skincare needs. Function-based segmentation emphasizes the importance of nighttime recovery and regeneration as a dominant consumer priority. Claim-based segmentation underscores the value of clinical validation and dermatologist endorsement in building consumer trust. Product type segmentation showcases how concentrated formats such as serums are leading the way due to precision dosing and compatibility with time-specific regimens. Together, these segments define the current structure of demand and highlight where growth momentum is expected to accelerate over the next decade.
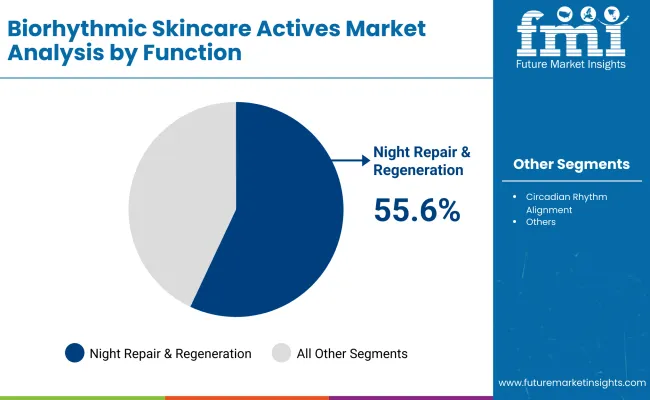
Insights into the Function Segment with Night Repair & Regeneration Leading in Market Share

Biorhythmic Skincare Actives Market By Function

Segment Market Value Share, 2025
Night repair & regeneration 55.6%
Others 44.4%

Night repair & regeneration is projected to dominate the function segment with a 55.60% share in 2025, equal to USD 722.20 Million. Growth is expected to be reinforced by consumer demand for measurable overnight recovery, barrier repair, and radiance improvements. The preference for nighttime routines is being supported by the biological synchronization of circadian repair processes, which ensures more effective outcomes when active ingredients are aligned with skin cycles. As consumers increasingly seek science-backed evidence, this function is anticipated to attract stronger adoption in both developed and emerging markets. Over the decade, innovation pipelines in melatonin boosters and peptide complexes are expected to strengthen this segment’s leadership within the global market.
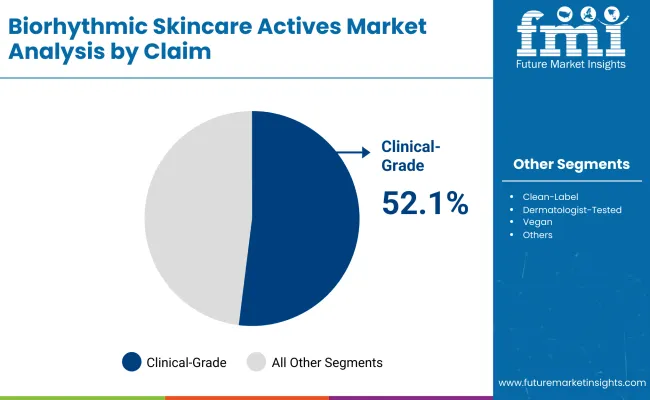
Insights into the Claim Segment with Clinical-Grade Formulations Dominating in Market Share

Biorhythmic Skincare Actives Market By Claim

Segment Market Value Share, 2025
Clinical-grade 52.1%
Others 47.9%

Clinical-grade formulations are anticipated to lead the claim segment in 2025 with a 52.10% share, valued at USD 682.80 Million. Demand is being driven by consumer reliance on dermatologist-tested validation, clinical trial evidence, and transparent efficacy reporting. This positioning is reinforced by the growing requirement from regulatory authorities and retail gatekeepers for scientific substantiation, which has increased trust in clinically proven skincare. The segment’s growth is projected to be supported by professional tie-ins, clinical endorsements, and strong uptake in both e-commerce and dermatology clinics. As new assay technologies emerge and circadian efficacy trials are standardized, the clinical-grade claim is expected to consolidate its role as the most trusted and premium positioning in the market.
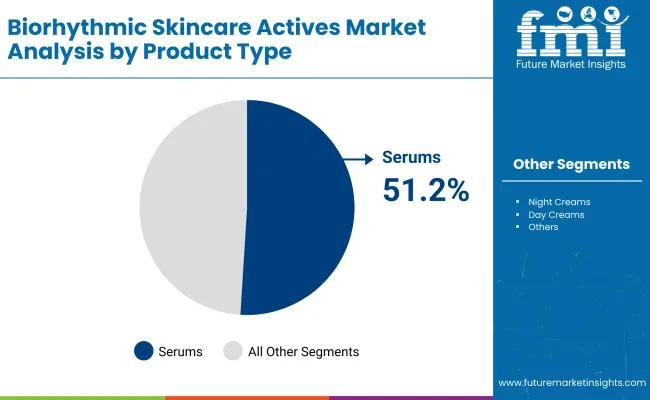
Insights into the Product Type Segment with Serums Dominating in Market Share

Biorhythmic Skincare Actives Market By Product Type

Segment Market Value Share, 2025
Serums 51.2%
Others 48.8%

Serums are projected to lead the product type segment with a 51.20% share in 2025, valued at USD 669.70 Million. Their dominance is expected to be supported by precision dosing, lightweight textures, and superior absorption that align well with circadian skincare protocols. Consumer preference for concentrated formulations is being reinforced by the ability of serums to deliver higher efficacy in smaller amounts, improving compliance and measurable outcomes. Innovation in chrono-peptide delivery systems and plant extract infusions is likely to elevate the appeal of this format over the decade. With refillable packaging trends and AI-personalized regimens advancing, serums are forecast to retain leadership by providing flexibility, targeted benefits, and premium user experience in the global market.

What are the Drivers, Restraints, and Key Trends of the Biorhythmic Skincare Actives Market?

Increasing complexity of circadian efficacy validation and the premiumization of clinical-grade skincare are shaping adoption, while demand is also being influenced by digital adherence tools and wellness-driven personalization, creating new opportunities alongside challenges for global market participants.

Integration of AI in Circadian Personalization

Market expansion is being supported by the integration of artificial intelligence in regimen synchronization, where algorithmic platforms recommend ingredient timing and product layering based on skin rhythm mapping. This shift is enabling consumers to link visible results with digital adherence insights. The resulting trust is being strengthened by transparent evidence reporting and clinical dashboards that reinforce brand credibility. In the next decade, ecosystem partnerships with wearables and sleep trackers are expected to amplify adoption by connecting skincare usage directly to biological feedback. Such data-backed personalization is projected to sustain premium pricing and secure long-term consumer loyalty, positioning AI-driven circadian synchronization as a transformative growth lever.

Limited Standardization of Chronobiology Testing Protocols

Growth is expected to face constraints due to the absence of standardized chronobiology testing frameworks, which creates inconsistency in substantiation claims. Divergent assay methodologies are undermining comparability across product lines, slowing regulatory approvals and diluting consumer confidence. Without harmonized evaluation metrics, replication of circadian alignment outcomes remains challenging, making it harder for brands to defend premium positioning. Over the forecast period, the establishment of recognized global testing standards will be critical to resolve these gaps. Until then, market scaling may be slowed by uncertainty in claim validation and by reluctance from institutional buyers, such as dermatology clinics and premium retail platforms, to expand offerings without consistent scientific proof.
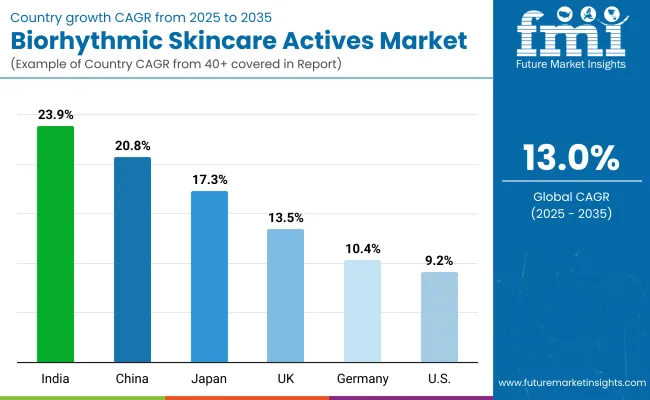
Analysis of Biorhythmic Skincare Actives Market By Key Countries

Country Wise Biorhythmic Skincare Actives Market

Country CAGR
China 20.8%
USA 9.2%
India 23.9%
UK 13.5%
Germany 10.4%
Japan 17.3%

Adoption of biorhythmic skincare actives is showing distinct differences across countries, shaped by consumer awareness, scientific validation, and evolving wellness preferences. Asia is positioned as the fastest-growing hub, with India projected to expand at 23.90% CAGR and China at 20.80% CAGR from 2025 to 2035. India’s momentum is expected to be reinforced by rising middle-class spending, digital-first beauty engagement, and the strong appeal of clinical-grade products in urban centers. China’s trajectory is anticipated to be powered by rapid uptake of circadian-aligned innovations and alignment with premium beauty channels that emphasize scientific credibility.

Japan is forecast to achieve a 17.30% CAGR, driven by mature consumers favoring low-irritancy, evidence-backed night repair formulations that complement local skincare traditions. In Europe, the UK and Germany are expected to expand at 13.50% and 10.40% CAGR respectively, supported by strong clinical positioning, dermatologist partnerships, and regulatory alignment for substantiated claims. These markets are projected to remain innovation leaders in active development pipelines.

The U.S., by contrast, is projected to post a steadier 9.20% CAGR, reflecting a mature premium beauty landscape. Growth is anticipated to rely on dermatologist-endorsed clinical-grade launches, subscription-based regimens, and data-driven personalization strategies that reinforce consumer trust in circadian skincare.
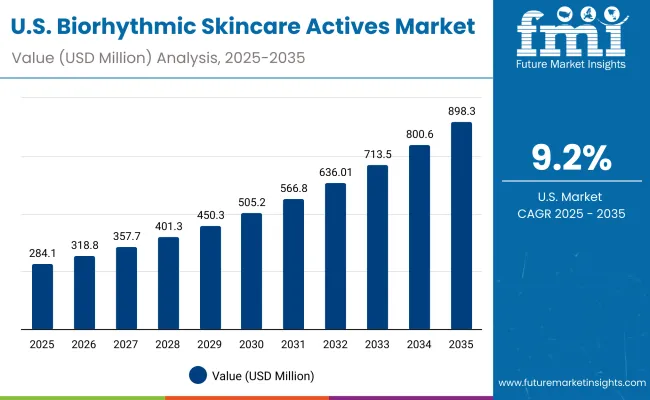
Sales Outlook for Biorhythmic Skincare Actives in the United States

Usa Biorhythmic Skincare Actives Market

Year USA Biorhythmic Skincare Actives Market (USD Million)
2025 284.16
2026 318.82
2027 357.71
2028 401.35
2029 450.31
2030 505.23
2031 566.86
2032 636.01
2033 713.59
2034 800.63
2035 898.30

The Biorhythmic Skincare Actives Market in the United States is projected to advance at a CAGR of 9.20% from 2025 to 2035, rising from USD 284.16 Million in 2025 to USD 898.30 Million by the end of the forecast period. Growth is anticipated to be sustained by consumer adoption of clinical-grade products and strong demand for dermatologist-tested formulations. Clinical validation is expected to remain central in driving premium positioning, while subscription-based regimens and AI-guided personalization tools are likely to enhance consumer loyalty. Distribution through dermatology clinics and premium retail channels is projected to expand further, reinforcing accessibility for evidence-seeking consumers.

  • Clinical-grade validation is expected to strengthen brand trust and sustain premium pricing.
  • Subscription-based regimens are anticipated to anchor recurring revenues across the U.S. market.
  • Dermatology clinics and premium retail outlets are projected to remain leading channels for adoption.

Growth and Expansion Outlook for Biorhythmic Skincare Actives Market in the United Kingdom

The Biorhythmic Skincare Actives Market in the UK is forecast to grow at a CAGR of 13.50% from 2025 to 2035. This growth trajectory is expected to be supported by the rising adoption of clinically validated formulations and heightened consumer interest in dermatologist-endorsed products. Premium beauty retail channels are projected to expand their share as consumers increasingly seek evidence-based skincare solutions. Regulatory alignment around claim substantiation is likely to reinforce the competitive edge of clinical-grade actives. Over the decade, innovation in chrono-peptides and plant-based circadian extracts is expected to resonate strongly with consumers who demand science-led wellness offerings.

  • Clinical validation is projected to remain a decisive factor for adoption.
  • Premium retail expansion is expected to accelerate market penetration.
  • Regulatory scrutiny is anticipated to favor scientifically backed brands.
  • Chrono-peptide innovation is likely to capture long-term consumer loyalty.

Growth and Expansion Outlook for Biorhythmic Skincare Actives Market in India

The Biorhythmic Skincare Actives Market in India is projected to grow at a CAGR of 23.90% during 2025-2035, making it the fastest-growing key market globally. This rapid expansion is anticipated to be driven by rising middle-class spending, digital-first beauty engagement, and the popularity of dermatologist-tested formulations among younger consumers. E-commerce platforms are expected to act as major enablers of category penetration, with localized education campaigns driving awareness. Urban centers are likely to anchor premium adoption, while tier-two cities emerge as new growth nodes for circadian skincare. Innovation in affordable clinical-grade actives is projected to widen accessibility and sustain momentum.

  • E-commerce is expected to accelerate consumer reach and education.
  • Younger demographics are projected to drive strong uptake of clinical-grade claims.
  • Tier-two cities are anticipated to emerge as growth contributors.
  • Affordable innovation is likely to broaden accessibility across consumer segments.

Sales Outlook for Biorhythmic Skincare Actives in China

The Biorhythmic Skincare Actives Market in China is forecast to grow at a CAGR of 20.80% from 2025 to 2035. Expansion is anticipated to be powered by consumer receptivity to circadian science, strong demand for clinical-grade claims, and integration with premium beauty retail ecosystems. Digital platforms are expected to amplify adoption through AI-driven regimen personalization and adherence support tools. Regulatory frameworks emphasizing transparency and efficacy are projected to favor market leaders that invest in clinical trials and disclose assay methodologies. China is also likely to witness strong brand competition, with global and domestic players leveraging localized consumer insights.
  • Clinical-grade claims are anticipated to anchor long-term market trust.
  • AI-driven personalization is projected to accelerate premium adoption.
  • Regulatory emphasis on efficacy is expected to reinforce leading brands.
  • Domestic and global competition is likely to intensify across channels.

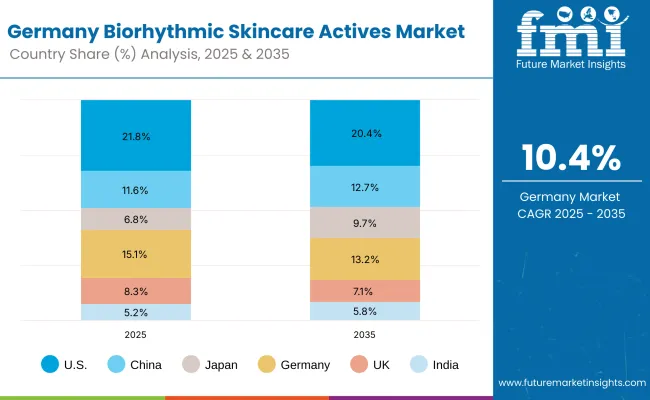
In-depth Analysis of Biorhythmic Skincare Actives in Germany

Europe Biorhythmic Skincare Actives Market

Country 2025
USA 21.8%
China 11.6%
Japan 6.8%
Germany 15.1%
UK 8.3%
India 5.2%
Country 2035
USA 20.4%
China 12.7%
Japan 9.7%
Germany 13.2%
UK 7.1%
India 5.8%

The Biorhythmic Skincare Actives Market in Germany is expected to grow at a CAGR of 10.40% during 2025-2035. Growth is projected to be supported by consumer reliance on dermatologist-tested products, regulatory scrutiny over claims, and demand for sustainable, science-led skincare. Strong presence of premium retail chains and clinic-based distribution is anticipated to reinforce accessibility for evidence-seeking consumers. Innovation pipelines focused on enzyme regulators and plant circadian extracts are likely to align with Germany’s preference for natural yet clinically validated actives. Partnerships between dermatology clinics and premium brands are expected to strengthen credibility and foster repeat adoption.
  • Regulatory rigor is expected to sustain clinical credibility.
  • Premium retail and clinical channels are projected to anchor growth.
  • Natural circadian extracts are anticipated to resonate with German consumers.
  • Dermatology partnerships are likely to reinforce market trust and engagement.

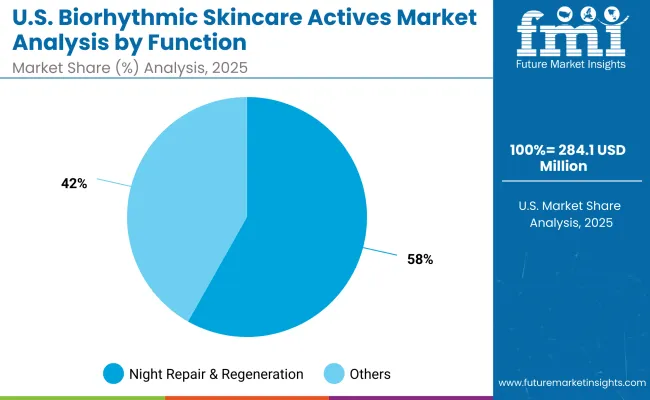
Growth Outlook for Biorhythmic Skincare Actives Market in USA

Usa Biorhythmic Skincare Actives Market 1

Segment Market Value Share, 2025
Night repair & regeneration 58.2%
Others 41.8%

The Biorhythmic Skincare Actives Market in the United States is projected at USD 284.16 Million in 2025. Night repair & regeneration contributes 58.20% with USD 165.30 Million, while other functions account for 41.80% with USD 118.91 Million. This dominance of night repair reflects consumer alignment with biological recovery cycles, where evening skincare routines are increasingly prioritized for visible outcomes. The preference for clinically validated repair actives is expected to accelerate as dermatologist-endorsed formulations become central to premium positioning. Unlike general-purpose actives, circadian repair products are being supported by transparent trials and AI-driven personalization that enhance regimen adherence. Over the decade, heightened emphasis on barrier strength, hydration, and overnight recovery biomarkers is projected to secure the leadership of this segment. By contrast, other functional categories are expected to remain supplementary, addressing broad wellness preferences without eclipsing the appeal of repair-focused innovation.
  • U.S. market value projected at USD 284.16 Million in 2025
  • Night repair & regeneration leads with 58.20% share
  • Growth supported by clinical validation and dermatologist partnerships
  • AI-driven personalization projected to reinforce adherence and outcomes

Opportunity Analysis of China Biorhythmic Skincare Actives Market

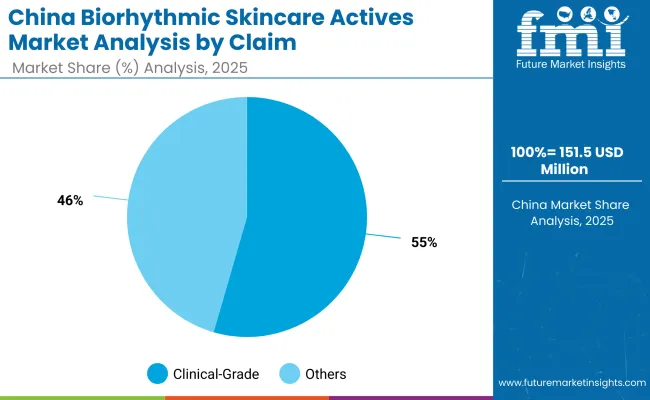
China Biorhythmic Skincare Actives Market

Segment Market Value Share, 2025
Clinical-grade 54.5%
Others 45.5%

The Biorhythmic Skincare Actives Market in China is projected at USD 151.58 Million in 2025. Clinical-grade claims contribute 54.50% with USD 82.60 Million, while other claims account for 45.50% with USD 68.95 Million. This leadership of clinical-grade products reflects the growing trust in dermatologist-tested validation and transparent efficacy reporting, which are increasingly demanded by Chinese consumers. The rapid uptake is being supported by digital-first beauty platforms that emphasize clinical substantiation and regimen education. Over the decade, integration of AI-driven regimen personalization and evidence-based communication is expected to further strengthen the clinical-grade segment. Meanwhile, non-clinical categories are anticipated to serve wellness-oriented consumers, but without displacing the dominance of scientifically anchored positioning. Regulatory focus on substantiated claims is projected to favor brands that invest in transparent trial disclosures and validated circadian efficacy protocols.
  • China market projected at USD 151.58 Million in 2025
  • Clinical-grade leads with 54.50% share, equal to USD 82.60 Million
  • Expansion supported by digital-first adoption and scientific substantiation
  • Regulatory emphasis on validated claims expected to sustain leadership

Competitive Landscape of Biorhythmic Skincare Actives Market

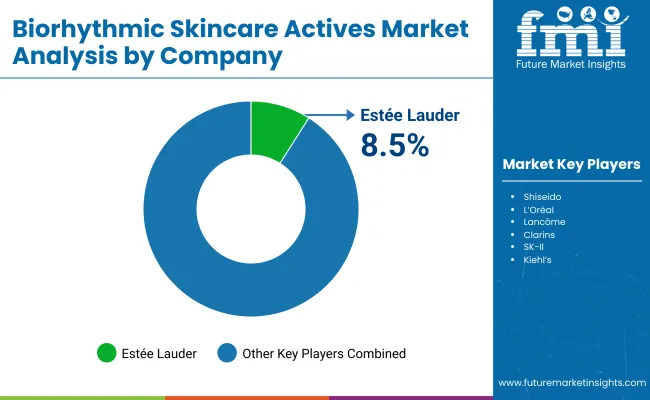
Biorhythmic Skincare Actives Market By Company

Company Global Value Share 2025
Estée Lauder 8.5%
Others 91.5%

The Biorhythmic Skincare Actives Market is moderately fragmented, with multinational leaders, regional premium players, and niche specialists competing across diverse skincare categories. Global beauty leaders such as Estée Lauder, L’Oréal, Shiseido, Lancôme, Clarins, SK-II, Kiehl’s, Amorepacific, Murad, and Clinique are projected to dominate market influence. Among these, Estée Lauder is estimated to hold the largest global value share in 2025 at 8.50%, while the remainder of the market is distributed among other players at 91.50%. Competitive intensity is expected to focus on clinical validation, circadian efficacy substantiation, and dermatologist partnerships, which are central to building long-term consumer trust.Regional innovators such as Amorepacific and SK-II are anticipated to strengthen their positions in Asia-Pacific through culturally aligned night repair formulations. Premium clinical-grade brands are expected to expand their footprint in the U.S. and Europe by leveraging dermatologist endorsements and transparent trial disclosures. Differentiation is projected to shift from traditional branding power toward data-backed personalization, AI-driven regimen optimization, and refillable sustainable formats. Over the forecast period, strategic partnerships with clinics, digital-first platforms, and wellness ecosystems are likely to become defining features of competitive positioning.

Key Developments in Biorhythmic Skincare Actives Market

  • In April 2025, No7 launched its Future Renew Night Serum, a clinically proven formulation designed to synchronise with the skin’s natural repair cycle at night. It combined a novel peptide blend with Lindera strychnifolia to enhance recovery during peak repair windows.
  • In May 2025, Codex Labs received MyMicrobiome Certification and the National Eczema Association Seal of Acceptance for its Bia Ultra-Hydrating Soothing Lotion. This recognition reinforced the market’s shift toward microbiome-friendly and barrier-support active ingredients in skincare.

Scope of the Report

Item Value
Quantitative Units USD 1,301.60 Million (2025) → USD 4,402.10 Million (2035)
Function Night repair & regeneration, Circadian rhythm alignment, Anti-aging & firming, Others
Active Type Chronopeptides, Plant circadian extracts, Melatonin boosters, Enzyme regulators
Claim Clinical-grade, Clean-label, Dermatologist-tested, Vegan, Others
Product Type Serums, Night creams, Day creams, Masks, Others
Channel E-commerce, Premium beauty retail, Pharmacies, Spas/Dermatology clinics
Regions Covered North America, Europe, Asia-Pacific, Latin America, Middle East & Africa
Countries Covered United States, Germany, United Kingdom, China, Japan, India
Key Companies Profiled Estée Lauder, Shiseido, L’Oréal, Lancôme, Clarins, SK-II, Kiehl’s, Amorepacific, Murad, Clinique
Additional Attributes Dollar sales by function, claim, and product type; accelerated adoption in Asia-Pacific (China CAGR 20.80%, India CAGR 23.90%); night repair & regeneration dominating at 55.60% in 2025; clinical-grade claims at 52.10%; strong reliance on dermatologist partnerships; innovations in chrono-peptides, melatonin boosters, and plant-based circadian extracts; rising digital-first adoption via e-commerce and AI-guided regimen personalization.

Key Segments

By Active Type:

  • Chronopeptides
  • Plant circadian extracts
  • Melatonin boosters
  • Enzyme regulators

By Product Type:

  • Serums
  • Night creams
  • Day creams
  • Masks

By Channel:

  • E-commerce
  • Premium beauty retail
  • Pharmacies
  • Spas/dermatology clinics

By Claim:

  • Clinical-grade
  • Clean-label
  • Dermatologist-tested
  • Vegan

By Region:

  • North America
  • Latin America
  • Europe
  • East Asia
  • South Asia & Pacific
  • Middle East and Africa

Table of Content

  1. Executive Summary
    • Global Market Outlook
    • Demand-side Trends
    • Supply-side Trends
    • Technology Roadmap Analysis
    • Analysis and Recommendations
  2. Market Overview
    • Market Coverage / Taxonomy
    • Market Definition / Scope / Limitations
  3. Market Background
    • Market Dynamics
      • Drivers
      • Restraints
      • Opportunity
      • Trends
    • Scenario Forecast
      • Demand in Optimistic Scenario
      • Demand in Likely Scenario
      • Demand in Conservative Scenario
    • Opportunity Map Analysis
    • Product Life Cycle Analysis
    • Supply Chain Analysis
    • Investment Feasibility Matrix
    • Value Chain Analysis
    • PESTLE and Porter’s Analysis
    • Regulatory Landscape
    • Regional Parent Market Outlook
    • Production and Consumption Statistics
    • Import and Export Statistics
  4. Global Analysis 2020 to 2024 and Forecast, 2025 to 2035
    • Historical Market Size Value (USD Million) Analysis, 2020 to 2024
    • Current and Future Market Size Value (USD Million) Projections, 2025 to 2035
      • Y-o-Y Growth Trend Analysis
      • Absolute $ Opportunity Analysis
  5. Global Pricing Analysis 2020 to 2024 and Forecast 2025 to 2035
  6. Global Analysis 2020 to 2024 and Forecast 2025 to 2035, By Function
    • Introduction / Key Findings
    • Historical Market Size Value (USD Million) Analysis By Function, 2020 to 2024
    • Current and Future Market Size Value (USD Million) Analysis and Forecast By Function, 2025 to 2035
      • Daytime protection & radiance
      • Night repair & regeneration
      • Circadian rhythm alignment
      • Anti-aging & firming
    • Y-o-Y Growth Trend Analysis By Function, 2020 to 2024
    • Absolute $ Opportunity Analysis By Function, 2025 to 2035
  7. Global Analysis 2020 to 2024 and Forecast 2025 to 2035, By Active Type
    • Introduction / Key Findings
    • Historical Market Size Value (USD Million) Analysis By Active Type, 2020 to 2024
    • Current and Future Market Size Value (USD Million) Analysis and Forecast By Active Type, 2025 to 2035
      • Chronopeptides
      • Plant circadian extracts
      • Melatonin boosters
      • Enzyme regulators
    • Y-o-Y Growth Trend Analysis By Active Type, 2020 to 2024
    • Absolute $ Opportunity Analysis By Active Type, 2025 to 2035
  8. Global Analysis 2020 to 2024 and Forecast 2025 to 2035, By Product Type
    • Introduction / Key Findings
    • Historical Market Size Value (USD Million) Analysis By Product Type, 2020 to 2024
    • Current and Future Market Size Value (USD Million) Analysis and Forecast By Product Type, 2025 to 2035
      • Serums
      • Night creams
      • Day creams
      • Masks
    • Y-o-Y Growth Trend Analysis By Product Type, 2020 to 2024
    • Absolute $ Opportunity Analysis By Product Type, 2025 to 2035
  9. Global Analysis 2020 to 2024 and Forecast 2025 to 2035, By Channel
    • Introduction / Key Findings
    • Historical Market Size Value (USD Million) Analysis By Channel, 2020 to 2024
    • Current and Future Market Size Value (USD Million) Analysis and Forecast By Channel, 2025 to 2035
      • E-commerce
      • Premium beauty retail
      • Pharmacies
      • Spas/dermatology clinics
    • Y-o-Y Growth Trend Analysis By Channel, 2020 to 2024
    • Absolute $ Opportunity Analysis By Channel, 2025 to 2035
  10. Global Analysis 2020 to 2024 and Forecast 2025 to 2035, By Claim
    • Introduction / Key Findings
    • Historical Market Size Value (USD Million) Analysis By Claim, 2020 to 2024
    • Current and Future Market Size Value (USD Million) Analysis and Forecast By Claim, 2025 to 2035
      • Clinical-grade
      • Clean-label
      • Dermatologist-tested
      • Vegan
    • Y-o-Y Growth Trend Analysis By Claim, 2020 to 2024
    • Absolute $ Opportunity Analysis By Claim, 2025 to 2035
  11. Global Analysis 2020 to 2024 and Forecast 2025 to 2035, By Region
    • Introduction
    • Historical Market Size Value (USD Million) Analysis By Region, 2020 to 2024
    • Current Market Size Value (USD Million) Analysis and Forecast By Region, 2025 to 2035
      • North America
      • Latin America
      • Europe
      • East Asia
      • South Asia & Pacific
      • Middle East and Africa
    • Market Attractiveness Analysis By Region
  12. North America Analysis 2020 to 2024 and Forecast 2025 to 2035, By Country
    • Historical Market Size Value (USD Million) Trend Analysis By Market Taxonomy, 2020 to 2024
    • Market Size Value (USD Million) Forecast By Market Taxonomy, 2025 to 2035
      • By Country
        • U.S.
        • Canada
      • By Function
      • By Active Type
      • By Product Type
      • By Channel
      • By Claim
    • Market Attractiveness Analysis
      • By Country
      • By Function
      • By Active Type
      • By Product Type
      • By Channel
      • By Claim
    • Key Takeaways
  13. Latin America Analysis 2020 to 2024 and Forecast 2025 to 2035, By Country
    • Historical Market Size Value (USD Million) Trend Analysis By Market Taxonomy, 2020 to 2024
    • Market Size Value (USD Million) Forecast By Market Taxonomy, 2025 to 2035
      • By Country
        • Brazil
        • Mexico
        • Colombia
        • Rest of Latin America
      • By Function
      • By Active Type
      • By Product Type
      • By Channel
      • By Claim
    • Market Attractiveness Analysis
      • By Country
      • By Function
      • By Active Type
      • By Product Type
      • By Channel
      • By Claim
    • Key Takeaways
  14. Europe Analysis 2020 to 2024 and Forecast 2025 to 2035, By Country
    • Historical Market Size Value (USD Million) Trend Analysis By Market Taxonomy, 2020 to 2024
    • Market Size Value (USD Million) Forecast By Market Taxonomy, 2025 to 2035
      • By Country
        • Germany
        • U.K.
        • France
        • Italy
        • Spain
        • Belgium
        • Netherlands
        • Nordic
        • Switzerland
        • Russia
        • Poland
        • Rest of Europe
      • By Function
      • By Active Type
      • By Product Type
      • By Channel
      • By Claim
    • Market Attractiveness Analysis
      • By Country
      • By Function
      • By Active Type
      • By Product Type
      • By Channel
      • By Claim
    • Key Takeaways
  15. East Asia Analysis 2020 to 2024 and Forecast 2025 to 2035, By Country
    • Historical Market Size Value (USD Million) Trend Analysis By Market Taxonomy, 2020 to 2024
    • Market Size Value (USD Million) Forecast By Market Taxonomy, 2025 to 2035
      • By Country
        • China
        • Japan
        • South Korea
      • By Function
      • By Active Type
      • By Product Type
      • By Channel
      • By Claim
    • Market Attractiveness Analysis
      • By Country
      • By Function
      • By Active Type
      • By Product Type
      • By Channel
      • By Claim
    • Key Takeaways
  16. South Asia & Pacific Analysis 2020 to 2024 and Forecast 2025 to 2035, By Country
    • Historical Market Size Value (USD Million) Trend Analysis By Market Taxonomy, 2020 to 2024
    • Market Size Value (USD Million) Forecast By Market Taxonomy, 2025 to 2035
      • By Country
        • India
        • Thailand
        • Malaysia
        • Indonesia
        • Singapore
        • Vietnam
        • Australia
        • New Zealand
        • Rest of South Asia
      • By Function
      • By Active Type
      • By Product Type
      • By Channel
      • By Claim
    • Market Attractiveness Analysis
      • By Country
      • By Function
      • By Active Type
      • By Product Type
      • By Channel
      • By Claim
    • Key Takeaways
  17. Middle East and Africa Analysis 2020 to 2024 and Forecast 2025 to 2035, By Country
    • Historical Market Size Value (USD Million) Trend Analysis By Market Taxonomy, 2020 to 2024
    • Market Size Value (USD Million) Forecast By Market Taxonomy, 2025 to 2035
      • By Country
        • Turkey
        • UAE
        • Saudi Arabia
        • Israel
        • Other GCC Countries
        • North Africa
        • South Africa
      • By Function
      • By Active Type
      • By Product Type
      • By Channel
      • By Claim
    • Market Attractiveness Analysis
      • By Country
      • By Function
      • By Active Type
      • By Product Type
      • By Channel
      • By Claim
    • Key Takeaways
  18. Key Countries Analysis
    • U.S.
      • Pricing Analysis
      • Market Share Analysis, 2024
        • By Function
        • By Active Type
        • By Product Type
        • By Channel
        • By Claim
    • Canada
      • Pricing Analysis
      • Market Share Analysis, 2024
        • By Function
        • By Active Type
        • By Product Type
        • By Channel
        • By Claim
    • Mexico
      • Pricing Analysis
      • Market Share Analysis, 2024
        • By Function
        • By Active Type
        • By Product Type
        • By Channel
        • By Claim
    • Brazil
      • Pricing Analysis
      • Market Share Analysis, 2024
        • By Function
        • By Active Type
        • By Product Type
        • By Channel
        • By Claim
    • Germany
      • Pricing Analysis
      • Market Share Analysis, 2024
        • By Function
        • By Active Type
        • By Product Type
        • By Channel
        • By Claim
    • U.K.
      • Pricing Analysis
      • Market Share Analysis, 2024
        • By Function
        • By Active Type
        • By Product Type
        • By Channel
        • By Claim
    • Italy
      • Pricing Analysis
      • Market Share Analysis, 2024
        • By Function
        • By Active Type
        • By Product Type
        • By Channel
        • By Claim
    • Spain
      • Pricing Analysis
      • Market Share Analysis, 2024
        • By Function
        • By Active Type
        • By Product Type
        • By Channel
        • By Claim
    • France
      • Pricing Analysis
      • Market Share Analysis, 2024
        • By Function
        • By Active Type
        • By Product Type
        • By Channel
        • By Claim
    • India
      • Pricing Analysis
      • Market Share Analysis, 2024
        • By Function
        • By Active Type
        • By Product Type
        • By Channel
        • By Claim
    • Australia & New Zealand
      • Pricing Analysis
      • Market Share Analysis, 2024
        • By Function
        • By Active Type
        • By Product Type
        • By Channel
        • By Claim
    • China
      • Pricing Analysis
      • Market Share Analysis, 2024
        • By Function
        • By Active Type
        • By Product Type
        • By Channel
        • By Claim
    • Japan
      • Pricing Analysis
      • Market Share Analysis, 2024
        • By Function
        • By Active Type
        • By Product Type
        • By Channel
        • By Claim
    • South Korea
      • Pricing Analysis
      • Market Share Analysis, 2024
        • By Function
        • By Active Type
        • By Product Type
        • By Channel
        • By Claim
    • Russia
      • Pricing Analysis
      • Market Share Analysis, 2024
        • By Function
        • By Active Type
        • By Product Type
        • By Channel
        • By Claim
    • Poland
      • Pricing Analysis
      • Market Share Analysis, 2024
        • By Function
        • By Active Type
        • By Product Type
        • By Channel
        • By Claim
    • Hungary
      • Pricing Analysis
      • Market Share Analysis, 2024
        • By Function
        • By Active Type
        • By Product Type
        • By Channel
        • By Claim
    • Kingdom of Saudi Arabia
      • Pricing Analysis
      • Market Share Analysis, 2024
        • By Function
        • By Active Type
        • By Product Type
        • By Channel
        • By Claim
    • South Africa
      • Pricing Analysis
      • Market Share Analysis, 2024
        • By Function
        • By Active Type
        • By Product Type
        • By Channel
        • By Claim
  19. Market Structure Analysis
    • Competition Dashboard
    • Competition Benchmarking
    • Market Share Analysis of Top Players
      • By Regional
      • By Function
      • By Active Type
      • By Product Type
      • By Channel
      • By Claim
  20. Competition Analysis
    • Competition Deep Dive
      • Estée Lauder
        • Overview
        • Product Portfolio
        • Profitability by Market Segments (Product/Age /Sales Channel/Region)
        • Sales Footprint
        • Strategy Overview
        • Shiseido
        • L’Oréal
        • Lancôme
        • Clarins
        • SK-II
        • Kiehl’s
        • Amorepacific
        • Murad
        • Clinique
    • Assumptions & Acronyms Used
    • Research Methodology

List of Tables

  • Table 1: Global Value (USD Million) Forecast by Region, 2020-2035
  • Table 2: Global Value (USD Million) Forecast by Function, 2020-2035
  • Table 3: Global Value (USD Million) Forecast by Active Type, 2020-2035
  • Table 4: Global Value (USD Million) Forecast by Product Type, 2020-2035
  • Table 5: Global Value (USD Million) Forecast by Channel, 2020-2035
  • Table 6: Global Value (USD Million) Forecast by Claim, 2020-2035
  • Table 7: North America Value (USD Million) Forecast by Country, 2020-2035
  • Table 8: North America Value (USD Million) Forecast by Function, 2020-2035
  • Table 9: North America Value (USD Million) Forecast by Active Type, 2020-2035
  • Table 10: North America Value (USD Million) Forecast by Product Type, 2020-2035
  • Table 11: North America Value (USD Million) Forecast by Channel, 2020-2035
  • Table 12: North America Value (USD Million) Forecast by Claim, 2020-2035
  • Table 13: Latin America Value (USD Million) Forecast by Country, 2020-2035
  • Table 14: Latin America Value (USD Million) Forecast by Function, 2020-2035
  • Table 15: Latin America Value (USD Million) Forecast by Active Type, 2020-2035
  • Table 16: Latin America Value (USD Million) Forecast by Product Type, 2020-2035
  • Table 17: Latin America Value (USD Million) Forecast by Channel, 2020-2035
  • Table 18: Latin America Value (USD Million) Forecast by Claim, 2020-2035
  • Table 19: Europe Value (USD Million) Forecast by Country, 2020-2035
  • Table 20: Europe Value (USD Million) Forecast by Function, 2020-2035
  • Table 21: Europe Value (USD Million) Forecast by Active Type, 2020-2035
  • Table 22: Europe Value (USD Million) Forecast by Product Type, 2020-2035
  • Table 23: Europe Value (USD Million) Forecast by Channel, 2020-2035
  • Table 24: Europe Value (USD Million) Forecast by Claim, 2020-2035
  • Table 25: East Asia Value (USD Million) Forecast by Country, 2020-2035
  • Table 26: East Asia Value (USD Million) Forecast by Function, 2020-2035
  • Table 27: East Asia Value (USD Million) Forecast by Active Type, 2020-2035
  • Table 28: East Asia Value (USD Million) Forecast by Product Type, 2020-2035
  • Table 29: East Asia Value (USD Million) Forecast by Channel, 2020-2035
  • Table 30: East Asia Value (USD Million) Forecast by Claim, 2020-2035
  • Table 31: South Asia & Pacific Value (USD Million) Forecast by Country, 2020-2035
  • Table 32: South Asia & Pacific Value (USD Million) Forecast by Function, 2020-2035
  • Table 33: South Asia & Pacific Value (USD Million) Forecast by Active Type, 2020-2035
  • Table 34: South Asia & Pacific Value (USD Million) Forecast by Product Type, 2020-2035
  • Table 35: South Asia & Pacific Value (USD Million) Forecast by Channel, 2020-2035
  • Table 36: South Asia & Pacific Value (USD Million) Forecast by Claim, 2020-2035
  • Table 37: Middle East and Africa Value (USD Million) Forecast by Country, 2020-2035
  • Table 38: Middle East and Africa Value (USD Million) Forecast by Function, 2020-2035
  • Table 39: Middle East and Africa Value (USD Million) Forecast by Active Type, 2020-2035
  • Table 40: Middle East and Africa Value (USD Million) Forecast by Product Type, 2020-2035
  • Table 41: Middle East and Africa Value (USD Million) Forecast by Channel, 2020-2035
  • Table 42: Middle East and Africa Value (USD Million) Forecast by Claim, 2020-2035

List of Figures

  • Figure 1: Global Pricing Analysis
  • Figure 2: Global Value (USD Million) Forecast 2020-2035
  • Figure 3: Global Value Share and BPS Analysis by Function, 2025 and 2035
  • Figure 4: Global Y-o-Y Growth Comparison by Function, 2025-2035
  • Figure 5: Global Attractiveness Analysis by Function
  • Figure 6: Global Value Share and BPS Analysis by Active Type, 2025 and 2035
  • Figure 7: Global Y-o-Y Growth Comparison by Active Type, 2025-2035
  • Figure 8: Global Attractiveness Analysis by Active Type
  • Figure 9: Global Value Share and BPS Analysis by Product Type, 2025 and 2035
  • Figure 10: Global Y-o-Y Growth Comparison by Product Type, 2025-2035
  • Figure 11: Global Attractiveness Analysis by Product Type
  • Figure 12: Global Value Share and BPS Analysis by Channel, 2025 and 2035
  • Figure 13: Global Y-o-Y Growth Comparison by Channel, 2025-2035
  • Figure 14: Global Attractiveness Analysis by Channel
  • Figure 15: Global Value Share and BPS Analysis by Claim, 2025 and 2035
  • Figure 16: Global Y-o-Y Growth Comparison by Claim, 2025-2035
  • Figure 17: Global Attractiveness Analysis by Claim
  • Figure 18: Global Value (USD Million) Share and BPS Analysis by Region, 2025 and 2035
  • Figure 19: Global Y-o-Y Growth Comparison by Region, 2025-2035
  • Figure 20: Global Attractiveness Analysis by Region
  • Figure 21: North America Incremental $ Opportunity, 2025-2035
  • Figure 22: Latin America Incremental $ Opportunity, 2025-2035
  • Figure 23: Europe Incremental $ Opportunity, 2025-2035
  • Figure 24: East Asia Incremental $ Opportunity, 2025-2035
  • Figure 25: South Asia & Pacific Incremental $ Opportunity, 2025-2035
  • Figure 26: Middle East and Africa Incremental $ Opportunity, 2025-2035
  • Figure 27: North America Value Share and BPS Analysis by Country, 2025 and 2035
  • Figure 28: North America Value Share and BPS Analysis by Function, 2025 and 2035
  • Figure 29: North America Y-o-Y Growth Comparison by Function, 2025-2035
  • Figure 30: North America Attractiveness Analysis by Function
  • Figure 31: North America Value Share and BPS Analysis by Active Type, 2025 and 2035
  • Figure 32: North America Y-o-Y Growth Comparison by Active Type, 2025-2035
  • Figure 33: North America Attractiveness Analysis by Active Type
  • Figure 34: North America Value Share and BPS Analysis by Product Type, 2025 and 2035
  • Figure 35: North America Y-o-Y Growth Comparison by Product Type, 2025-2035
  • Figure 36: North America Attractiveness Analysis by Product Type
  • Figure 37: North America Value Share and BPS Analysis by Channel, 2025 and 2035
  • Figure 38: North America Y-o-Y Growth Comparison by Channel, 2025-2035
  • Figure 39: North America Attractiveness Analysis by Channel
  • Figure 40: North America Value Share and BPS Analysis by Claim, 2025 and 2035
  • Figure 41: North America Y-o-Y Growth Comparison by Claim, 2025-2035
  • Figure 42: North America Attractiveness Analysis by Claim
  • Figure 43: Latin America Value Share and BPS Analysis by Country, 2025 and 2035
  • Figure 44: Latin America Value Share and BPS Analysis by Function, 2025 and 2035
  • Figure 45: Latin America Y-o-Y Growth Comparison by Function, 2025-2035
  • Figure 46: Latin America Attractiveness Analysis by Function
  • Figure 47: Latin America Value Share and BPS Analysis by Active Type, 2025 and 2035
  • Figure 48: Latin America Y-o-Y Growth Comparison by Active Type, 2025-2035
  • Figure 49: Latin America Attractiveness Analysis by Active Type
  • Figure 50: Latin America Value Share and BPS Analysis by Product Type, 2025 and 2035
  • Figure 51: Latin America Y-o-Y Growth Comparison by Product Type, 2025-2035
  • Figure 52: Latin America Attractiveness Analysis by Product Type
  • Figure 53: Latin America Value Share and BPS Analysis by Channel, 2025 and 2035
  • Figure 54: Latin America Y-o-Y Growth Comparison by Channel, 2025-2035
  • Figure 55: Latin America Attractiveness Analysis by Channel
  • Figure 56: Latin America Value Share and BPS Analysis by Claim, 2025 and 2035
  • Figure 57: Latin America Y-o-Y Growth Comparison by Claim, 2025-2035
  • Figure 58: Latin America Attractiveness Analysis by Claim
  • Figure 59: Europe Value Share and BPS Analysis by Country, 2025 and 2035
  • Figure 60: Europe Value Share and BPS Analysis by Function, 2025 and 2035
  • Figure 61: Europe Y-o-Y Growth Comparison by Function, 2025-2035
  • Figure 62: Europe Attractiveness Analysis by Function
  • Figure 63: Europe Value Share and BPS Analysis by Active Type, 2025 and 2035
  • Figure 64: Europe Y-o-Y Growth Comparison by Active Type, 2025-2035
  • Figure 65: Europe Attractiveness Analysis by Active Type
  • Figure 66: Europe Value Share and BPS Analysis by Product Type, 2025 and 2035
  • Figure 67: Europe Y-o-Y Growth Comparison by Product Type, 2025-2035
  • Figure 68: Europe Attractiveness Analysis by Product Type
  • Figure 69: Europe Value Share and BPS Analysis by Channel, 2025 and 2035
  • Figure 70: Europe Y-o-Y Growth Comparison by Channel, 2025-2035
  • Figure 71: Europe Attractiveness Analysis by Channel
  • Figure 72: Europe Value Share and BPS Analysis by Claim, 2025 and 2035
  • Figure 73: Europe Y-o-Y Growth Comparison by Claim, 2025-2035
  • Figure 74: Europe Attractiveness Analysis by Claim
  • Figure 75: East Asia Value Share and BPS Analysis by Country, 2025 and 2035
  • Figure 76: East Asia Value Share and BPS Analysis by Function, 2025 and 2035
  • Figure 77: East Asia Y-o-Y Growth Comparison by Function, 2025-2035
  • Figure 78: East Asia Attractiveness Analysis by Function
  • Figure 79: East Asia Value Share and BPS Analysis by Active Type, 2025 and 2035
  • Figure 80: East Asia Y-o-Y Growth Comparison by Active Type, 2025-2035
  • Figure 81: East Asia Attractiveness Analysis by Active Type
  • Figure 82: East Asia Value Share and BPS Analysis by Product Type, 2025 and 2035
  • Figure 83: East Asia Y-o-Y Growth Comparison by Product Type, 2025-2035
  • Figure 84: East Asia Attractiveness Analysis by Product Type
  • Figure 85: East Asia Value Share and BPS Analysis by Channel, 2025 and 2035
  • Figure 86: East Asia Y-o-Y Growth Comparison by Channel, 2025-2035
  • Figure 87: East Asia Attractiveness Analysis by Channel
  • Figure 88: East Asia Value Share and BPS Analysis by Claim, 2025 and 2035
  • Figure 89: East Asia Y-o-Y Growth Comparison by Claim, 2025-2035
  • Figure 90: East Asia Attractiveness Analysis by Claim
  • Figure 91: South Asia & Pacific Value Share and BPS Analysis by Country, 2025 and 2035
  • Figure 92: South Asia & Pacific Value Share and BPS Analysis by Function, 2025 and 2035
  • Figure 93: South Asia & Pacific Y-o-Y Growth Comparison by Function, 2025-2035
  • Figure 94: South Asia & Pacific Attractiveness Analysis by Function
  • Figure 95: South Asia & Pacific Value Share and BPS Analysis by Active Type, 2025 and 2035
  • Figure 96: South Asia & Pacific Y-o-Y Growth Comparison by Active Type, 2025-2035
  • Figure 97: South Asia & Pacific Attractiveness Analysis by Active Type
  • Figure 98: South Asia & Pacific Value Share and BPS Analysis by Product Type, 2025 and 2035
  • Figure 99: South Asia & Pacific Y-o-Y Growth Comparison by Product Type, 2025-2035
  • Figure 100: South Asia & Pacific Attractiveness Analysis by Product Type
  • Figure 101: South Asia & Pacific Value Share and BPS Analysis by Channel, 2025 and 2035
  • Figure 102: South Asia & Pacific Y-o-Y Growth Comparison by Channel, 2025-2035
  • Figure 103: South Asia & Pacific Attractiveness Analysis by Channel
  • Figure 104: South Asia & Pacific Value Share and BPS Analysis by Claim, 2025 and 2035
  • Figure 105: South Asia & Pacific Y-o-Y Growth Comparison by Claim, 2025-2035
  • Figure 106: South Asia & Pacific Attractiveness Analysis by Claim
  • Figure 107: Middle East and Africa Value Share and BPS Analysis by Country, 2025 and 2035
  • Figure 108: Middle East and Africa Value Share and BPS Analysis by Function, 2025 and 2035
  • Figure 109: Middle East and Africa Y-o-Y Growth Comparison by Function, 2025-2035
  • Figure 110: Middle East and Africa Attractiveness Analysis by Function
  • Figure 111: Middle East and Africa Value Share and BPS Analysis by Active Type, 2025 and 2035
  • Figure 112: Middle East and Africa Y-o-Y Growth Comparison by Active Type, 2025-2035
  • Figure 113: Middle East and Africa Attractiveness Analysis by Active Type
  • Figure 114: Middle East and Africa Value Share and BPS Analysis by Product Type, 2025 and 2035
  • Figure 115: Middle East and Africa Y-o-Y Growth Comparison by Product Type, 2025-2035
  • Figure 116: Middle East and Africa Attractiveness Analysis by Product Type
  • Figure 117: Middle East and Africa Value Share and BPS Analysis by Channel, 2025 and 2035
  • Figure 118: Middle East and Africa Y-o-Y Growth Comparison by Channel, 2025-2035
  • Figure 119: Middle East and Africa Attractiveness Analysis by Channel
  • Figure 120: Middle East and Africa Value Share and BPS Analysis by Claim, 2025 and 2035
  • Figure 121: Middle East and Africa Y-o-Y Growth Comparison by Claim, 2025-2035
  • Figure 122: Middle East and Africa Attractiveness Analysis by Claim
  • Figure 123: Global - Tier Structure Analysis
  • Figure 124: Global - Company Share Analysis

Frequently Asked Questions

How big is the Biorhythmic Skincare Actives Market in 2025?

The global Biorhythmic Skincare Actives Market is estimated to be valued at USD 1,301.60 Million in 2025.

What will be the size of the Biorhythmic Skincare Actives Market in 2035?

The market size for the Biorhythmic Skincare Actives Market is projected to reach USD 4,402.10 Million by 2035.

How much will be the Biorhythmic Skincare Actives Market growth between 2025 and 2035?

The Biorhythmic Skincare Actives Market is expected to grow at a CAGR of 13.00% between 2025 and 2035.

What are the key product types in the Biorhythmic Skincare Actives Market?

The key product types in the Biorhythmic Skincare Actives Market are serums, night creams, day creams, masks, and others.

Which function segment will contribute significant share in the Biorhythmic Skincare Actives Market in 2025?

In terms of function, the night repair & regeneration segment is expected to command 55.60% share in the Biorhythmic Skincare Actives Market in 2025.

Explore Similar Insights

Future Market Insights

Biorhythmic Skincare Actives Market

Chat With

MaRIA

Hi There, I am MaRIA, Your Market Research Intelligence Assistant. How may I help you?