Bio-Fermented Skincare Actives Market Size and Share Forecast Outlook 2025 to 2035

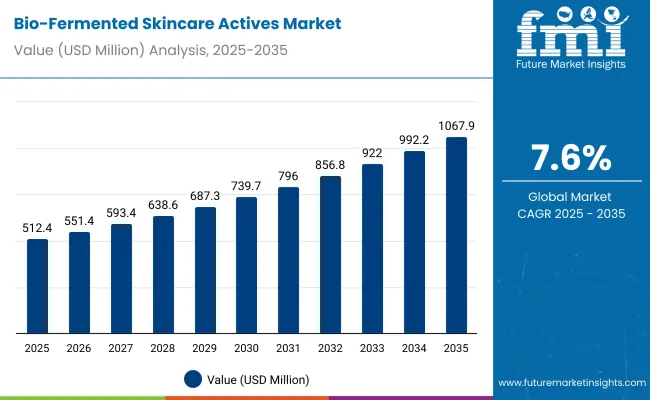
The Bio-Fermented Skincare Actives Market is expected to record a valuation of USD 512.4 million in 2025 and reach USD 1,067.9 million by 2035, which reflects a 2.08X growth over the decade. This overall expansion represents a compound annual growth rate (CAGR) of 7.6% between 2025 and 2035.

Quick Stats for Bio-Fermented Skincare Actives Market
  • Bio-Fermented Skincare Actives Market Value (2025): USD 512.4 million
  • Bio-Fermented Skincare Actives Market Forecast Value (2035): USD 1,067.9 million
  • Bio-Fermented Skincare Actives Market Forecast CAGR: 7.6%
  • Leading Ingredient in Bio-Fermented Skincare Actives Market in 2025: Fermented Botanical Extracts (38.5%)
  • Key Growth Regions in the Bio-Fermented Skincare Actives Market: North America, Southeast & Pacific, East Asia
  • Top Key Players in Bio-Fermented Skincare Actives Market: Gallinée, Codex Labs, Ltd, Jowaé (Laboratoires Pierre Fabre), Aurelia London, Glow Recipe,TULA Skincare, Amorepacific, Biomilq, Fermentology

Bio Fermented Skincare Actives Market

Bio-Fermented Skincare Actives Market Key Takeaways

Metric Value
Market Estimated Value in (2025E) USD 512.4 million
Market Forecast Value in (2035F) USD 1,067.9 million
Forecast CAGR (2025 to 2035) 7.6%

During the first five-year period from 2025 to 2030, the market is projected to grow from USD 512.4 million to approximately USD 739.7 million, adding USD 227.3 million, which accounts for around 40.9% of the total decade growth. This segment reflects the gradual increase in demand for hydration-centered and microbiome-nourishing skincare, where facial serums lead product adoption because of their non-greasy texture and high content of fermented actives. Fermented botanical extracts lead ingredient use, aligning with growing consumer interest in clean and plant-derived formulations.

The second half, from 2030 to 2035, contributes an additional USD 328.2 million, equal to 59.1% of the total decade growth, as the market expands from USD 739.7 million to USD 1,067.9 million. Growth accelerates throughout the span of the period as brands are spending in hybrid formulations that blend probiotics, fermented oils, and marine extracts, and consumer demand is changing direction toward barrier-repair and skin recovery routines. Advanced fermentation processes and bioavailability-enhanced delivery systems come into popular, and India and China become the growth engines, fueled by their increasing skincare-literate populations and digitally native purchasing habits.

From 2020 to 2024, the Bio-Fermented Skincare Actives Market experienced gradual but consistent growth, as clean beauty trends began to meaningfully influence formulation decisions. Although quantitative data before 2025 remains limited, this foundational period was marked by formulation-centric innovation, particularly from emerging brands that incorporated fermented plant extracts and probiotic cultures into facial serums, moisturizers, and lightweight emulsions.

Market activity during this stage was largely driven by ingredient-focused product launches, with brands such as Gallinée, Codex Labs, and Aurelia London gaining recognition for microbiome-friendly offerings. Differentiation strategies centered around transparency of ingredients, clinical efficacy, and alignment with sensitive-skin needs. During this phase, ingestibles and skin-gut supplements remained niche, contributing modestly to total category revenues without reaching broad adoption.

Demand for bio-fermented skincare actives is projected to reach USD 512.4 million by 2025, signaling the beginning of a new growth trajectory. As the market moves toward USD 1,067.9 million by 2035, product forms are diversifying. With advancements in ingredient science and consumer personalization, brands are integrating multi-form delivery systems that blend topical applications with ingestible supplements and skin diagnostics.

Traditional skincare giants now face increasing competition from biotech-backed startups offering DNA-personalized solutions, fermented hybrids, and circadian-aligned actives. In response, established players are evolving toward holistic wellness models, encompassing prebiotic formulations, smart customization engines, and AI-based recommendations. New entrants with expertise in bio-enhanced fermentation, algorithm-driven personalization, and clean yet potent formulations are gaining share. The competitive edge is transitioning from single-product success to comprehensive, clinically validated ecosystemspowered by digital engagement and repeat usage patterns.

Why the Bio-Fermented Skincare Actives Market is growing?

Advances in fermentation science have resulted in very bioavailable actives that are highly effective and skin friendly. Fermented ingredients provide the ultimate combination of hydration, anti-inflammatory support, and microbiome balance for an effective minimalist skincare solution for sensitive skin.

Demand is further accelerated by consumer fatigue toward aggressive actives and is shifting into a direction of barrier-repair-focused skincare. Brands will innovate with hybrid formulations and with textures that lend themselves to layering yet blend into a multi-step routine. Big advances in biotech will ensure the delivery of those actives for optimal, non-irritating performance.

Segmental Analysis

The bio-fermented skincare actives market is segmented by function, ingredient type, end-use, and region, reflecting the product’s diverse applications and consumer needs. Key functional categories include hydration support, microbiome repair, antioxidant defense, and anti-inflammatory support, addressing specific skin concerns.

Ingredient segmentation covers fermented botanical extracts, marine extracts, probiotic cultures, yeast-based ferments, and other fermented oils, each offering unique skin benefits. End-use segmentation spans facial serums, creams, masks, toners, SPF products, and eye care, highlighting the versatility of fermented actives across product forms.

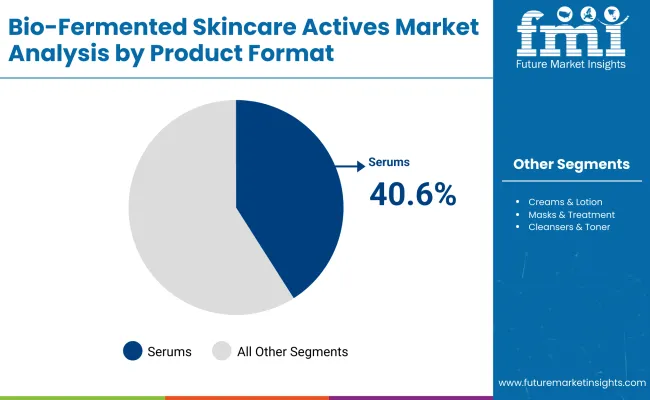
Insights into the End Use Segment with Face Serum Leading in Market Share

Bio Fermented Skincare Actives Market By Enduse

By End Use Value Share% 2025
Facial Serums 33.8%
Others 66.2%

The facial serum segment accounts for 33.8% of total value sales in the bio-fermented skincare actives market in 2025, representing the largest end-use category. This leadership stems from consumer preference for lightweight, high-concentration formulations that deliver potent actives directly into the skin. Bio-fermented ingredients, being predominantly water-based and enriched with amino acids, peptides, and probiotics, are ideally suited for serums, which facilitate deep dermal penetration and enhanced efficacy.

The segment’s dominance is reinforced by the growing popularity of multi-step skincare routines, where serums serve as the targeted treatment phase for hydration, barrier strengthening, and soothing benefits. As microbiome-friendly skincare gains traction, brands are using serums as the ideal format to showcase the performance of fermented botanicals and probiotics. Innovations in layered textures, encapsulation technology, and sensorial appeal are further cementing serums as the primary vehicle for delivering bio-fermented actives in both premium and masstige categories.

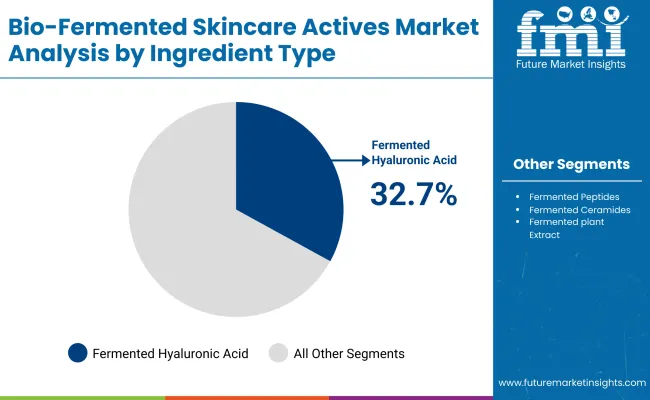
Insights into the Ingredient Type Segment with Fermented Botanical ExtractsDominating the Demand

Bio Fermented Skincare Actives Market By Ingrediant

By Ingredient Type Value Share% 2025
Fermented Botanical Extracts 38.5%
Others 61.5%

Fermented botanical extracts hold the largest share of the bio-fermented skincare actives market in 2025, accounting for 38.5% of total value sales. Their dominance is driven by the rising consumer demand for naturally derived, plant-based solutions enhanced through fermentation, which boosts bioavailability, nutrient density, and antioxidant potency. Fermentation not only breaks down complex plant compounds into smaller, more absorbable molecules but also creates unique bioactivessuch as amino acids, peptides, and organic acidsthat offer superior skin hydration, brightening, and anti-aging benefits.

This segment’s growth is further supported by the clean beauty movement and the preference for eco-friendly, sustainable ingredients. Fermented botanicals, ranging from green tea and ginseng to rice water and hibiscus, are being featured prominently in formulations targeting sensitive skin, barrier repair, and overall skin vitality. As brands continue to combine traditional herbal remedies with modern biotech processes, fermented botanical extracts are expected to remain the go-to ingredient type in premium, natural, and functional skincare lines.

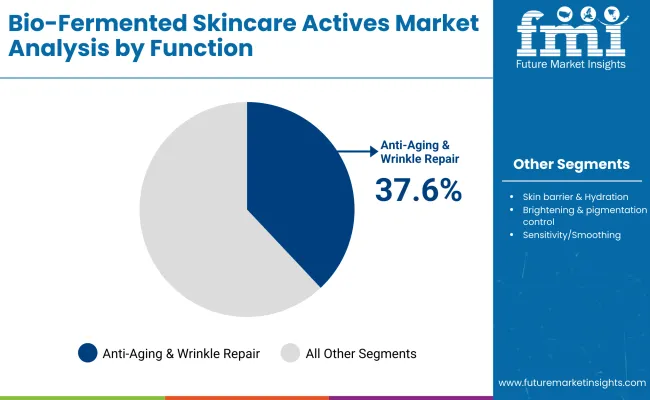
Insights into the Function Segment with Hydration Support Dominating the Demand

By Function Value Share% 2025
Hydration Support 37.2%
Others 62.8%

Hydration support accounts for 37.2% of the bio-fermented skincare actives market value in 2025, making it the leading functional category. This dominance stems from the universal consumer need to maintain skin moisture balance, especially as lifestyles, climate change, and urban pollution contribute to increased dryness and barrier disruption. Fermented activessuch as hyaluronic acid, amino acids, and fermented plant polysaccharidesare particularly effective in hydration because the fermentation process produces smaller molecular structures that penetrate deeper into the skin, ensuring longer-lasting moisture retention.

The segment’s strength is also driven by the popularity of minimalistic yet targeted skincare routines, where hydration-focused products serve as a foundation for overall skin health. Demand is amplified by the growing inclusion of hydration claims in multi-benefit products like serums, essences, and sheet masks, as well as by the expansion of K-beauty-inspired layering techniques. With ongoing innovation in microbiome-friendly and water-binding fermented complexes, hydration support is expected to retain its leadership in the function segment throughout the forecast period.

What are the Drivers, Restraints, and Key Trends of the Global Bio-Fermented Skincare Actives Market?

Cost Complexity of Fermentation-Based Formulations

Botanical or probiotic ingredient fermentation as a production process needs a controlled lab space, precise microbial strains, and sometimes lengthy incubation times to achieve the desired bioactive compounds. Production is thus more labor-intensive and time-consuming than traditional skincare actives. Moreover, maintaining batch-to-batch consistency in microbial activity and extract strength complicates the formulation process. For new brands, these expenses can be discouraging, particularly when the costs are added to the requirements of stability testing, clinical confirmation, and specialty packaging to maintain ingredient efficacy. Consequently, price-conscious markets can become inaccessible to entry, reducing adoption even as consumer appetite increases.

Formulation Fragility and Shelf Life Limitations

Bio-fermented actives, being as active and strong as they are, are more delicate in terms of environmental aspects such as temperature, light, and pH. Some fermented ingredients deteriorate readily when exposed to air or mixed with other reactive ingredients in a formula. This creates long shelf life challenging without using synthetic stabilizersa step against clean beauty standards.

Consequently, there is also a cost incurred by producers to make investments in enhanced encapsulation technology or airless packaging systems, which adds to their production cost. Such constraints can limit product form innovation and create storage, transportation, and end-user application issues, particularly in warm or damp conditions.

Analysis of Bio-Fermented Skincare Actives Market By Key Countries

Bio Fermented Skincare Actives Market By Country

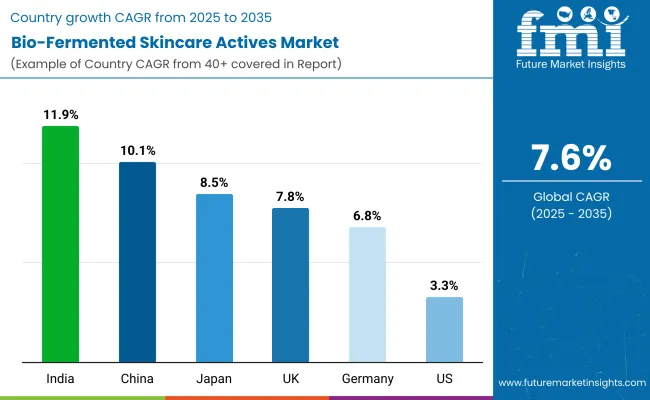
Countries CAGR
China 10.1%
India 11.9%
Germany 6.8%
USA 3.3%
UK 7.8%
Japan 8.5%

The global bio-fermented skincare actives market shows clear regional variations in growth, shaped by consumer adoption of microbiome-friendly skincare, cosmetic biotechnology advancements, and shifting ingredient regulations. Asia-Pacific leads the expansion, with India growing at 11.9% CAGR and China at 10.1% CAGR. China’s growth is fueled by rapid innovation in probiotic and postbiotic actives, supportive regulatory frameworks for novel cosmetic ingredients, and strong e-commerce ecosystems such as Tmall and Douyin that accelerate brand penetration.

India’s surge reflects rising demand for fermented botanicals, increasing consumer awareness of natural actives, and expanding domestic manufacturing for both local consumption and exports. Europe maintains a strong growth profile, led by Germany at 6.8% CAGR and the UK at 7.8% CAGR, supported by high consumer preference for clean-label, sustainable formulations and advanced R&D capabilities in fermentation-based cosmetics.

Japan’s 8.5% CAGR is driven by its deep-rooted cultural association with fermentation and the premium positioning of its skincare products. In contrast, North America grows at a more moderate pace, with the USA at 3.3% CAGR, reflecting a mature premium skincare market and slower integration of fermented actives compared to Asia. Growth in this region is more focused on high-value niche launches, personalized skincare, and the adoption of biotech-derived ingredients in anti-aging and hydration solutions rather than large-scale volume expansion.

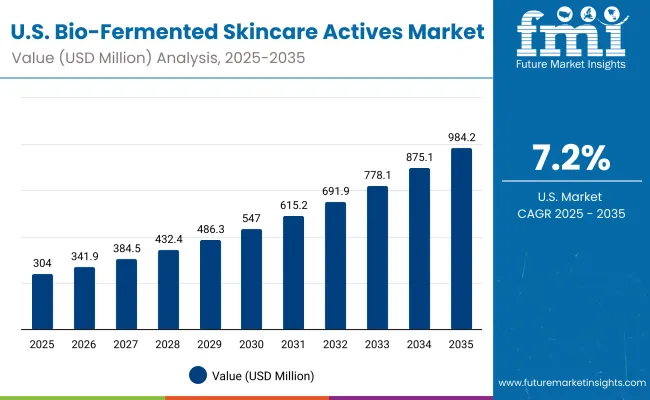
Sales Outlook for Bio-Fermented Skincare Actives in the United States

Year USA Bio-Fermented Skincare Actives Market (USD Million)
2025 125.3
2026 133.6
2027 142.9
2028 152.7
2029 163.2
2030 174.5
2031 186.5
2032 199.4
2033 213.1
2034 227.8
2035 243.5

The bio-fermented skincare actives market in the United States is projected to grow from USD 125.3 million in 2025 to USD 243.5 million by 2035, reflecting a CAGR of approximately 6.6%. This steady growth is driven by rising consumer interest in microbiome-friendly formulations, increasing adoption of sustainable and natural ingredients, and the premiumization of skincare routines. Hydration support remains a leading application, accounting for 39.5% of the 2025 market value, supported by the demand for postbiotic-infused moisturizers, serums, and masks.

The USA market is also seeing increased investment from both domestic and international beauty brands aiming to expand their clean beauty portfolios. Innovation pipelines are focusing on biotechnology-driven actives, personalized skincare solutions, and the incorporation of fermented botanicals into multifunctional formulations. Growth is further supported by the integration of bio-fermented actives into luxury spa and wellness offerings, as well as their positioning in anti-aging and skin barrier repair categories.

  • Hydration support dominates application demand, driven by postbiotic and fermented botanical product launches.
  • Premium skincare brands are expanding portfolios with bio-fermented ingredients to align with clean beauty trends.
  • Biotechnology and personalized skincare innovations are creating opportunities for high-margin, niche positioning.

Growth and Expansion Outlook for Bio-Fermented Skincare Actives Market in the United Kingdom

The Bio-Fermented Skincare Actives Market in the United Kingdom is expected to grow at a CAGR of 7.8%, driven by rising demand for microbiome-focused beauty solutions and natural, eco-friendly formulations. Premium skincare brands are increasingly incorporating probiotics, postbiotics, and fermented botanical extracts to enhance product efficacy and align with consumer preferences for clean-label cosmetics.

Luxury spas and wellness centers are integrating fermented actives into high-end facial treatments, targeting hydration, barrier repair, and anti-aging benefits. Online and specialty beauty retailers are expanding product portfolios with targeted marketing campaigns that emphasize science-backed skin health. Collaboration between cosmetic chemists, research institutions, and skincare brands is fostering innovation in multifunctional products that combine hydration, soothing effects, and skin regeneration.

  • Luxury spas are incorporating fermented actives into premium facial and body treatments.
  • Beauty brands are leveraging probiotic and postbiotic actives for skin barrier and anti-aging solutions.
  • E-commerce platforms are promoting bio-fermented skincare through science-led marketing.

Growth and Expansion Outlook for Bio-Fermented Skincare Actives Market in India

India is witnessing rapid growth in the Bio-Fermented Skincare Actives Market, which is forecast to expand at a CAGR of 11.9% through 2035. This momentum is fueled by rising consumer awareness of microbiome health, an expanding middle-class population, and the growing popularity of herbal and natural-based skincare. Domestic beauty brands are increasingly incorporating fermented botanicals, probiotics, and enzymatic extracts into formulations, appealing to both urban and tier-2 city consumers.

Ayurvedic and traditional wellness companies are innovating by blending time-tested remedies with modern fermentation science, while e-commerce platforms are boosting market reach through influencer-driven campaigns. International skincare brands are also entering the Indian market, introducing premium fermented actives in serums, masks, and moisturizers to cater to the demand for high-performance skincare.

  • Domestic brands are integrating fermented actives with Ayurvedic ingredients for unique product positioning.
  • E-commerce growth is accelerating consumer access to premium fermented skincare.
  • International players are launching probiotic and botanical fermentation-based products in India.

Sales Outlook for Bio-Fermented Skincare Actives in China

The Bio-Fermented Skincare Actives Market in China is expected to grow at a CAGR of 10.1%, the highest among leading economies. This rapid expansion is supported by strong consumer demand for premium, efficacy-driven skincare products and the increasing integration of traditional Chinese medicine with modern fermentation technologies. Domestic beauty brands are innovating with rice, tea, and herbal fermentations, while international brands are launching probiotic-rich and enzyme-based formulations tailored to local skin concerns.

Rising disposable incomes and a preference for science-backed natural skincare are further fueling growth. E-commerce giants and social commerce platforms are amplifying reach through livestreaming, influencer partnerships, and targeted campaigns. The market also benefits from government-backed support for the domestic cosmetics industry, encouraging innovation and clean-label formulations.

  • Local brands are developing fermented actives using traditional herbal and botanical ingredients.
  • E-commerce and social commerce are driving rapid adoption across urban and rural markets.
  • International brands are customizing probiotic and enzyme-rich products for Chinese consumers.

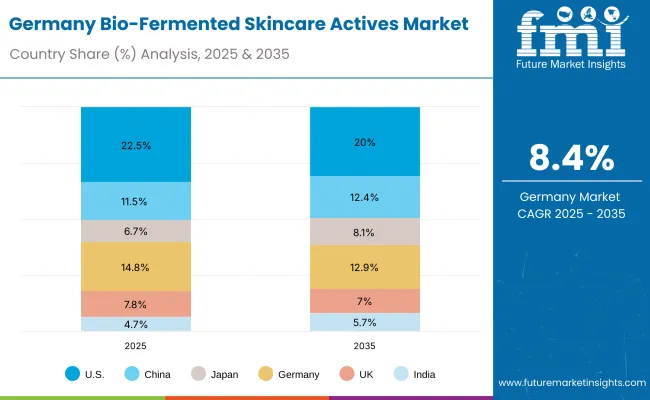
In-depth Analysis of Bio-Fermented Skincare Actives in Germany

Countries 2025 Share (%)
USA 24.4%
Germany 12.6%
China 11.8%
UK 8.2%
Japan 7.4%
India 4.6%
Countries 2035 Share (%)
USA 22.8%
Germany 10.9%
China 12.6%
UK 7.4%
Japan 8.8%
India 5.7%

The Bio-Fermented Skincare Actives Market in Germany is projected to grow at a CAGR of 6.8%, supported by the country’s strong presence in premium skincare manufacturing and its reputation for high-quality, science-driven formulations. German brands are leveraging advanced fermentation techniques to create probiotic, enzyme-rich, and postbiotic skincare solutions, often paired with dermatological actives for enhanced efficacy.

Demand is being fueled by consumer preference for clean-label, clinically validated products, as well as the growing popularity of microbiome-friendly skincare. The premium segment dominates, with brands focusing on high-end distribution through pharmacies, dermatology clinics, and specialty retailers. Sustainability is also a key driver, with manufacturers adopting eco-friendly fermentation processes, recyclable packaging, and locally sourced raw materials.

  • German brands are innovating with probiotic and postbiotic formulations targeting sensitive and aging skin.
  • Pharmacy and dermatology clinic channels are the main sales drivers in the premium segment.
  • Sustainability initiatives are reshaping product development and packaging strategies.

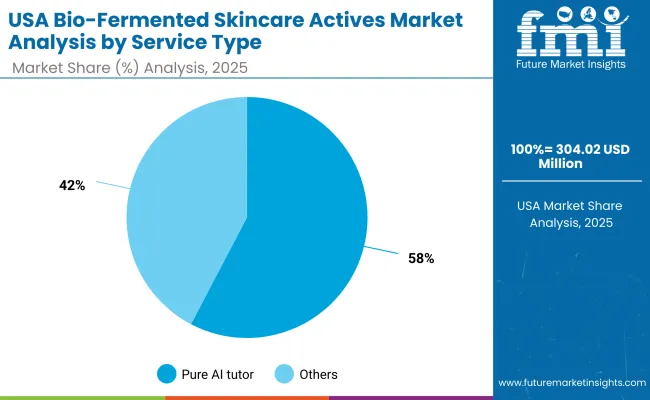
Growth Outlook for Bio-Fermented Skincare Actives Market in USA

USA By Function Value Share% 2025
Hydration Support 39.5%
Others 60.5%

The Bio-Fermented Skincare Actives Market in the USA is projected to reach USD 125.3 million in 2025, with hydration support products accounting for 39.5% of total value sales, reflecting growing consumer demand for microbiome-friendly moisturization solutions. The remaining 60.5% share is driven by multifunctional formulations targeting anti-aging, skin barrier repair, and brightening, often blending fermented actives with botanical extracts and dermatological ingredients.

The market’s expansion is supported by a rising preference for clean-label, clinically proven skincare, with strong traction in the masstige and premium segments distributed via pharmacies, specialty beauty retailers, and e-commerce. Increasing collaborations between dermatologists and skincare brands are fostering innovation, particularly in postbiotic-enriched and sensitive-skin-friendly product lines.

  • Hydration support remains the largest single functional segment at nearly 40% of market value.
  • Anti-aging and skin-repair actives are driving the “Others” category’s dominant share.
  • E-commerce and pharmacy channels are accelerating product accessibility and market penetration.

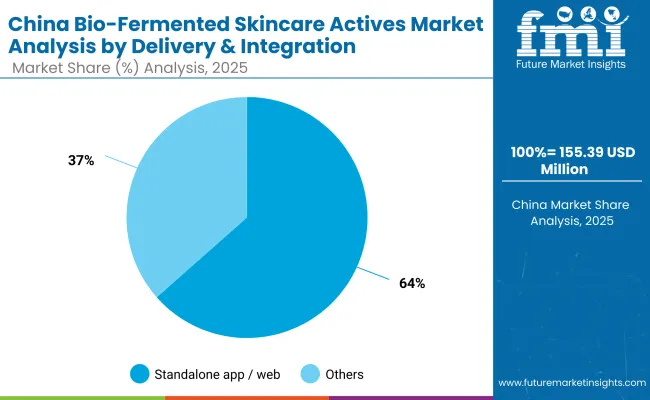
Opportunity Analysis of China Bio-Fermented Skincare Actives Market

China By Function Value Share% 2025
Hydration Support 36.80%
Others 63.2%

The Bio-Fermented Skincare Actives Market in China is projected at USD 60.46 million in 2025, with hydration support products accounting for 36.8% of total value sales and the remaining 63.2% driven by multifunctional formulations targeting brightening, anti-aging, and skin barrier restoration. The strong dominance of the “Others” category reflects China’s consumer preference for multi-benefit skincare, where fermented actives are paired with botanicals, peptides, and traditional herbal extracts for holistic skin health.

Local brands are innovating aggressively, leveraging fermentation technology to create differentiated textures, faster absorption rates, and probiotic-rich formulations, while premium international players are focusing on provenance storytelling and dermatological claims to appeal to urban middle-class consumers. E-commerce platforms such as Tmall and Douyin are accelerating brand reach, especially through livestream selling and influencer-led educational campaigns.

  • China’s market value in 2025 is USD 60.46 million.
  • Hydration support holds 36.8% share, while multi-functional products lead at 63.2%.
  • E-commerce, influencer marketing, and product innovation are key growth drivers.

Competitive Landscape of Bio-Fermented Skincare Actives Market

Bio Fermented Skincare Actives Market By Company

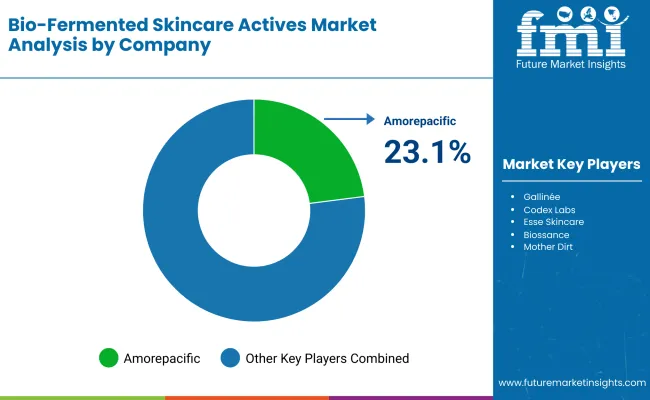
The global bio-fermented skincare actives market is moderately consolidated, with key leadership attributed to a few established players and an emerging base of biotech-driven innovators. Amorepacific leads the market decisively, accounting for an estimated 23.1% of global value share in 2025. The company’s dominance is grounded in its integrated R&D infrastructure, extensive portfolio of fermented activesparticularly those derived from green tea, soybean, and ginsengand its strategic use of proprietary fermentation technology.

Amorepacific's investments in microbiome science and skin barrier innovation have significantly elevated its positioning among consumers seeking both efficacy and safety, particularly across Asia-Pacific and global luxury skincare segments. While Amorepacific commands the largest share, the remaining 76.9% is distributed among a dynamic mix of niche brands and science-led startups. Gallinée, for instance, is gaining attention for its patented multi-biotic complexes that incorporate fermented rice water, lactic acid bacteria, and postbiotics tailored for sensitive skin.

Though not a volume leader, its brand equity is growing in microbiome-first skincare conversations. Codex Labs is distinguishing itself through its dermatology-oriented approach, with fermented botanicals and its preservative-free system (PreservX®) targeting medical-grade wellness buyers. Brands like Esse Skincare and Aurelia London continue to build specialized traction, combining traditional botanical wisdom with modern fermentation science.

Meanwhile, companies such as Mother Dirt and AOBiome are innovating with live probiotic cultures and ammonia-oxidizing bacteriaoffering experimental but intriguing solutions for skin microbiota balance. The competitive landscape is evolving beyond ingredient sourcing to encompass ecosystem strategiesincluding ingestible forms, AI-based skin diagnostics, and biotech-powered personalization. In this market, long-term leadership will likely depend on scientific validation, clinical outcomes, and sustainability-backed transparency, as consumers demand more than just clean labelsthey seek proof-driven performance and purpose-driven brands.

Key Developments in Bio-Fermented Skincare Actives Market

  • On January 23, 2024, Gallinée launched its Face Recovery Mask, formulated with fermented rice water, kaolin clay, and multi-biotics. The product delivers deep hydration and barrier support for sensitive skin. Industry experts view it as a milestone in making fermented botanical actives a mainstream solution in microbiome-friendly skincare.
  • On April 8, 2025, Codex Labs launched its Bia Ultra‑Hydrating Soothing Lotion, an over‑the‑counter product certified by both the National Eczema Association (NEA) and MyMicrobiome as microbiome‑friendly. This lotion, built around the patented BiaComplex 2.0™a blend of biotech-derived terrestrial and marine plant cellular extractsaddresses hydration, itch, and barrier repair via synergistic mechanisms like boosting ceramide production and structural proteins.

Scope of the Report

Item Value
Quantitative Units USD 512.4 million
Ingredient Type Fermented Botanical Extracts, Fermented Marine Extracts, Fermented Probiotic Cultures, Yeast-Based Ferments, Other Fermented Oils
Function Hydration Support, Microbiome Repair, Antioxidant Defense, Anti-Inflammatory Support
End Use Facial Serums, Creams & Moisturizers, Face Masks, Essences & Toners, SPF & Sun Care, Eye Care Products
Regions Covered North America, Europe, Asia-Pacific, Latin America, Middle East & Africa
Country Covered United States, Canada, Germany, France, United Kingdom, China, Japan, India, Brazil, South Africa
Key Companies Profiled Gallinée, Codex Labs, Esse Skincare, Aurelia London, Biossance, Mother Dirt, Symbiome, YUN Probiotherapy, Probi AB, L'Oréal (Active Cosmetics Division), Shiseido (via Gallinée), Beiersdorf, Amorepacific
Additional Attributes Dollar Sales by ingredient type and product form, growing adoption in barrier-repair and microbiome-restoring skincare, rising demand for serums and lightweight formulations, category-specific growth in hydration, anti-inflammatory, and antioxidant segments, revenue segmentation across face care, body care, and ingestible form s, integration and biotech-powered personalization, regional trends influenced by clean beauty movements and digital-first consumer behavior, and innovations in fermentation processes, strain selection, and natural preservation technologies.

Key Segments

By Function:

  • Hydration Support
  • Microbiome Repair
  • Antioxidant Defense
  • Anti-Inflammatory Support

By End Use:

  • Facial Serums
  • Creams & Moisturizers
  • Face Masks
  • Essences & Toners
  • SPF & Sun Care
  • Eye Care Products

By Ingredient Type:

  • Fermented Botanical Extracts
  • Fermented Marine Extracts
  • Fermented Probiotic Cultures
  • Yeast-Based Ferments
  • Other Fermented Oils

By Region:

  • North America
  • Latin America
  • Eastern Europe
  • Western Europe
  • South Asia & Pacific
  • East Asia
  • Middle East & Africa

Table of Content

  1. Executive Summary
    • Global Market Outlook
    • Demand-side Trends
    • Supply-side Trends
    • Technology Roadmap Analysis
    • Analysis and Recommendations
  2. Market Overview
    • Market Coverage / Taxonomys
    • Market Definition / Scope / Limitations
  3. Market Background
    • Market Dynamics
      • Drivers
      • Restraints
      • Opportunity
      • Trends
    • Scenario Forecast
      • Demand in Optimistic Scenario
      • Demand in Likely Scenario
      • Demand in Conservative Scenario
    • Opportunity Map Analysis
    • Product Life Cycle Analysis
    • Supply Chain Analysis
      • Supply Side Participants and their Roles
        • Producers
        • Mid-Level Participants (Traders/ Agents/ Brokers)
        • Wholesalers and Distributors
      • Value Added and Value Created at Node in the Supply Chain
      • List of Raw Material Suppliers
      • List of Existing and Potential Buyer’s
    • Investment Feasibility Matrix
    • Value Chain Analysis
      • Profit Margin Analysis
      • Wholesalers and Distributors
      • Retailers
    • PESTLE and Porter’s Analysis
    • Regulatory Landscape
      • By Key Regions
      • By Key Countries
    • Regional Parent Market Outlook
    • Production and Consumption Statistics
    • Import and Export Statistics
  4. Global Market Analysis 2020 to 2024 and Forecast, 2025 to 2035
    • Historical Market Size Value (USD Million) & Volume (Units) Analysis, 2020 to 2024
    • Current and Future Market Size Value (USD Million) & Volume (Units) Projections, 2025 to 2035
      • Y-o-Y Growth Trend Analysis
      • Absolute $ Opportunity Analysis
  5. Global Market Analysis 2020 to 2024 and Forecast 2025 to 2035, By Function
    • Introduction / Key Findings
    • Historical Market Size Value (USD Million) & Volume (Units) Analysis By Function, 2020 to 2024
    • Current and Future Market Size Value (USD Million) & Volume (Units) Analysis and Forecast By Function, 2025 to 2035
      • Hydration Support
      • Microbiome Repair
      • Antioxidant Defense
      • Anti-Inflammatory Support
    • Y-o-Y Growth Trend Analysis By Function, 2020 to 2024
    • Absolute $ Opportunity Analysis By Function, 2025 to 2035
  6. Global Market Analysis 2020 to 2024 and Forecast 2025 to 2035, By End Use
    • Introduction / Key Findings
    • Historical Market Size Value (USD Million) & Volume (Units) Analysis By End Use, 2020 to 2024
    • Current and Future Market Size Value (USD Million) & Volume (Units) Analysis and Forecast By End Use, 2025 to 2035
      • Facial Serums
      • Creams & Moisturizers
      • Face Masks
      • Essences & Toners
      • SPF & Sun Care
      • Eye Care Products
    • Y-o-Y Growth Trend Analysis By End Use, 2020 to 2024
    • Absolute $ Opportunity Analysis By End Use, 2025 to 2035
  7. Global Market Analysis 2020 to 2024 and Forecast 2025 to 2035, By Ingredient Type
    • Introduction / Key Findings
    • Historical Market Size Value (USD Million) & Volume (Units) Analysis By Ingredient Type, 2020 to 2024
    • Current and Future Market Size Value (USD Million) & Volume (Units) Analysis and Forecast By Ingredient Type, 2025 to 2035
      • Fermented Botanical Extracts
      • Fermented Marine Extracts
      • Fermented Probiotic Cultures
      • Yeast-Based Ferments
      • Other Fermented Oils
    • Y-o-Y Growth Trend Analysis By Ingredient Type, 2020 to 2024
    • Absolute $ Opportunity Analysis By Ingredient Type, 2025 to 2035
  8. Global Market Analysis 2020 to 2024 and Forecast 2025 to 2035, By Region
    • Introduction
    • Historical Market Size Value (USD Million) & Volume (Units) Analysis By Region, 2020 to 2024
    • Current Market Size Value (USD Million) & Volume (Units) Analysis and Forecast By Region, 2025 to 2035
      • North America
      • Latin America
      • Eastern Europe
      • Western Europe
      • South Asia & Pacific
      • East Asia
      • Middle East & Africa
    • Market Attractiveness Analysis By Region
  9. North America Market Analysis 2020 to 2024 and Forecast 2025 to 2035, By Country
    • Historical Market Size Value (USD Million) & Volume (Units) Trend Analysis By Market Taxonomy, 2020 to 2024
    • Market Size Value (USD Million) & Volume (Units) Forecast By Market Taxonomy, 2025 to 2035
      • By Country
        • USA
        • Canada
      • By Function
      • By End Use
      • By Ingredient Type
    • Market Attractiveness Analysis
      • By Country
      • By Function
      • By End Use
      • By Ingredient Type
    • Key Takeaways
  10. Latin America Market Analysis 2020 to 2024 and Forecast 2025 to 2035, By Country
    • Historical Market Size Value (USD Million) & Volume (Units) Trend Analysis By Market Taxonomy, 2020 to 2024
    • Market Size Value (USD Million) & Volume (Units) Forecast By Market Taxonomy, 2025 to 2035
      • By Country
        • Brazil
        • Mexico
        • Colombia
        • Rest of Latin America
      • By Function
      • By End Use
      • By Ingredient Type
    • Market Attractiveness Analysis
      • By Country
      • By Function
      • By End Use
      • By Ingredient Type
    • Key Takeaways
  11. Eastern Europe Market Analysis 2020 to 2024 and Forecast 2025 to 2035, By Country
    • Historical Market Size Value (USD Million) & Volume (Units) Trend Analysis By Market Taxonomy, 2020 to 2024
    • Market Size Value (USD Million) & Volume (Units) Forecast By Market Taxonomy, 2025 to 2035
      • By Country
        • Russia
        • Poland
        • Rest of Europe
      • By Function
      • By End Use
      • By Ingredient Type
    • Market Attractiveness Analysis
      • By Country
      • By Function
      • By End Use
      • By Ingredient Type
    • Key Takeaways
  12. Western Europe Market Analysis 2020 to 2024 and Forecast 2025 to 2035, By Country
    • Historical Market Size Value (USD Million) & Volume (Units) Trend Analysis By Market Taxonomy, 2020 to 2024
    • Market Size Value (USD Million) & Volume (Units) Forecast By Market Taxonomy, 2025 to 2035
      • By Country
        • Germany
        • UK
        • France
        • Italy
        • Spain
        • Belgium
        • Netherlands
        • Switzerland
        • Nordic
      • By Function
      • By End Use
      • By Ingredient Type
    • Market Attractiveness Analysis
      • By Country
      • By Function
      • By End Use
      • By Ingredient Type
    • Key Takeaways
  13. South Asia & Pacific Market Analysis 2020 to 2024 and Forecast 2025 to 2035, By Country
    • Historical Market Size Value (USD Million) & Volume (Units) Trend Analysis By Market Taxonomy, 2020 to 2024
    • Market Size Value (USD Million) & Volume (Units) Forecast By Market Taxonomy, 2025 to 2035
      • By Country
        • India
        • Thailand
        • Malaysia
        • Indonesia
        • Singapore
        • Vietnam
        • Australia
        • New Zealand
        • Rest of South Asia
      • By Function
      • By End Use
      • By Ingredient Type
    • Market Attractiveness Analysis
      • By Country
      • By Function
      • By End Use
      • By Ingredient Type
    • Key Takeaways
  14. East Asia Market Analysis 2020 to 2024 and Forecast 2025 to 2035, By Country
    • Historical Market Size Value (USD Million) & Volume (Units) Trend Analysis By Market Taxonomy, 2020 to 2024
    • Market Size Value (USD Million) & Volume (Units) Forecast By Market Taxonomy, 2025 to 2035
      • By Country
        • China
        • Japan
        • South Korea
      • By Function
      • By End Use
      • By Ingredient Type
    • Market Attractiveness Analysis
      • By Country
      • By Function
      • By End Use
      • By Ingredient Type
    • Key Takeaways
  15. Middle East & Africa Market Analysis 2020 to 2024 and Forecast 2025 to 2035, By Country
    • Historical Market Size Value (USD Million) & Volume (Units) Trend Analysis By Market Taxonomy, 2020 to 2024
    • Market Size Value (USD Million) & Volume (Units) Forecast By Market Taxonomy, 2025 to 2035
      • By Country
        • Turkey
        • UAE
        • Saudi Arabia
        • Israel
        • Other GCC Countries
        • North Africa
        • South Africa
      • By Function
      • By End Use
      • By Ingredient Type
    • Market Attractiveness Analysis
      • By Country
      • By Function
      • By End Use
      • By Ingredient Type
    • Key Takeaways
  16. Key Countries Market Analysis
    • USA
      • Pricing Analysis
      • Market Share Analysis, 2024
        • By Function
        • By End Use
        • By Ingredient Type
    • Canada
      • Pricing Analysis
      • Market Share Analysis, 2024
        • By Function
        • By End Use
        • By Ingredient Type
    • Brazil
      • Pricing Analysis
      • Market Share Analysis, 2024
        • By Function
        • By End Use
        • By Ingredient Type
    • Mexico
      • Pricing Analysis
      • Market Share Analysis, 2024
        • By Function
        • By End Use
        • By Ingredient Type
    • Colombia
      • Pricing Analysis
      • Market Share Analysis, 2024
        • By Function
        • By End Use
        • By Ingredient Type
    • Rest of Latin America
      • Pricing Analysis
      • Market Share Analysis, 2024
        • By Function
        • By End Use
        • By Ingredient Type
    • Germany
      • Pricing Analysis
      • Market Share Analysis, 2024
        • By Function
        • By End Use
        • By Ingredient Type
    • UK
      • Pricing Analysis
      • Market Share Analysis, 2024
        • By Function
        • By End Use
        • By Ingredient Type
    • France
      • Pricing Analysis
      • Market Share Analysis, 2024
        • By Function
        • By End Use
        • By Ingredient Type
    • Italy
      • Pricing Analysis
      • Market Share Analysis, 2024
        • By Function
        • By End Use
        • By Ingredient Type
    • Spain
      • Pricing Analysis
      • Market Share Analysis, 2024
        • By Function
        • By End Use
        • By Ingredient Type
    • Belgium
      • Pricing Analysis
      • Market Share Analysis, 2024
        • By Function
        • By End Use
        • By Ingredient Type
    • Netherlands
      • Pricing Analysis
      • Market Share Analysis, 2024
        • By Function
        • By End Use
        • By Ingredient Type
    • Nordic
      • Pricing Analysis
      • Market Share Analysis, 2024
        • By Function
        • By End Use
        • By Ingredient Type
    • Switzerland
      • Pricing Analysis
      • Market Share Analysis, 2024
        • By Function
        • By End Use
        • By Ingredient Type
    • Russia
      • Pricing Analysis
      • Market Share Analysis, 2024
        • By Function
        • By End Use
        • By Ingredient Type
    • Poland
      • Pricing Analysis
      • Market Share Analysis, 2024
        • By Function
        • By End Use
        • By Ingredient Type
    • Rest of Europe
      • Pricing Analysis
      • Market Share Analysis, 2024
        • By Function
        • By End Use
        • By Ingredient Type
    • China
      • Pricing Analysis
      • Market Share Analysis, 2024
        • By Function
        • By End Use
        • By Ingredient Type
    • Japan
      • Pricing Analysis
      • Market Share Analysis, 2024
        • By Function
        • By End Use
        • By Ingredient Type
    • South Korea
      • Pricing Analysis
      • Market Share Analysis, 2024
        • By Function
        • By End Use
        • By Ingredient Type
    • India
      • Pricing Analysis
      • Market Share Analysis, 2024
        • By Function
        • By End Use
        • By Ingredient Type
    • Thailand
      • Pricing Analysis
      • Market Share Analysis, 2024
        • By Function
        • By End Use
        • By Ingredient Type
    • Malaysia
      • Pricing Analysis
      • Market Share Analysis, 2024
        • By Function
        • By End Use
        • By Ingredient Type
    • Indonesia
      • Pricing Analysis
      • Market Share Analysis, 2024
        • By Function
        • By End Use
        • By Ingredient Type
    • Singapore
      • Pricing Analysis
      • Market Share Analysis, 2024
        • By Function
        • By End Use
        • By Ingredient Type
    • Vietnam
      • Pricing Analysis
      • Market Share Analysis, 2024
        • By Function
        • By End Use
        • By Ingredient Type
    • Australia
      • Pricing Analysis
      • Market Share Analysis, 2024
        • By Function
        • By End Use
        • By Ingredient Type
    • New Zealand
      • Pricing Analysis
      • Market Share Analysis, 2024
        • By Function
        • By End Use
        • By Ingredient Type
    • Rest of South Asia
      • Pricing Analysis
      • Market Share Analysis, 2024
        • By Function
        • By End Use
        • By Ingredient Type
  17. Market Structure Analysis
    • Competition Dashboard
    • Competition Benchmarking
    • Market Share Analysis of Top Players
      • By Regional
      • By Function
      • By End Use
      • By Ingredient Type
  18. Competition Analysis
    • Competition Deep Dive
      • Gallinée
        • Overview
        • Product Portfolio
        • Profitability by Market Segments (Product/Age /Sales Channel/Region)
        • Sales Footprint
        • Strategy Overview
          • Marketing Strategy
          • Product Strategy
          • Channel Strategy
      • Codex Labs
        • Overview
        • Product Portfolio
        • Profitability by Market Segments (Product/Age /Sales Channel/Region)
        • Sales Footprint
        • Strategy Overview
          • Marketing Strategy
          • Product Strategy
          • Channel Strategy
      • Jowaé (Laboratoires Pierre Fabre)
        • Overview
        • Product Portfolio
        • Profitability by Market Segments (Product/Age /Sales Channel/Region)
        • Sales Footprint
        • Strategy Overview
          • Marketing Strategy
          • Product Strategy
          • Channel Strategy
      • Aurelia London
        • Overview
        • Product Portfolio
        • Profitability by Market Segments (Product/Age /Sales Channel/Region)
        • Sales Footprint
        • Strategy Overview
          • Marketing Strategy
          • Product Strategy
          • Channel Strategy
      • Glow Recipe
        • Overview
        • Product Portfolio
        • Profitability by Market Segments (Product/Age /Sales Channel/Region)
        • Sales Footprint
        • Strategy Overview
          • Marketing Strategy
          • Product Strategy
          • Channel Strategy
      • TULA Skincare
        • Overview
        • Product Portfolio
        • Profitability by Market Segments (Product/Age /Sales Channel/Region)
        • Sales Footprint
        • Strategy Overview
          • Marketing Strategy
          • Product Strategy
          • Channel Strategy
      • Amorepacific
        • Overview
        • Product Portfolio
        • Profitability by Market Segments (Product/Age /Sales Channel/Region)
        • Sales Footprint
        • Strategy Overview
          • Marketing Strategy
          • Product Strategy
          • Channel Strategy
      • Biomilq
        • Overview
        • Product Portfolio
        • Profitability by Market Segments (Product/Age /Sales Channel/Region)
        • Sales Footprint
        • Strategy Overview
          • Marketing Strategy
          • Product Strategy
          • Channel Strategy
      • Fermentology
        • Overview
        • Product Portfolio
        • Profitability by Market Segments (Product/Age /Sales Channel/Region)
        • Sales Footprint
        • Strategy Overview
          • Marketing Strategy
          • Product Strategy
          • Channel Strategy
  19. Assumptions & Acronyms Used
  20. Research Methodology

List of Tables

  • Table 1: Global Market Value (USD Million) Forecast by Region, 2020-2035
  • Table 2: Global Market Volume (Units) Forecast by Region, 2020-2035
  • Table 3: Global Market Value (USD Million) Forecast by Function, 2020-2035
  • Table 4: Global Market Volume (Units) Forecast by Function, 2020-2035
  • Table 5: Global Market Value (USD Million) Forecast by End Use, 2020-2035
  • Table 6: Global Market Volume (Units) Forecast by End Use, 2020-2035
  • Table 7: Global Market Value (USD Million) Forecast by Ingredient Type, 2020-2035
  • Table 8: Global Market Volume (Units) Forecast by Ingredient Type, 2020-2035
  • Table 9: North America Market Value (USD Million) Forecast by Country, 2020-2035
  • Table 10: North America Market Volume (Units) Forecast by Country, 2020-2035
  • Table 11: North America Market Value (USD Million) Forecast by Function, 2020-2035
  • Table 12: North America Market Volume (Units) Forecast by Function, 2020-2035
  • Table 13: North America Market Value (USD Million) Forecast by End Use, 2020-2035
  • Table 14: North America Market Volume (Units) Forecast by End Use, 2020-2035
  • Table 15: North America Market Value (USD Million) Forecast by Ingredient Type, 2020-2035
  • Table 16: North America Market Volume (Units) Forecast by Ingredient Type, 2020-2035
  • Table 17: Latin America Market Value (USD Million) Forecast by Country, 2020-2035
  • Table 18: Latin America Market Volume (Units) Forecast by Country, 2020-2035
  • Table 19: Latin America Market Value (USD Million) Forecast by Function, 2020-2035
  • Table 20: Latin America Market Volume (Units) Forecast by Function, 2020-2035
  • Table 21: Latin America Market Value (USD Million) Forecast by End Use, 2020-2035
  • Table 22: Latin America Market Volume (Units) Forecast by End Use, 2020-2035
  • Table 23: Latin America Market Value (USD Million) Forecast by Ingredient Type, 2020-2035
  • Table 24: Latin America Market Volume (Units) Forecast by Ingredient Type, 2020-2035
  • Table 25: Eastern Europe Market Value (USD Million) Forecast by Country, 2020-2035
  • Table 26: Eastern Europe Market Volume (Units) Forecast by Country, 2020-2035
  • Table 27: Eastern Europe Market Value (USD Million) Forecast by Function, 2020-2035
  • Table 28: Eastern Europe Market Volume (Units) Forecast by Function, 2020-2035
  • Table 29: Eastern Europe Market Value (USD Million) Forecast by End Use, 2020-2035
  • Table 30: Eastern Europe Market Volume (Units) Forecast by End Use, 2020-2035
  • Table 31: Eastern Europe Market Value (USD Million) Forecast by Ingredient Type, 2020-2035
  • Table 32: Eastern Europe Market Volume (Units) Forecast by Ingredient Type, 2020-2035
  • Table 33: Western Europe Market Value (USD Million) Forecast by Country, 2020-2035
  • Table 34: Western Europe Market Volume (Units) Forecast by Country, 2020-2035
  • Table 35: Western Europe Market Value (USD Million) Forecast by Function, 2020-2035
  • Table 36: Western Europe Market Volume (Units) Forecast by Function, 2020-2035
  • Table 37: Western Europe Market Value (USD Million) Forecast by End Use, 2020-2035
  • Table 38: Western Europe Market Volume (Units) Forecast by End Use, 2020-2035
  • Table 39: Western Europe Market Value (USD Million) Forecast by Ingredient Type, 2020-2035
  • Table 40: Western Europe Market Volume (Units) Forecast by Ingredient Type, 2020-2035
  • Table 41: South Asia & Pacific Market Value (USD Million) Forecast by Country, 2020-2035
  • Table 42: South Asia & Pacific Market Volume (Units) Forecast by Country, 2020-2035
  • Table 43: South Asia & Pacific Market Value (USD Million) Forecast by Function, 2020-2035
  • Table 44: South Asia & Pacific Market Volume (Units) Forecast by Function, 2020-2035
  • Table 45: South Asia & Pacific Market Value (USD Million) Forecast by End Use, 2020-2035
  • Table 46: South Asia & Pacific Market Volume (Units) Forecast by End Use, 2020-2035
  • Table 47: South Asia & Pacific Market Value (USD Million) Forecast by Ingredient Type, 2020-2035
  • Table 48: South Asia & Pacific Market Volume (Units) Forecast by Ingredient Type, 2020-2035
  • Table 49: East Asia Market Value (USD Million) Forecast by Country, 2020-2035
  • Table 50: East Asia Market Volume (Units) Forecast by Country, 2020-2035
  • Table 51: East Asia Market Value (USD Million) Forecast by Function, 2020-2035
  • Table 52: East Asia Market Volume (Units) Forecast by Function, 2020-2035
  • Table 53: East Asia Market Value (USD Million) Forecast by End Use, 2020-2035
  • Table 54: East Asia Market Volume (Units) Forecast by End Use, 2020-2035
  • Table 55: East Asia Market Value (USD Million) Forecast by Ingredient Type, 2020-2035
  • Table 56: East Asia Market Volume (Units) Forecast by Ingredient Type, 2020-2035
  • Table 57: Middle East & Africa Market Value (USD Million) Forecast by Country, 2020-2035
  • Table 58: Middle East & Africa Market Volume (Units) Forecast by Country, 2020-2035
  • Table 59: Middle East & Africa Market Value (USD Million) Forecast by Function, 2020-2035
  • Table 60: Middle East & Africa Market Volume (Units) Forecast by Function, 2020-2035
  • Table 61: Middle East & Africa Market Value (USD Million) Forecast by End Use, 2020-2035
  • Table 62: Middle East & Africa Market Volume (Units) Forecast by End Use, 2020-2035
  • Table 63: Middle East & Africa Market Value (USD Million) Forecast by Ingredient Type, 2020-2035
  • Table 64: Middle East & Africa Market Volume (Units) Forecast by Ingredient Type, 2020-2035

List of Figures

  • Figure 1: Global Market Value (USD Million) by Function, 2025-2035
  • Figure 2: Global Market Value (USD Million) by End Use, 2025-2035
  • Figure 3: Global Market Value (USD Million) by Ingredient Type, 2025-2035
  • Figure 4: Global Market Value (USD Million) by Region, 2025-2035
  • Figure 5: Global Market Value (USD Million) Analysis by Region, 2020-2035
  • Figure 6: Global Market Volume (Units) Analysis by Region, 2020-2035
  • Figure 7: Global Market Value Share (%) and BPS Analysis by Region, 2025-2035
  • Figure 8: Global Market Y-o-Y Growth (%) Projections by Region, 2025-2035
  • Figure 9: Global Market Value (USD Million) Analysis by Function, 2020-2035
  • Figure 10: Global Market Volume (Units) Analysis by Function, 2020-2035
  • Figure 11: Global Market Value Share (%) and BPS Analysis by Function, 2025-2035
  • Figure 12: Global Market Y-o-Y Growth (%) Projections by Function, 2025-2035
  • Figure 13: Global Market Value (USD Million) Analysis by End Use, 2020-2035
  • Figure 14: Global Market Volume (Units) Analysis by End Use, 2020-2035
  • Figure 15: Global Market Value Share (%) and BPS Analysis by End Use, 2025-2035
  • Figure 16: Global Market Y-o-Y Growth (%) Projections by End Use, 2025-2035
  • Figure 17: Global Market Value (USD Million) Analysis by Ingredient Type, 2020-2035
  • Figure 18: Global Market Volume (Units) Analysis by Ingredient Type, 2020-2035
  • Figure 19: Global Market Value Share (%) and BPS Analysis by Ingredient Type, 2025-2035
  • Figure 20: Global Market Y-o-Y Growth (%) Projections by Ingredient Type, 2025-2035
  • Figure 21: Global Market Attractiveness by Function, 2025-2035
  • Figure 22: Global Market Attractiveness by End Use, 2025-2035
  • Figure 23: Global Market Attractiveness by Ingredient Type, 2025-2035
  • Figure 24: Global Market Attractiveness by Region, 2025-2035
  • Figure 25: North America Market Value (USD Million) by Function, 2025-2035
  • Figure 26: North America Market Value (USD Million) by End Use, 2025-2035
  • Figure 27: North America Market Value (USD Million) by Ingredient Type, 2025-2035
  • Figure 28: North America Market Value (USD Million) by Country, 2025-2035
  • Figure 29: North America Market Value (USD Million) Analysis by Country, 2020-2035
  • Figure 30: North America Market Volume (Units) Analysis by Country, 2020-2035
  • Figure 31: North America Market Value Share (%) and BPS Analysis by Country, 2025-2035
  • Figure 32: North America Market Y-o-Y Growth (%) Projections by Country, 2025-2035
  • Figure 33: North America Market Value (USD Million) Analysis by Function, 2020-2035
  • Figure 34: North America Market Volume (Units) Analysis by Function, 2020-2035
  • Figure 35: North America Market Value Share (%) and BPS Analysis by Function, 2025-2035
  • Figure 36: North America Market Y-o-Y Growth (%) Projections by Function, 2025-2035
  • Figure 37: North America Market Value (USD Million) Analysis by End Use, 2020-2035
  • Figure 38: North America Market Volume (Units) Analysis by End Use, 2020-2035
  • Figure 39: North America Market Value Share (%) and BPS Analysis by End Use, 2025-2035
  • Figure 40: North America Market Y-o-Y Growth (%) Projections by End Use, 2025-2035
  • Figure 41: North America Market Value (USD Million) Analysis by Ingredient Type, 2020-2035
  • Figure 42: North America Market Volume (Units) Analysis by Ingredient Type, 2020-2035
  • Figure 43: North America Market Value Share (%) and BPS Analysis by Ingredient Type, 2025-2035
  • Figure 44: North America Market Y-o-Y Growth (%) Projections by Ingredient Type, 2025-2035
  • Figure 45: North America Market Attractiveness by Function, 2025-2035
  • Figure 46: North America Market Attractiveness by End Use, 2025-2035
  • Figure 47: North America Market Attractiveness by Ingredient Type, 2025-2035
  • Figure 48: North America Market Attractiveness by Country, 2025-2035
  • Figure 49: Latin America Market Value (USD Million) by Function, 2025-2035
  • Figure 50: Latin America Market Value (USD Million) by End Use, 2025-2035
  • Figure 51: Latin America Market Value (USD Million) by Ingredient Type, 2025-2035
  • Figure 52: Latin America Market Value (USD Million) by Country, 2025-2035
  • Figure 53: Latin America Market Value (USD Million) Analysis by Country, 2020-2035
  • Figure 54: Latin America Market Volume (Units) Analysis by Country, 2020-2035
  • Figure 55: Latin America Market Value Share (%) and BPS Analysis by Country, 2025-2035
  • Figure 56: Latin America Market Y-o-Y Growth (%) Projections by Country, 2025-2035
  • Figure 57: Latin America Market Value (USD Million) Analysis by Function, 2020-2035
  • Figure 58: Latin America Market Volume (Units) Analysis by Function, 2020-2035
  • Figure 59: Latin America Market Value Share (%) and BPS Analysis by Function, 2025-2035
  • Figure 60: Latin America Market Y-o-Y Growth (%) Projections by Function, 2025-2035
  • Figure 61: Latin America Market Value (USD Million) Analysis by End Use, 2020-2035
  • Figure 62: Latin America Market Volume (Units) Analysis by End Use, 2020-2035
  • Figure 63: Latin America Market Value Share (%) and BPS Analysis by End Use, 2025-2035
  • Figure 64: Latin America Market Y-o-Y Growth (%) Projections by End Use, 2025-2035
  • Figure 65: Latin America Market Value (USD Million) Analysis by Ingredient Type, 2020-2035
  • Figure 66: Latin America Market Volume (Units) Analysis by Ingredient Type, 2020-2035
  • Figure 67: Latin America Market Value Share (%) and BPS Analysis by Ingredient Type, 2025-2035
  • Figure 68: Latin America Market Y-o-Y Growth (%) Projections by Ingredient Type, 2025-2035
  • Figure 69: Latin America Market Attractiveness by Function, 2025-2035
  • Figure 70: Latin America Market Attractiveness by End Use, 2025-2035
  • Figure 71: Latin America Market Attractiveness by Ingredient Type, 2025-2035
  • Figure 72: Latin America Market Attractiveness by Country, 2025-2035
  • Figure 73: Eastern Europe Market Value (USD Million) by Function, 2025-2035
  • Figure 74: Eastern Europe Market Value (USD Million) by End Use, 2025-2035
  • Figure 75: Eastern Europe Market Value (USD Million) by Ingredient Type, 2025-2035
  • Figure 76: Eastern Europe Market Value (USD Million) by Country, 2025-2035
  • Figure 77: Eastern Europe Market Value (USD Million) Analysis by Country, 2020-2035
  • Figure 78: Eastern Europe Market Volume (Units) Analysis by Country, 2020-2035
  • Figure 79: Eastern Europe Market Value Share (%) and BPS Analysis by Country, 2025-2035
  • Figure 80: Eastern Europe Market Y-o-Y Growth (%) Projections by Country, 2025-2035
  • Figure 81: Eastern Europe Market Value (USD Million) Analysis by Function, 2020-2035
  • Figure 82: Eastern Europe Market Volume (Units) Analysis by Function, 2020-2035
  • Figure 83: Eastern Europe Market Value Share (%) and BPS Analysis by Function, 2025-2035
  • Figure 84: Eastern Europe Market Y-o-Y Growth (%) Projections by Function, 2025-2035
  • Figure 85: Eastern Europe Market Value (USD Million) Analysis by End Use, 2020-2035
  • Figure 86: Eastern Europe Market Volume (Units) Analysis by End Use, 2020-2035
  • Figure 87: Eastern Europe Market Value Share (%) and BPS Analysis by End Use, 2025-2035
  • Figure 88: Eastern Europe Market Y-o-Y Growth (%) Projections by End Use, 2025-2035
  • Figure 89: Eastern Europe Market Value (USD Million) Analysis by Ingredient Type, 2020-2035
  • Figure 90: Eastern Europe Market Volume (Units) Analysis by Ingredient Type, 2020-2035
  • Figure 91: Eastern Europe Market Value Share (%) and BPS Analysis by Ingredient Type, 2025-2035
  • Figure 92: Eastern Europe Market Y-o-Y Growth (%) Projections by Ingredient Type, 2025-2035
  • Figure 93: Eastern Europe Market Attractiveness by Function, 2025-2035
  • Figure 94: Eastern Europe Market Attractiveness by End Use, 2025-2035
  • Figure 95: Eastern Europe Market Attractiveness by Ingredient Type, 2025-2035
  • Figure 96: Eastern Europe Market Attractiveness by Country, 2025-2035
  • Figure 97: Western Europe Market Value (USD Million) by Function, 2025-2035
  • Figure 98: Western Europe Market Value (USD Million) by End Use, 2025-2035
  • Figure 99: Western Europe Market Value (USD Million) by Ingredient Type, 2025-2035
  • Figure 100: Western Europe Market Value (USD Million) by Country, 2025-2035
  • Figure 101: Western Europe Market Value (USD Million) Analysis by Country, 2020-2035
  • Figure 102: Western Europe Market Volume (Units) Analysis by Country, 2020-2035
  • Figure 103: Western Europe Market Value Share (%) and BPS Analysis by Country, 2025-2035
  • Figure 104: Western Europe Market Y-o-Y Growth (%) Projections by Country, 2025-2035
  • Figure 105: Western Europe Market Value (USD Million) Analysis by Function, 2020-2035
  • Figure 106: Western Europe Market Volume (Units) Analysis by Function, 2020-2035
  • Figure 107: Western Europe Market Value Share (%) and BPS Analysis by Function, 2025-2035
  • Figure 108: Western Europe Market Y-o-Y Growth (%) Projections by Function, 2025-2035
  • Figure 109: Western Europe Market Value (USD Million) Analysis by End Use, 2020-2035
  • Figure 110: Western Europe Market Volume (Units) Analysis by End Use, 2020-2035
  • Figure 111: Western Europe Market Value Share (%) and BPS Analysis by End Use, 2025-2035
  • Figure 112: Western Europe Market Y-o-Y Growth (%) Projections by End Use, 2025-2035
  • Figure 113: Western Europe Market Value (USD Million) Analysis by Ingredient Type, 2020-2035
  • Figure 114: Western Europe Market Volume (Units) Analysis by Ingredient Type, 2020-2035
  • Figure 115: Western Europe Market Value Share (%) and BPS Analysis by Ingredient Type, 2025-2035
  • Figure 116: Western Europe Market Y-o-Y Growth (%) Projections by Ingredient Type, 2025-2035
  • Figure 117: Western Europe Market Attractiveness by Function, 2025-2035
  • Figure 118: Western Europe Market Attractiveness by End Use, 2025-2035
  • Figure 119: Western Europe Market Attractiveness by Ingredient Type, 2025-2035
  • Figure 120: Western Europe Market Attractiveness by Country, 2025-2035
  • Figure 121: South Asia & Pacific Market Value (USD Million) by Function, 2025-2035
  • Figure 122: South Asia & Pacific Market Value (USD Million) by End Use, 2025-2035
  • Figure 123: South Asia & Pacific Market Value (USD Million) by Ingredient Type, 2025-2035
  • Figure 124: South Asia & Pacific Market Value (USD Million) by Country, 2025-2035
  • Figure 125: South Asia & Pacific Market Value (USD Million) Analysis by Country, 2020-2035
  • Figure 126: South Asia & Pacific Market Volume (Units) Analysis by Country, 2020-2035
  • Figure 127: South Asia & Pacific Market Value Share (%) and BPS Analysis by Country, 2025-2035
  • Figure 128: South Asia & Pacific Market Y-o-Y Growth (%) Projections by Country, 2025-2035
  • Figure 129: South Asia & Pacific Market Value (USD Million) Analysis by Function, 2020-2035
  • Figure 130: South Asia & Pacific Market Volume (Units) Analysis by Function, 2020-2035
  • Figure 131: South Asia & Pacific Market Value Share (%) and BPS Analysis by Function, 2025-2035
  • Figure 132: South Asia & Pacific Market Y-o-Y Growth (%) Projections by Function, 2025-2035
  • Figure 133: South Asia & Pacific Market Value (USD Million) Analysis by End Use, 2020-2035
  • Figure 134: South Asia & Pacific Market Volume (Units) Analysis by End Use, 2020-2035
  • Figure 135: South Asia & Pacific Market Value Share (%) and BPS Analysis by End Use, 2025-2035
  • Figure 136: South Asia & Pacific Market Y-o-Y Growth (%) Projections by End Use, 2025-2035
  • Figure 137: South Asia & Pacific Market Value (USD Million) Analysis by Ingredient Type, 2020-2035
  • Figure 138: South Asia & Pacific Market Volume (Units) Analysis by Ingredient Type, 2020-2035
  • Figure 139: South Asia & Pacific Market Value Share (%) and BPS Analysis by Ingredient Type, 2025-2035
  • Figure 140: South Asia & Pacific Market Y-o-Y Growth (%) Projections by Ingredient Type, 2025-2035
  • Figure 141: South Asia & Pacific Market Attractiveness by Function, 2025-2035
  • Figure 142: South Asia & Pacific Market Attractiveness by End Use, 2025-2035
  • Figure 143: South Asia & Pacific Market Attractiveness by Ingredient Type, 2025-2035
  • Figure 144: South Asia & Pacific Market Attractiveness by Country, 2025-2035
  • Figure 145: East Asia Market Value (USD Million) by Function, 2025-2035
  • Figure 146: East Asia Market Value (USD Million) by End Use, 2025-2035
  • Figure 147: East Asia Market Value (USD Million) by Ingredient Type, 2025-2035
  • Figure 148: East Asia Market Value (USD Million) by Country, 2025-2035
  • Figure 149: East Asia Market Value (USD Million) Analysis by Country, 2020-2035
  • Figure 150: East Asia Market Volume (Units) Analysis by Country, 2020-2035
  • Figure 151: East Asia Market Value Share (%) and BPS Analysis by Country, 2025-2035
  • Figure 152: East Asia Market Y-o-Y Growth (%) Projections by Country, 2025-2035
  • Figure 153: East Asia Market Value (USD Million) Analysis by Function, 2020-2035
  • Figure 154: East Asia Market Volume (Units) Analysis by Function, 2020-2035
  • Figure 155: East Asia Market Value Share (%) and BPS Analysis by Function, 2025-2035
  • Figure 156: East Asia Market Y-o-Y Growth (%) Projections by Function, 2025-2035
  • Figure 157: East Asia Market Value (USD Million) Analysis by End Use, 2020-2035
  • Figure 158: East Asia Market Volume (Units) Analysis by End Use, 2020-2035
  • Figure 159: East Asia Market Value Share (%) and BPS Analysis by End Use, 2025-2035
  • Figure 160: East Asia Market Y-o-Y Growth (%) Projections by End Use, 2025-2035
  • Figure 161: East Asia Market Value (USD Million) Analysis by Ingredient Type, 2020-2035
  • Figure 162: East Asia Market Volume (Units) Analysis by Ingredient Type, 2020-2035
  • Figure 163: East Asia Market Value Share (%) and BPS Analysis by Ingredient Type, 2025-2035
  • Figure 164: East Asia Market Y-o-Y Growth (%) Projections by Ingredient Type, 2025-2035
  • Figure 165: East Asia Market Attractiveness by Function, 2025-2035
  • Figure 166: East Asia Market Attractiveness by End Use, 2025-2035
  • Figure 167: East Asia Market Attractiveness by Ingredient Type, 2025-2035
  • Figure 168: East Asia Market Attractiveness by Country, 2025-2035
  • Figure 169: Middle East & Africa Market Value (USD Million) by Function, 2025-2035
  • Figure 170: Middle East & Africa Market Value (USD Million) by End Use, 2025-2035
  • Figure 171: Middle East & Africa Market Value (USD Million) by Ingredient Type, 2025-2035
  • Figure 172: Middle East & Africa Market Value (USD Million) by Country, 2025-2035
  • Figure 173: Middle East & Africa Market Value (USD Million) Analysis by Country, 2020-2035
  • Figure 174: Middle East & Africa Market Volume (Units) Analysis by Country, 2020-2035
  • Figure 175: Middle East & Africa Market Value Share (%) and BPS Analysis by Country, 2025-2035
  • Figure 176: Middle East & Africa Market Y-o-Y Growth (%) Projections by Country, 2025-2035
  • Figure 177: Middle East & Africa Market Value (USD Million) Analysis by Function, 2020-2035
  • Figure 178: Middle East & Africa Market Volume (Units) Analysis by Function, 2020-2035
  • Figure 179: Middle East & Africa Market Value Share (%) and BPS Analysis by Function, 2025-2035
  • Figure 180: Middle East & Africa Market Y-o-Y Growth (%) Projections by Function, 2025-2035
  • Figure 181: Middle East & Africa Market Value (USD Million) Analysis by End Use, 2020-2035
  • Figure 182: Middle East & Africa Market Volume (Units) Analysis by End Use, 2020-2035
  • Figure 183: Middle East & Africa Market Value Share (%) and BPS Analysis by End Use, 2025-2035
  • Figure 184: Middle East & Africa Market Y-o-Y Growth (%) Projections by End Use, 2025-2035
  • Figure 185: Middle East & Africa Market Value (USD Million) Analysis by Ingredient Type, 2020-2035
  • Figure 186: Middle East & Africa Market Volume (Units) Analysis by Ingredient Type, 2020-2035
  • Figure 187: Middle East & Africa Market Value Share (%) and BPS Analysis by Ingredient Type, 2025-2035
  • Figure 188: Middle East & Africa Market Y-o-Y Growth (%) Projections by Ingredient Type, 2025-2035
  • Figure 189: Middle East & Africa Market Attractiveness by Function, 2025-2035
  • Figure 190: Middle East & Africa Market Attractiveness by End Use, 2025-2035
  • Figure 191: Middle East & Africa Market Attractiveness by Ingredient Type, 2025-2035
  • Figure 192: Middle East & Africa Market Attractiveness by Country, 2025-2035

Frequently Asked Questions

How big is the Bio-Fermented Skincare Actives Market in 2025?

The global Bio-Fermented Skincare Actives Market is estimated to be valued at USD 512.4 million in 2025.

What will be the size of the Bio-Fermented Skincare Actives Market in 2035?

The market size is projected to reach approximately USD 1,067.9 million by 2035.

How much will the Bio-Fermented Skincare Actives Market grow between 2025 and 2035?

The market is expected to grow at a compound annual growth rate (CAGR) of 7.6% during the 2025-2035 period.

What are the key ingredient types in the Bio-Fermented Skincare Actives Market?

The key ingredient types include Fermented Botanical Extracts, Fermented Marine Extracts, Fermented Probiotic Cultures, Yeast-Based Ferments, and Other Fermented Oils.

Which end-use segment will contribute significantly to the Bio-Fermented Skincare Actives Market in 2025?

In terms of end use, facial serums are expected to contribute the largest share of the market in 2025, driven by growing demand for high-performance, targeted skincare solutions.

Explore Similar Insights

Future Market Insights

Bio-Fermented Skincare Actives Market