Sea Buckthorn Actives Market Size and Share Forecast Outlook 2025 to 2035

The global Sea Buckthorn Actives Market is expected to reach a valuation of USD 1,152.3 million in 2025 and is projected to climb to USD 3,813.2 million by 2035. This represents an increase of more than 230 percent during the decade, translating into a compound annual growth rate (CAGR) of 12.7 percent. The upward trajectory demonstrates how natural bioactives are becoming central to health, wellness, and personal care innovation, especially in categories where efficacy and clean-label credentials are prioritized.
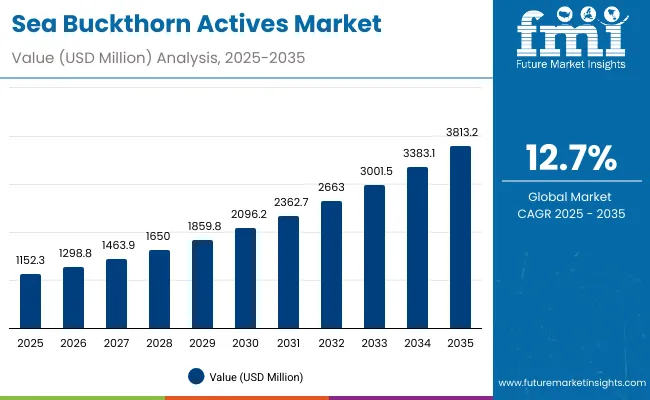
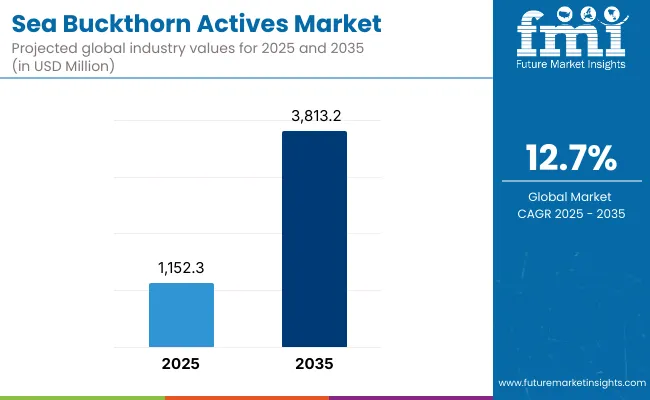
Sea Buckthorn Actives Market Value Analysis

Quick Stats for Sea Buckthorn Actives Market

  • Sea Buckthorn Actives Market Value (2025): USD 1,152.3 million
  • Sea Buckthorn Actives Market Forecast Value (2035): USD 3,813.2 million
  • Sea Buckthorn Actives Market Forecast CAGR (2025 to 2035): 12.7%
  • Leading Segment in 2025: Anti-aging function (52.5% share)
  • Key Growth Regions: Asia-Pacific, Europe, North America
  • Top Key Players: SeabuckWonders, Botanic Healthcare, BASF, DSM-Firmenich, Croda, Aromtech, Ashland, Flavex, Bionap, Greentech

Sea Buckthorn Actives Market

Sea Buckthorn Actives Market Key Takeaways

Metric Value
Sea Buckthorn Actives Market Estimated Value In (2025e) USD 1,152.3 million
Sea Buckthorn Actives Market Forecast Value In (2035f) USD 3,813.2 million
Forecast CAGR (2025 to 2035) 12.7%

From 2025 to 2030, the market is set to expand from USD 1,152.3 million to USD 2,096.2 million, contributing nearly USD 944 million of incremental value. This growth accounts for around 40 percent of the total expansion anticipated for the decade. Adoption during this phase will be driven by steady integration of seed and berry-derived extracts into premium nutraceutical and cosmetic formulations.

The anti-aging function is expected to lead, holding more than half of the overall market value, as demand strengthens for preventive and restorative solutions across developed and emerging markets.

The second half of the decade, covering 2030 to 2035, is anticipated to deliver stronger momentum, with values rising from USD 2,096.2 million to USD 3,813.2 million. This phase will contribute approximately USD 1,717 million, which equals nearly 60 percent of overall decade growth.

Expansion will be powered by advanced clinical validation, rising consumer trust, and deeper penetration across Asia-Pacific markets. By 2035, seed oil extracts and concentrated serum applications are likely to consolidate dominance, while sustainable sourcing and digital retail strategies will reinforce long-term growth.

Historic Context (2020 to 2024): The market expanded steadily, supported by growing consumer awareness of plant-based actives. Functional skincare and nutraceuticals were dominant demand drivers. Early adoption was led by niche players, while diversified ingredient suppliers began strengthening portfolios through partnerships and clinical substantiation efforts.

Forward-looking Shift: From 2025 onward, growth will be influenced by rising investments in clinically validated extracts, sustainability certifications, and enhanced delivery technologies. Competitive advantage is expected to move beyond raw ingredient supply toward integrated ecosystems combining efficacy, traceability, and digital-first consumer engagement.

Why the Sea Buckthorn Actives Market is growing?

The growth of the Sea Buckthorn Actives Market is being propelled by multiple structural drivers that reflect shifting consumer behavior and industry innovation. Rising demand for natural and plant-based ingredients has been observed, as awareness of clean-label formulations and holistic wellness gains momentum.

The strong antioxidant and omega-rich profile of sea buckthorn extracts has been increasingly validated by scientific studies, encouraging wider adoption in both nutraceutical and cosmetic applications. Anti-aging solutions have been prioritized by consumers, enabling seed and berry oils to capture significant traction within skincare regimes.

Expanding e-commerce and digital retail channels have further accelerated accessibility, allowing niche active ingredients to transition into mainstream portfolios. In addition, sustainability and traceability have been emphasized by regulators and brands, reinforcing consumer trust in responsibly sourced botanicals. Emerging markets in Asia-Pacific are showing heightened adoption as preventive healthcare and premium beauty segments scale up. This multifactor synergy is expected to sustain long-term growth momentum.

Segmental Analysis

The Sea Buckthorn Actives Market has been segmented to capture the diverse applications and functional roles of these natural ingredients. The segmentation covers three major dimensions: function, product type, and extract source. Each dimension reflects how market value is being distributed across consumer preferences, product positioning, and raw material utilization.

Functional segmentation highlights the role of anti-aging and related wellness benefits, which dominate as primary drivers of demand. Product type segmentation shows how finished formats are aligned with consumer convenience and premiumization strategies.

Extract segmentation underlines the importance of raw material composition, where seed oils, berry oils, and leaf extracts are differentiated by bioactive potency. Together, these segments provide a holistic understanding of the market structure and the competitive opportunities emerging within it. Future growth will be dictated by how effectively companies position their offerings across these three interlinked categories.
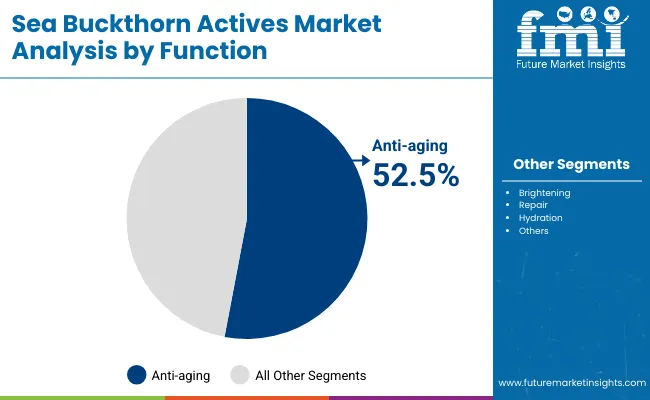
Insights into the Function Segment with Anti-aging Leading in Market Share

Sea Buckthorn Actives Market By Function

Segment Market Value Share, 2025
Anti-aging 52.5%
Others 47.5%

The function segment is expected to be led by anti-aging, which accounts for 52.5% of the market in 2025, equivalent to USD 604 million. Growth in this segment is being driven by the rising prioritization of preventive skincare solutions among aging populations as well as younger consumers focused on early skin health maintenance. Increasing scientific validation of sea buckthorn’s antioxidant and omega-rich profile has positioned it strongly within anti-aging formulations, as it supports wrinkle reduction, skin elasticity, and barrier repair.

Market players are expected to emphasize clinical trials and scientific endorsements to reinforce credibility and premium positioning. While hydration, brightening, and repair functions contribute to the remaining share, anti-aging is projected to remain the anchor of long-term demand due to its cross-generational appeal and higher price realization potential in skincare and nutraceutical applications.
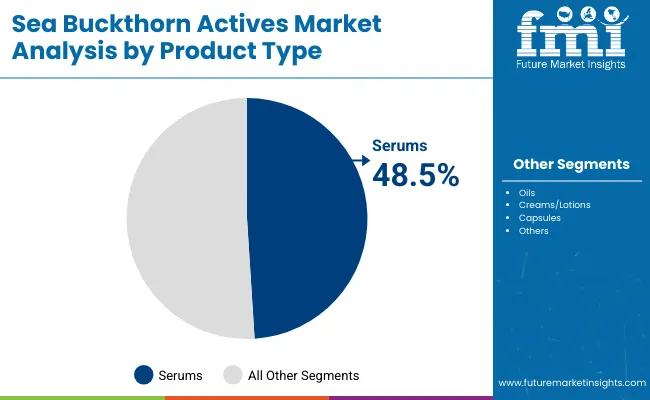
Insights into the Product Type Segment with Serums Gaining Traction

Sea Buckthorn Actives Market Product Type

Segment Market Value Share, 2025
Serums 48.5%
Others 51.5%

The product type segment demonstrates significant traction for serums, holding 48.5% of the market in 2025, equivalent to USD 557.6 million. Serums are being adopted widely due to their concentrated formulations, high penetration ability, and clinical appeal in skincare regimes. Sea buckthorn actives, when delivered through serums, allow precise dosing of antioxidants, fatty acids, and vitamins, which enhances consumer trust in efficacy claims.

Growth of this segment is also being supported by premiumization trends and consumer willingness to pay more for visible results. Digital retail platforms and influencer-driven campaigns are expected to further elevate serum adoption across both developed and emerging markets. While creams, lotions, and capsules continue to play complementary roles, serums are projected to capture enduring relevance as consumers increasingly seek high-performance, evidence-backed products in their skincare and wellness routines.
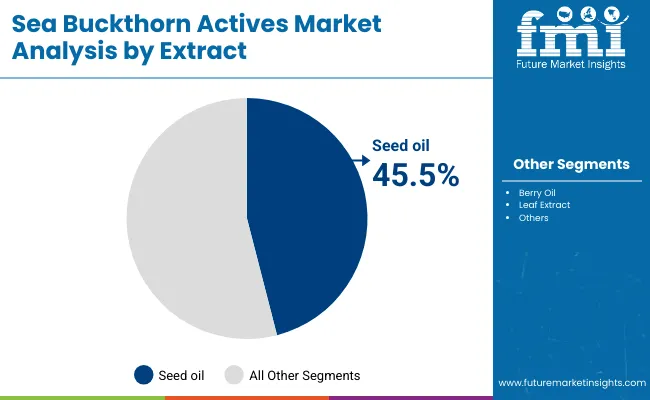
Insights into the Extract Segment with Seed Oil Consolidating Demand

Sea Buckthorn Actives Market By Extract

Segment Market Value Share, 2025
Seed oil 45.5%
Others 54.5%

The extract segment is led by seed oil, holding 45.5% share in 2025, equivalent to USD 523.2 million. Seed oil is preferred due to its superior concentration of omega fatty acids, tocopherols, and antioxidants that deliver strong anti-aging, hydration, and repair benefits. Clinical validation has supported its use in both topical and ingestible applications, reinforcing trust among formulators and consumers alike.

Market growth in this segment is being supported by increasing product launches centered on seed oil as a hero ingredient, often positioned as sustainable and ethically sourced. The ability of seed oil to integrate across cosmetic, nutraceutical, and pharmaceutical formulations ensures its long-term significance. While berry and leaf extracts complement market diversity, seed oil is expected to remain the anchor extract, offering premium positioning opportunities and higher margins for manufacturers investing in quality sourcing and advanced extraction processes.

What are the Drivers, Restraints, and Key Trends of the Sea Buckthorn Actives Market?

High formulation costs and stringent standardization requirements are creating operational barriers, even as sea buckthorn actives are being positioned at the forefront of nutraceutical and skincare innovation for clinically validated, multifunctional, and sustainability-driven solutions.

Scientific Validation and Clinical Endorsements

Market expansion is being accelerated by the growing clinical evidence supporting the efficacy of sea buckthorn actives. Peer-reviewed studies have validated bioactive compounds for their role in skin barrier repair, inflammation control, and anti-aging outcomes. This scientific substantiation is enhancing trust among regulators, healthcare practitioners, and consumers, strengthening the case for premium pricing and wide-scale adoption.

Pharmaceutical and nutraceutical industries are expected to increase investments in controlled trials, enabling sea buckthorn to move from a “natural supplement” perception toward a recognized evidence-backed functional active. Such endorsements are projected to reinforce consumer confidence and institutional acceptance, establishing clinical credibility as a key differentiator.

Supply Chain Volatility and Sourcing Constraints

The industry faces structural challenges linked to raw material availability and quality variability. Climatic unpredictability, limited cultivation zones, and seasonal harvesting cycles are constraining consistent supply of standardized extracts. These factors have been raising procurement costs and affecting batch-to-batch uniformity in formulations. Quality inconsistencies have posed regulatory risks, particularly in highly regulated regions where standardized composition is mandatory for approval.

Companies without vertically integrated sourcing strategies or long-term grower partnerships are projected to remain vulnerable to cost spikes and adulteration risks. Addressing these constraints will require investment in cultivation technologies, supply traceability systems, and sustainable harvesting practices to safeguard both quality and long-term scalability.
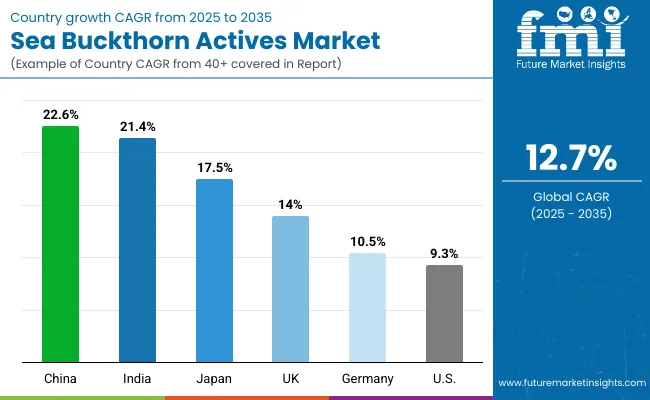
Analysis of Sea Buckthorn Actives Market By Key Countries

Sea Buckthorn Actives Market Country Wise Analysis

Country CAGR
China 22.6%
USA 9.3%
India 21.4%
UK 14.0%
Germany 10.5%
Japan 17.5%

The Sea Buckthorn Actives Market demonstrates clear disparities in growth momentum across major countries, shaped by differences in consumer demand patterns, regulatory alignment, and industrial application depth. Asia-Pacific is projected to lead the expansion, with China registering a CAGR of 22.6% and India closely following at 21.4% during 2025 to 2035.

This rapid scale-up is expected to be underpinned by strong nutraceutical adoption, government-backed initiatives in herbal medicine, and rapidly evolving e-commerce ecosystems that enhance consumer reach. Japan, with a CAGR of 17.5%, is forecasted to consolidate demand through high product innovation and functional skincare uptake in its mature cosmetics sector.

Europe maintains a robust trajectory, though at a relatively moderate pace. The UK is set to grow at 14.0% CAGR, reflecting continued emphasis on clean-label and sustainable cosmetic ingredients. Germany, with a CAGR of 10.5%, is expected to remain an innovation hub, supported by stringent quality standards and established nutraceutical markets. North America is forecasted to display steady yet comparatively slower growth, with the USA recording a CAGR of 9.3%.

Market maturity, coupled with high regulatory scrutiny, is projected to moderate expansion; however, opportunities remain in premium anti-aging and clinical skincare formulations. Collectively, these dynamics underline how regional strategies must be tailored to capture the fastest-growing opportunities while addressing market-specific regulatory and consumer behavior challenges.
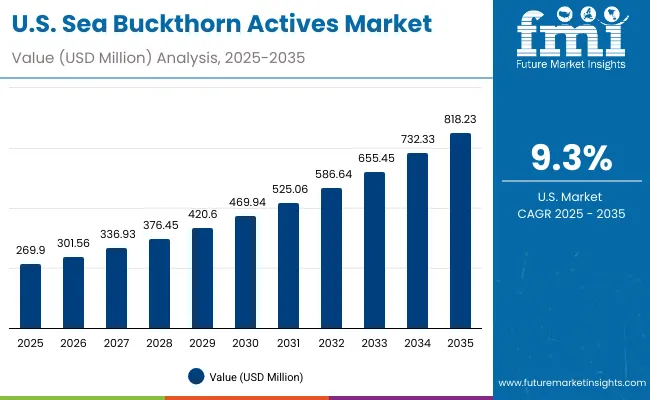
Sales Outlook for Sea Buckthorn Actives in the United States

Usa Sea Buckthorn Actives Market

Year USA Berberine Market (USD Million)
2025 269.90
2026 301.56
2027 336.93
2028 376.45
2029 420.60
2030 469.94
2031 525.06
2032 586.64
2033 655.45
2034 732.33
2035 818.23

The Sea Buckthorn Actives Market in the United States is projected to grow at a CAGR of 11.5% from 2025 to 2035, advancing from USD 269.9 million in 2025 to USD 818.2 million by 2035. This steady progression reflects increasing consumer trust in clinically validated natural actives and strong momentum in premium wellness and skincare applications.

Demand is expected to be shaped by anti-aging formulations, which continue to dominate premium skincare lines, while nutraceutical adoption of seed and berry oils is anticipated to strengthen preventive health portfolios. E-commerce expansion and cross-category innovation are forecasted to reinforce long-term growth.

  • Anti-aging formulations in cosmetics are being positioned as the primary growth driver across USA markets.
  • Nutraceutical applications are projected to gain wider adoption, especially in preventive wellness and immunity-boosting supplements.

Growth and Expansion Outlook for Sea Buckthorn Actives Market in the United Kingdom

The Sea Buckthorn Actives Market in the UK is projected to expand at a CAGR of 14.0% during 2025 to 2035, supported by increasing adoption of clean-label beauty and wellness products. Growth will be underpinned by consumer preference for sustainable and naturally derived ingredients aligned with ethical sourcing standards.

Anti-aging and hydration-focused formulations are expected to dominate, reflecting strong demand in premium skincare and nutraceutical channels. Regulatory frameworks that emphasize safety, efficacy, and sustainable sourcing are anticipated to create opportunities for differentiated positioning. E-commerce platforms are forecasted to play a central role in distribution, particularly for niche and premium brands.

  • CAGR of 14.0% reflects stable yet competitive growth momentum.
  • Anti-aging and hydration remain core functional categories driving uptake.
  • Clean-label and sustainability certification will reinforce brand credibility.
  • E-commerce platforms are expected to accelerate niche ingredient adoption.

Growth and Expansion Outlook for Sea Buckthorn Actives Market in India

The Sea Buckthorn Actives Market in India is projected to grow at a CAGR of 21.4% from 2025 to 2035, making it one of the fastest-growing markets globally. This momentum will be driven by rapid urbanization, rising income levels, and growing awareness of natural supplements and skincare.

The nutraceutical sector is expected to adopt sea buckthorn actives in immunity, metabolic health, and cardiovascular formulations, while personal care is projected to integrate seed and berry oils into premium herbal skincare lines. Digital commerce platforms and direct-to-consumer models are expected to boost penetration, particularly in tier-two and tier-three cities. Government support for Ayurvedic and herbal product development is also anticipated to strengthen adoption.
  • CAGR of 21.4% positions India among the top global growth markets.
  • Nutraceutical applications for immunity and metabolism will gain traction.
  • Herbal and Ayurvedic alignment will enhance consumer trust.
  • E-commerce growth will enable wider geographic penetration.
  • Sales Outlook for Sea Buckthorn Actives in China

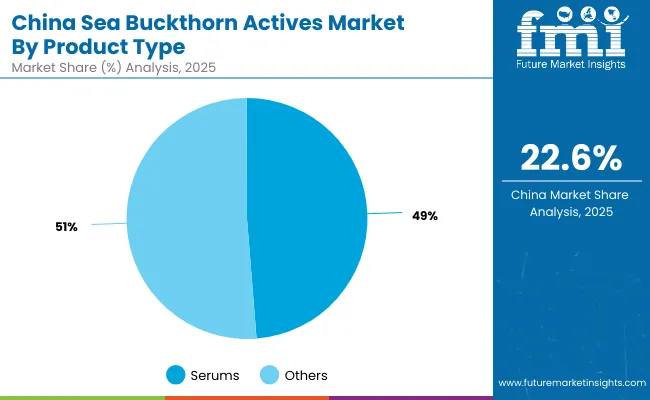
Growth and Expansion Outlook for Sea Buckthorn Actives Market in China

China Sea Buckthorn Actives Market By Product Type

The Sea Buckthorn Actives Market in China is forecasted to grow at a CAGR of 22.6% between 2025 and 2035, the highest among leading countries. Demand will be supported by strong government backing for herbal medicine, rapid expansion of the functional food industry, and widespread consumer acceptance of plant-based actives.

Skincare formulations with anti-aging and brightening claims are expected to dominate, reinforced by premiumization and rising beauty-conscious consumer bases. E-commerce ecosystems and cross-border trade platforms are projected to drive visibility and accessibility, enabling both domestic and international brands to scale rapidly. Standardization and certification practices will be critical to build trust and mitigate concerns regarding authenticity.
  • CAGR of 22.6% makes China the fastest-growing market globally.
  • Anti-aging and brightening skincare claims will anchor demand.
  • Government support for herbal medicine enhances legitimacy.
  • E-commerce and cross-border trade will fuel scale-up opportunities.

In-depth Analysis of Sea Buckthorn Actives in Germany

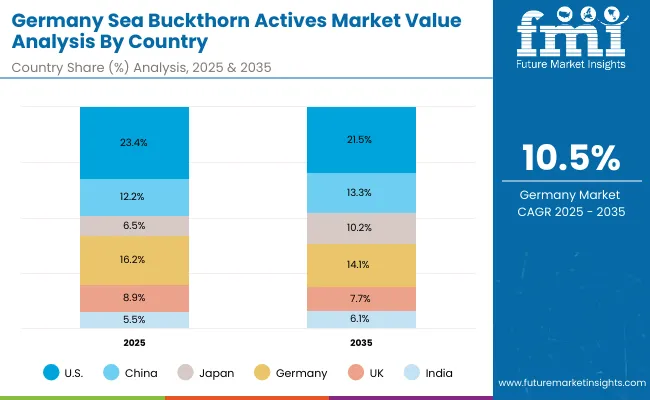
Germany Sea Buckthorn Actives Market

Countries 2025
USA 23.4%
China 12.2%
Japan 6.5%
Germany 16.2%
UK 8.9%
India 5.5%
Countries 2035
USA 21.5%
China 13.3%
Japan 10.2%
Germany 14.1%
UK 7.7%
India 6.1%

The Sea Buckthorn Actives Market in Germany is expected to grow at a CAGR of 10.5% from 2025 to 2035, reflecting steady but moderate growth compared to Asia-Pacific counterparts. Strong consumer focus on efficacy, safety, and certified natural ingredients will sustain demand in both nutraceutical and cosmetics sectors. Anti-aging and skin-repair benefits are projected to be primary drivers, particularly within dermocosmetics and pharmacy-led retail channels.

Regulatory oversight and quality standards will create entry barriers but also strengthen consumer trust in established players. Sustainability narratives and eco-certifications are anticipated to resonate strongly with German consumers, shaping long-term positioning strategies for ingredient suppliers and brands.

  • CAGR of 10.5% indicates stable, regulation-driven growth.
  • Dermocosmetics and pharmacy-based retail will lead adoption.
  • Strong emphasis on certification and traceability will shape trust.
  • Sustainability-led positioning will enhance competitive advantage.

Growth Outlook for Sea Buckthorn Actives Market in Japan

Segment Market Value Share, 2025
Serums 49.90%
Others 50.10%

The Sea Buckthorn Actives Market in Japan is projected at USD 74.9 million in 2025, with growth anticipated at a CAGR of 17.5% through 2035. Functional skincare benefits such as anti-aging, hydration, and brightening are expected to anchor demand, supported by Japan’s established reputation for innovation in beauty and personal care. Strong consumer focus on safety, quality, and clinically validated natural actives is likely to accelerate adoption across dermocosmetics and premium skincare categories.

Market segmentation suggests that serum-based formats will gain traction, reflecting consumer preference for concentrated and high-efficacy products. Seed oil extracts are anticipated to lead due to their omega-rich and antioxidant profile, reinforcing value across both skincare and nutraceutical applications. Digital retail platforms and the prominence of cosmeceuticals in Japan are projected to further amplify market reach.

  • Market in Japan is estimated at USD 74.9 million in 2025, representing 6.5% of global share.
  • CAGR of 17.5% highlights one of the strongest growth trajectories globally.
  • Serums and seed oil extracts are positioned to consolidate leadership.
  • Growth will be reinforced by innovation in dermocosmetics and cosmeceuticals.

Opportunity Analysis of South Korea Sea Buckthorn Actives Market

Segment Market Value Share, 2025
Serums 49.90%
Others 50.10%

The Sea Buckthorn Actives Market in South Korea is estimated at USD 63.4 million in 2025 and is projected to advance at a CAGR of 16.0% through 2035. Skincare innovation and consumer preference for natural, multifunctional actives are expected to drive growth, as South Korea continues to influence global beauty and wellness trends. The rising popularity of K-beauty formulations, with emphasis on hydration, brightening, and anti-aging benefits, is anticipated to strengthen demand for sea buckthorn extracts.

Serum-based formats are forecasted to dominate, as consumers prioritize high-efficacy, lightweight solutions within their routines. Seed oil is projected to secure increasing adoption due to its clinically validated antioxidant and omega-rich composition. Digital retail ecosystems, coupled with influencer-led marketing, are expected to accelerate awareness and adoption across domestic and international audiences.
  • Market in South Korea is valued at USD 63.4 million in 2025, accounting for 5.5% of global share.
  • CAGR of 16.0% underscores strong potential within Asia-Pacific markets.
  • Serum-based applications are positioned to dominate functional skincare.
  • Growth will be reinforced by K-beauty innovation and global consumer adoption

Competitive Landscape of Sea Buckthorn Actives Market

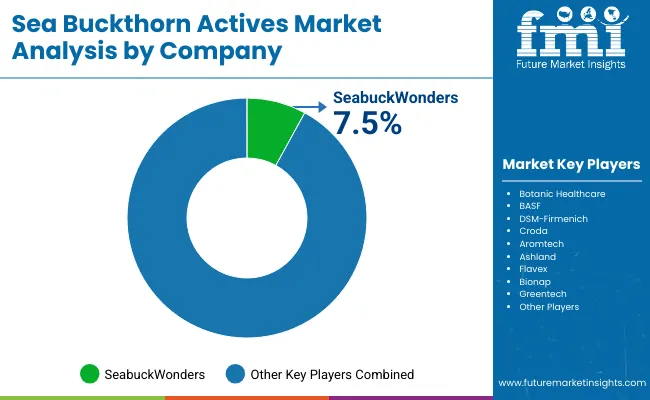
Sea Buckthorn Actives Market By Company

Companies Global Value Share 2025
SeabuckWonders 7.50%
Others 92.50%

The Sea Buckthorn Actives Market is moderately fragmented, with specialist brands, botanical extractors, and diversified ingredient majors competing across skincare and nutraceutical use-cases. Scale, standardized potency (omega-7/palmitoleic acid, tocopherols, polyphenols), and solvent-efficient extraction are being used to secure premium positions.

Evidence-led claims are being strengthened through in-vivo endpoints (elasticity, TEWL, wrinkle depth) and stability controls (oxidation management, encapsulation). Vertical grower partnerships and traceable sourcing are being expanded to de-risk harvest variability and support certification.

Pricing power is expected to accrue to suppliers that pair COA transparency with clinically reviewed dossiers and deliver plug-and-play compliance for dermocosmetic and supplement launches. Digital D2C and derm-retail channels are being leveraged by brands, while B2B leaders are focusing on co-development with formulators and pharma-adjacent nutraceutical players. Competitive differentiation is shifting from commodity oils toward protected standardization, delivery systems, and sustainability reporting.

Companies checked for relevance: SeabuckWonders (specialist brand), Botanic Healthcare (botanical extracts), BASF, DSM-Firmenich, Croda, Ashland (diversified actives suppliers), Aromtech and Flavex (CO₂ extraction specialists), Bionap and Greentech (botanical actives). All are relevant to sea buckthorn actives or adjacent botanicals.

  • Leader and share: the market leader is Seabuck Wonders with a 7.5% global value share in 2025 (dataset).
  • The 2024 leader share is estimated at ~7.3% (back-cast from 2025, assuming minimal mix change).

Key Developments in Sea Buckthorn Actives Market

  • In May 2025, sea buckthorn leaves were highlighted in Personal Care Magazine for containing more diverse phytochemicals (polyphenols, triterpenes, sterols, tocopherols) than berries-driving new R&D directions in antiviral, antiinflammatory, and antioxidant extracts for skincare innovation. This recognition is expected to accelerate leafbased ingredient development.
  • In July 2025, DailyBeautyCares.com reported that “superfood” sea buckthorn leaves-with antiviral, antibacterial, antiinflammatory, and antioxidant effects-were gaining popularity in skincare formulations. This shift is being viewed as a new frontier beyond berry oil, paving the way for leafderivative actives to be standardized and premiumized.

Scope of the Report

Item Value
Quantitative units USD million
Market size, 2025 1,152.30
Market size, 2035 3,813.20
Growth metric 12.7% CAGR (2025 to 2035)
Study scope Global Sea Buckthorn Actives Market (seed, berry, leaf-derived actives for skincare and nutraceuticals)
Segmentation - function (2025 share) Anti-aging 52.5% (USD 604.0 million); Others 47.5% (USD 547.05 million)
Segmentation - product type (2025 share) Serums 48.5% (USD 557.6 million); Others 51.5% (USD 593.61 million)
Segmentation - extract (2025 share) Seed oil 45.5% (USD 523.2 million); Others 54.5% (USD 628.53 million)
Regions covered North America, Europe, Asia-Pacific, Latin America, Middle East & Africa
Key countries covered (CAGR 2025 to 2035) China 22.6%; India 21.4%; Japan 17.5%; UK 14.0%; Germany 10.5%; USA 9.3%
Example country trajectory (USA) USD 269.9 million in 2025 → USD 818.2 million in 2035
Competitive landscape Fragmented; SeabuckWonders 7.5% global share (2025); remaining 92.5% dispersed across numerous suppliers
Key companies profiled SeabuckWonders; Botanic Healthcare; BASF; DSM-Firmenich; Croda; Aromtech; Ashland; Flavex; Bionap; Greentech
Additional attributes Evidence-backed claims, COA standardization, oxidation management/encapsulation, sustainability certifications (e.g., COSMOS), farm-to-extract traceability, e-commerce/D2C scaling, Asia-led acceleration, dermocosmetic co-development, and risk management for harvest variability and adulteration

Key Segments

By Extract:

  • Seed oil
  • Berry oil
  • Leaf extract

By Function:

  • Anti-aging
  • Brightening
  • Repair
  • Hydration

By Product Type:

  • Serums
  • Oils
  • Creams/lotions
  • Capsules

By Channel:

  • Natural/organic stores
  • E-commerce
  • Pharmacies
  • Specialty retail

By Region:

  • North America
  • Latin America
  • Europe
  • East Asia
  • South Asia & Pacific
  • Middle East and Africa

Table of Content

  1. Executive Summary
    • Global Market Outlook
    • Demand-side Trends
    • Supply-side Trends
    • Technology Roadmap Analysis
    • Analysis and Recommendations
  2. Market Overview
    • Market Coverage / Taxonomy
    • Market Definition / Scope / Limitations
  3. Market Background
    • Market Dynamics
      • Drivers
      • Restraints
      • Opportunity
      • Trends
    • Scenario Forecast
      • Demand in Optimistic Scenario
      • Demand in Likely Scenario
      • Demand in Conservative Scenario
    • Opportunity Map Analysis
    • Product Life Cycle Analysis
    • Supply Chain Analysis
      • Supply Side Participants and their Roles
        • Producers
        • Mid-Level Participants (Traders/ Agents/ Brokers)
        • Wholesalers and Distributors
      • Value Added and Value Created at Node in the Supply Chain
      • List of Raw Material Suppliers
      • List of Existing and Potential Buyer’s
    • Investment Feasibility Matrix
    • Value Chain Analysis
      • Profit Margin Analysis
      • Wholesalers and Distributors
      • Retailers
    • PESTLE and Porter’s Analysis
    • Regulatory Landscape
      • By Key Regions
      • By Key Countries
    • Regional Parent Market Outlook
    • Production and Consumption Statistics
    • Import and Export Statistics
  4. Global Market Analysis 2020 to 2024 and Forecast, 2025 to 2035
    • Historical Market Size Value (USD Million) & Volume (Units) Analysis, 2020 to 2024
    • Current and Future Market Size Value (USD Million) & Volume (Units) Projections, 2025 to 2035
      • Y-o-Y Growth Trend Analysis
      • Absolute $ Opportunity Analysis
  5. Global Market Analysis 2020 to 2024 and Forecast 2025 to 2035, By Extract
    • Introduction / Key Findings
    • Historical Market Size Value (USD Million) & Volume (Units) Analysis By Extract, 2020 to 2024
    • Current and Future Market Size Value (USD Million) & Volume (Units) Analysis and Forecast By Extract, 2025 to 2035
      • Seed oil
      • Berry oil
      • Leaf extract
    • Y-o-Y Growth Trend Analysis By Extract, 2020 to 2024
    • Absolute $ Opportunity Analysis By Extract, 2025 to 2035
  6. Global Market Analysis 2020 to 2024 and Forecast 2025 to 2035, By Function
    • Introduction / Key Findings
    • Historical Market Size Value (USD Million) & Volume (Units) Analysis By Function, 2020 to 2024
    • Current and Future Market Size Value (USD Million) & Volume (Units) Analysis and Forecast By Function, 2025 to 2035
      • Anti-aging
      • Brightening
      • Repair
      • Hydration
    • Y-o-Y Growth Trend Analysis By Function, 2020 to 2024
    • Absolute $ Opportunity Analysis By Function, 2025 to 2035
  7. Global Market Analysis 2020 to 2024 and Forecast 2025 to 2035, By Product Type
    • Introduction / Key Findings
    • Historical Market Size Value (USD Million) & Volume (Units) Analysis By Product Type, 2020 to 2024
    • Current and Future Market Size Value (USD Million) & Volume (Units) Analysis and Forecast By Product Type, 2025 to 2035
      • Serums
      • Oils
      • Creams/lotions
      • Capsules
    • Y-o-Y Growth Trend Analysis By Product Type, 2020 to 2024
    • Absolute $ Opportunity Analysis By Product Type, 2025 to 2035
  8. Global Market Analysis 2020 to 2024 and Forecast 2025 to 2035, By Channel
    • Introduction / Key Findings
    • Historical Market Size Value (USD Million) & Volume (Units) Analysis By Channel, 2020 to 2024
    • Current and Future Market Size Value (USD Million) & Volume (Units) Analysis and Forecast By Channel, 2025 to 2035
      • Natural/organic stores
      • E-commerce
      • Pharmacies
      • Specialty retail
    • Y-o-Y Growth Trend Analysis By Channel, 2020 to 2024
    • Absolute $ Opportunity Analysis By Channel, 2025 to 2035
  9. Global Market Analysis 2020 to 2024 and Forecast 2025 to 2035, By Region
    • Introduction
    • Historical Market Size Value (USD Million) & Volume (Units) Analysis By Region, 2020 to 2024
    • Current Market Size Value (USD Million) & Volume (Units) Analysis and Forecast By Region, 2025 to 2035
      • North America
      • Latin America
      • Europe
      • East Asia
      • South Asia & Pacific
      • Middle East and Africa
    • Market Attractiveness Analysis By Region
  10. North America Market Analysis 2020 to 2024 and Forecast 2025 to 2035, By Country
    • Historical Market Size Value (USD Million) & Volume (Units) Trend Analysis By Market Taxonomy, 2020 to 2024
    • Market Size Value (USD Million) & Volume (Units) Forecast By Market Taxonomy, 2025 to 2035
      • By Country
        • USA
        • Canada
      • By Extract
      • By Function
      • By Product Type
      • By Channel
    • Market Attractiveness Analysis
      • By Country
      • By Extract
      • By Function
      • By Product Type
      • By Channel
    • Key Takeaways
  11. Latin America Market Analysis 2020 to 2024 and Forecast 2025 to 2035, By Country
    • Historical Market Size Value (USD Million) & Volume (Units) Trend Analysis By Market Taxonomy, 2020 to 2024
    • Market Size Value (USD Million) & Volume (Units) Forecast By Market Taxonomy, 2025 to 2035
      • By Country
        • Brazil
        • Mexico
        • Colombia
        • Rest of Latin America
      • By Extract
      • By Function
      • By Product Type
      • By Channel
    • Market Attractiveness Analysis
      • By Country
      • By Extract
      • By Function
      • By Product Type
      • By Channel
    • Key Takeaways
  12. Europe Market Analysis 2020 to 2024 and Forecast 2025 to 2035, By Country
    • Historical Market Size Value (USD Million) & Volume (Units) Trend Analysis By Market Taxonomy, 2020 to 2024
    • Market Size Value (USD Million) & Volume (Units) Forecast By Market Taxonomy, 2025 to 2035
      • By Country
        • Germany
        • UK
        • France
        • Italy
        • Spain
        • Belgium
        • Netherlands
        • Nordic
        • Switzerland
        • Russia
        • Poland
        • Rest of Europe
      • By Extract
      • By Function
      • By Product Type
      • By Channel
    • Market Attractiveness Analysis
      • By Country
      • By Extract
      • By Function
      • By Product Type
      • By Channel
    • Key Takeaways
  13. East Asia Market Analysis 2020 to 2024 and Forecast 2025 to 2035, By Country
    • Historical Market Size Value (USD Million) & Volume (Units) Trend Analysis By Market Taxonomy, 2020 to 2024
    • Market Size Value (USD Million) & Volume (Units) Forecast By Market Taxonomy, 2025 to 2035
      • By Country
        • China
        • Japan
        • South Korea
      • By Extract
      • By Function
      • By Product Type
      • By Channel
    • Market Attractiveness Analysis
      • By Country
      • By Extract
      • By Function
      • By Product Type
      • By Channel
    • Key Takeaways
  14. South Asia & Pacific Market Analysis 2020 to 2024 and Forecast 2025 to 2035, By Country
    • Historical Market Size Value (USD Million) & Volume (Units) Trend Analysis By Market Taxonomy, 2020 to 2024
    • Market Size Value (USD Million) & Volume (Units) Forecast By Market Taxonomy, 2025 to 2035
      • By Country
        • India
        • Thailand
        • Malaysia
        • Indonesia
        • Singapore
        • Vietnam
        • Australia
        • New Zealand
        • Rest of South Asia
      • By Extract
      • By Function
      • By Product Type
      • By Channel
    • Market Attractiveness Analysis
      • By Country
      • By Extract
      • By Function
      • By Product Type
      • By Channel
    • Key Takeaways
  15. Middle East and Africa Market Analysis 2020 to 2024 and Forecast 2025 to 2035, By Country
    • Historical Market Size Value (USD Million) & Volume (Units) Trend Analysis By Market Taxonomy, 2020 to 2024
    • Market Size Value (USD Million) & Volume (Units) Forecast By Market Taxonomy, 2025 to 2035
      • By Country
        • Turkey
        • UAE
        • Saudi Arabia
        • Israel
        • Other GCC Countries
        • North Africa
        • South Africa
      • By Extract
      • By Function
      • By Product Type
      • By Channel
    • Market Attractiveness Analysis
      • By Country
      • By Extract
      • By Function
      • By Product Type
      • By Channel
    • Key Takeaways
  16. Key Countries Market Analysis
    • USA
      • Pricing Analysis
      • Market Share Analysis, 2024
        • By Extract
        • By Function
        • By Product Type
        • By Channel
    • Canada
      • Pricing Analysis
      • Market Share Analysis, 2024
        • By Extract
        • By Function
        • By Product Type
        • By Channel
    • Brazil
      • Pricing Analysis
      • Market Share Analysis, 2024
        • By Extract
        • By Function
        • By Product Type
        • By Channel
    • Mexico
      • Pricing Analysis
      • Market Share Analysis, 2024
        • By Extract
        • By Function
        • By Product Type
        • By Channel
    • Colombia
      • Pricing Analysis
      • Market Share Analysis, 2024
        • By Extract
        • By Function
        • By Product Type
        • By Channel
    • Germany
      • Pricing Analysis
      • Market Share Analysis, 2024
        • By Extract
        • By Function
        • By Product Type
        • By Channel
    • UK
      • Pricing Analysis
      • Market Share Analysis, 2024
        • By Extract
        • By Function
        • By Product Type
        • By Channel
    • France
      • Pricing Analysis
      • Market Share Analysis, 2024
        • By Extract
        • By Function
        • By Product Type
        • By Channel
    • Italy
      • Pricing Analysis
      • Market Share Analysis, 2024
        • By Extract
        • By Function
        • By Product Type
        • By Channel
    • Spain
      • Pricing Analysis
      • Market Share Analysis, 2024
        • By Extract
        • By Function
        • By Product Type
        • By Channel
    • Belgium
      • Pricing Analysis
      • Market Share Analysis, 2024
        • By Extract
        • By Function
        • By Product Type
        • By Channel
    • Netherlands
      • Pricing Analysis
      • Market Share Analysis, 2024
        • By Extract
        • By Function
        • By Product Type
        • By Channel
    • Nordic
      • Pricing Analysis
      • Market Share Analysis, 2024
        • By Extract
        • By Function
        • By Product Type
        • By Channel
    • Switzerland
      • Pricing Analysis
      • Market Share Analysis, 2024
        • By Extract
        • By Function
        • By Product Type
        • By Channel
    • Russia
      • Pricing Analysis
      • Market Share Analysis, 2024
        • By Extract
        • By Function
        • By Product Type
        • By Channel
    • Poland
      • Pricing Analysis
      • Market Share Analysis, 2024
        • By Extract
        • By Function
        • By Product Type
        • By Channel
    • China
      • Pricing Analysis
      • Market Share Analysis, 2024
        • By Extract
        • By Function
        • By Product Type
        • By Channel
    • Japan
      • Pricing Analysis
      • Market Share Analysis, 2024
        • By Extract
        • By Function
        • By Product Type
        • By Channel
    • South Korea
      • Pricing Analysis
      • Market Share Analysis, 2024
        • By Extract
        • By Function
        • By Product Type
        • By Channel
    • India
      • Pricing Analysis
      • Market Share Analysis, 2024
        • By Extract
        • By Function
        • By Product Type
        • By Channel
    • Thailand
      • Pricing Analysis
      • Market Share Analysis, 2024
        • By Extract
        • By Function
        • By Product Type
        • By Channel
    • Indonesia
      • Pricing Analysis
      • Market Share Analysis, 2024
        • By Extract
        • By Function
        • By Product Type
        • By Channel
    • Australia
      • Pricing Analysis
      • Market Share Analysis, 2024
        • By Extract
        • By Function
        • By Product Type
        • By Channel
    • New Zealand
      • Pricing Analysis
      • Market Share Analysis, 2024
        • By Extract
        • By Function
        • By Product Type
        • By Channel
    • Turkey
      • Pricing Analysis
      • Market Share Analysis, 2024
        • By Extract
        • By Function
        • By Product Type
        • By Channel
    • UAE
      • Pricing Analysis
      • Market Share Analysis, 2024
        • By Extract
        • By Function
        • By Product Type
        • By Channel
    • Saudi Arabia
      • Pricing Analysis
      • Market Share Analysis, 2024
        • By Extract
        • By Function
        • By Product Type
        • By Channel
    • Israel
      • Pricing Analysis
      • Market Share Analysis, 2024
        • By Extract
        • By Function
        • By Product Type
        • By Channel
    • North Africa
      • Pricing Analysis
      • Market Share Analysis, 2024
        • By Extract
        • By Function
        • By Product Type
        • By Channel
    • South Africa
      • Pricing Analysis
      • Market Share Analysis, 2024
        • By Extract
        • By Function
        • By Product Type
        • By Channel
  17. Market Structure Analysis
    • Competition Dashboard
    • Competition Benchmarking
    • Market Share Analysis of Top Players
      • By Regional
      • By Extract
      • By Function
      • By Product Type
      • By Channel
  18. Competition Analysis
    • Competition Deep Dive
      • SeabuckWonders
        • Overview
        • Product Portfolio
        • Profitability by Market Segments (Product/Age /Sales Channel/Region)
        • Sales Footprint
        • Strategy Overview
          • Marketing Strategy
          • Product Strategy
          • Channel Strategy
      • Botanic Healthcare
        • Overview
        • Product Portfolio
        • Profitability by Market Segments (Product/Age /Sales Channel/Region)
        • Sales Footprint
        • Strategy Overview
          • Marketing Strategy
          • Product Strategy
          • Channel Strategy
      • BASF
        • Overview
        • Product Portfolio
        • Profitability by Market Segments (Product/Age /Sales Channel/Region)
        • Sales Footprint
        • Strategy Overview
          • Marketing Strategy
          • Product Strategy
          • Channel Strategy
      • DSM-Firmenich
        • Overview
        • Product Portfolio
        • Profitability by Market Segments (Product/Age /Sales Channel/Region)
        • Sales Footprint
        • Strategy Overview
          • Marketing Strategy
          • Product Strategy
          • Channel Strategy
      • Croda
        • Overview
        • Product Portfolio
        • Profitability by Market Segments (Product/Age /Sales Channel/Region)
        • Sales Footprint
        • Strategy Overview
          • Marketing Strategy
          • Product Strategy
          • Channel Strategy
      • Aromtech
        • Overview
        • Product Portfolio
        • Profitability by Market Segments (Product/Age /Sales Channel/Region)
        • Sales Footprint
        • Strategy Overview
          • Marketing Strategy
          • Product Strategy
          • Channel Strategy
      • Ashland
        • Overview
        • Product Portfolio
        • Profitability by Market Segments (Product/Age /Sales Channel/Region)
        • Sales Footprint
        • Strategy Overview
          • Marketing Strategy
          • Product Strategy
          • Channel Strategy
      • Flavex
        • Overview
        • Product Portfolio
        • Profitability by Market Segments (Product/Age /Sales Channel/Region)
        • Sales Footprint
        • Strategy Overview
          • Marketing Strategy
          • Product Strategy
          • Channel Strategy
      • Bionap
        • Overview
        • Product Portfolio
        • Profitability by Market Segments (Product/Age /Sales Channel/Region)
        • Sales Footprint
        • Strategy Overview
          • Marketing Strategy
          • Product Strategy
          • Channel Strategy
      • Greentech
        • Overview
        • Product Portfolio
        • Profitability by Market Segments (Product/Age /Sales Channel/Region)
        • Sales Footprint
        • Strategy Overview
          • Marketing Strategy
          • Product Strategy
          • Channel Strategy
      • Others
        • Overview
        • Product Portfolio
        • Profitability by Market Segments (Product/Age /Sales Channel/Region)
        • Sales Footprint
        • Strategy Overview
          • Marketing Strategy
          • Product Strategy
          • Channel Strategy
  19. Assumptions & Acronyms Used
  20. Research Methodology

List of Tables

  • Table 1: Global Market Value (USD Million) Forecast by Region, 2020-2035
  • Table 2: Global Market Volume (Units) Forecast by Region, 2020-2035
  • Table 3: Global Market Value (USD Million) Forecast by Extract, 2020-2035
  • Table 4: Global Market Volume (Units) Forecast by Extract, 2020-2035
  • Table 5: Global Market Value (USD Million) Forecast by Function, 2020-2035
  • Table 6: Global Market Volume (Units) Forecast by Function, 2020-2035
  • Table 7: Global Market Value (USD Million) Forecast by Product Type, 2020-2035
  • Table 8: Global Market Volume (Units) Forecast by Product Type, 2020-2035
  • Table 9: Global Market Value (USD Million) Forecast by Channel, 2020-2035
  • Table 10: Global Market Volume (Units) Forecast by Channel, 2020-2035
  • Table 11: North America Market Value (USD Million) Forecast by Country, 2020-2035
  • Table 12: North America Market Volume (Units) Forecast by Country, 2020-2035
  • Table 13: North America Market Value (USD Million) Forecast by Extract, 2020-2035
  • Table 14: North America Market Volume (Units) Forecast by Extract, 2020-2035
  • Table 15: North America Market Value (USD Million) Forecast by Function, 2020-2035
  • Table 16: North America Market Volume (Units) Forecast by Function, 2020-2035
  • Table 17: North America Market Value (USD Million) Forecast by Product Type, 2020-2035
  • Table 18: North America Market Volume (Units) Forecast by Product Type, 2020-2035
  • Table 19: North America Market Value (USD Million) Forecast by Channel, 2020-2035
  • Table 20: North America Market Volume (Units) Forecast by Channel, 2020-2035
  • Table 21: Latin America Market Value (USD Million) Forecast by Country, 2020-2035
  • Table 22: Latin America Market Volume (Units) Forecast by Country, 2020-2035
  • Table 23: Latin America Market Value (USD Million) Forecast by Extract, 2020-2035
  • Table 24: Latin America Market Volume (Units) Forecast by Extract, 2020-2035
  • Table 25: Latin America Market Value (USD Million) Forecast by Function, 2020-2035
  • Table 26: Latin America Market Volume (Units) Forecast by Function, 2020-2035
  • Table 27: Latin America Market Value (USD Million) Forecast by Product Type, 2020-2035
  • Table 28: Latin America Market Volume (Units) Forecast by Product Type, 2020-2035
  • Table 29: Latin America Market Value (USD Million) Forecast by Channel, 2020-2035
  • Table 30: Latin America Market Volume (Units) Forecast by Channel, 2020-2035
  • Table 31: Europe Market Value (USD Million) Forecast by Country, 2020-2035
  • Table 32: Europe Market Volume (Units) Forecast by Country, 2020-2035
  • Table 33: Europe Market Value (USD Million) Forecast by Extract, 2020-2035
  • Table 34: Europe Market Volume (Units) Forecast by Extract, 2020-2035
  • Table 35: Europe Market Value (USD Million) Forecast by Function, 2020-2035
  • Table 36: Europe Market Volume (Units) Forecast by Function, 2020-2035
  • Table 37: Europe Market Value (USD Million) Forecast by Product Type, 2020-2035
  • Table 38: Europe Market Volume (Units) Forecast by Product Type, 2020-2035
  • Table 39: Europe Market Value (USD Million) Forecast by Channel, 2020-2035
  • Table 40: Europe Market Volume (Units) Forecast by Channel, 2020-2035
  • Table 41: East Asia Market Value (USD Million) Forecast by Country, 2020-2035
  • Table 42: East Asia Market Volume (Units) Forecast by Country, 2020-2035
  • Table 43: East Asia Market Value (USD Million) Forecast by Extract, 2020-2035
  • Table 44: East Asia Market Volume (Units) Forecast by Extract, 2020-2035
  • Table 45: East Asia Market Value (USD Million) Forecast by Function, 2020-2035
  • Table 46: East Asia Market Volume (Units) Forecast by Function, 2020-2035
  • Table 47: East Asia Market Value (USD Million) Forecast by Product Type, 2020-2035
  • Table 48: East Asia Market Volume (Units) Forecast by Product Type, 2020-2035
  • Table 49: East Asia Market Value (USD Million) Forecast by Channel, 2020-2035
  • Table 50: East Asia Market Volume (Units) Forecast by Channel, 2020-2035
  • Table 51: South Asia & Pacific Market Value (USD Million) Forecast by Country, 2020-2035
  • Table 52: South Asia & Pacific Market Volume (Units) Forecast by Country, 2020-2035
  • Table 53: South Asia & Pacific Market Value (USD Million) Forecast by Extract, 2020-2035
  • Table 54: South Asia & Pacific Market Volume (Units) Forecast by Extract, 2020-2035
  • Table 55: South Asia & Pacific Market Value (USD Million) Forecast by Function, 2020-2035
  • Table 56: South Asia & Pacific Market Volume (Units) Forecast by Function, 2020-2035
  • Table 57: South Asia & Pacific Market Value (USD Million) Forecast by Product Type, 2020-2035
  • Table 58: South Asia & Pacific Market Volume (Units) Forecast by Product Type, 2020-2035
  • Table 59: South Asia & Pacific Market Value (USD Million) Forecast by Channel, 2020-2035
  • Table 60: South Asia & Pacific Market Volume (Units) Forecast by Channel, 2020-2035
  • Table 61: Middle East and Africa Market Value (USD Million) Forecast by Country, 2020-2035
  • Table 62: Middle East and Africa Market Volume (Units) Forecast by Country, 2020-2035
  • Table 63: Middle East and Africa Market Value (USD Million) Forecast by Extract, 2020-2035
  • Table 64: Middle East and Africa Market Volume (Units) Forecast by Extract, 2020-2035
  • Table 65: Middle East and Africa Market Value (USD Million) Forecast by Function, 2020-2035
  • Table 66: Middle East and Africa Market Volume (Units) Forecast by Function, 2020-2035
  • Table 67: Middle East and Africa Market Value (USD Million) Forecast by Product Type, 2020-2035
  • Table 68: Middle East and Africa Market Volume (Units) Forecast by Product Type, 2020-2035
  • Table 69: Middle East and Africa Market Value (USD Million) Forecast by Channel, 2020-2035
  • Table 70: Middle East and Africa Market Volume (Units) Forecast by Channel, 2020-2035

List of Figures

  • Figure 1: Global Market Value (USD Million) by Extract, 2025-2035
  • Figure 2: Global Market Value (USD Million) by Function, 2025-2035
  • Figure 3: Global Market Value (USD Million) by Product Type, 2025-2035
  • Figure 4: Global Market Value (USD Million) by Channel, 2025-2035
  • Figure 5: Global Market Value (USD Million) by Region, 2025-2035
  • Figure 6: Global Market Value (USD Million) Analysis by Region, 2020-2035
  • Figure 7: Global Market Volume (Units) Analysis by Region, 2020-2035
  • Figure 8: Global Market Value Share (%) and BPS Analysis by Region, 2025-2035
  • Figure 9: Global Market Y-o-Y Growth (%) Projections by Region, 2025-2035
  • Figure 10: Global Market Value (USD Million) Analysis by Extract, 2020-2035
  • Figure 11: Global Market Volume (Units) Analysis by Extract, 2020-2035
  • Figure 12: Global Market Value Share (%) and BPS Analysis by Extract, 2025-2035
  • Figure 13: Global Market Y-o-Y Growth (%) Projections by Extract, 2025-2035
  • Figure 14: Global Market Value (USD Million) Analysis by Function, 2020-2035
  • Figure 15: Global Market Volume (Units) Analysis by Function, 2020-2035
  • Figure 16: Global Market Value Share (%) and BPS Analysis by Function, 2025-2035
  • Figure 17: Global Market Y-o-Y Growth (%) Projections by Function, 2025-2035
  • Figure 18: Global Market Value (USD Million) Analysis by Product Type, 2020-2035
  • Figure 19: Global Market Volume (Units) Analysis by Product Type, 2020-2035
  • Figure 20: Global Market Value Share (%) and BPS Analysis by Product Type, 2025-2035
  • Figure 21: Global Market Y-o-Y Growth (%) Projections by Product Type, 2025-2035
  • Figure 22: Global Market Value (USD Million) Analysis by Channel, 2020-2035
  • Figure 23: Global Market Volume (Units) Analysis by Channel, 2020-2035
  • Figure 24: Global Market Value Share (%) and BPS Analysis by Channel, 2025-2035
  • Figure 25: Global Market Y-o-Y Growth (%) Projections by Channel, 2025-2035
  • Figure 26: Global Market Attractiveness by Extract, 2025-2035
  • Figure 27: Global Market Attractiveness by Function, 2025-2035
  • Figure 28: Global Market Attractiveness by Product Type, 2025-2035
  • Figure 29: Global Market Attractiveness by Channel, 2025-2035
  • Figure 30: Global Market Attractiveness by Region, 2025-2035
  • Figure 31: North America Market Value (USD Million) by Extract, 2025-2035
  • Figure 32: North America Market Value (USD Million) by Function, 2025-2035
  • Figure 33: North America Market Value (USD Million) by Product Type, 2025-2035
  • Figure 34: North America Market Value (USD Million) by Channel, 2025-2035
  • Figure 35: North America Market Value (USD Million) by Country, 2025-2035
  • Figure 36: North America Market Value (USD Million) Analysis by Country, 2020-2035
  • Figure 37: North America Market Volume (Units) Analysis by Country, 2020-2035
  • Figure 38: North America Market Value Share (%) and BPS Analysis by Country, 2025-2035
  • Figure 39: North America Market Y-o-Y Growth (%) Projections by Country, 2025-2035
  • Figure 40: North America Market Value (USD Million) Analysis by Extract, 2020-2035
  • Figure 41: North America Market Volume (Units) Analysis by Extract, 2020-2035
  • Figure 42: North America Market Value Share (%) and BPS Analysis by Extract, 2025-2035
  • Figure 43: North America Market Y-o-Y Growth (%) Projections by Extract, 2025-2035
  • Figure 44: North America Market Value (USD Million) Analysis by Function, 2020-2035
  • Figure 45: North America Market Volume (Units) Analysis by Function, 2020-2035
  • Figure 46: North America Market Value Share (%) and BPS Analysis by Function, 2025-2035
  • Figure 47: North America Market Y-o-Y Growth (%) Projections by Function, 2025-2035
  • Figure 48: North America Market Value (USD Million) Analysis by Product Type, 2020-2035
  • Figure 49: North America Market Volume (Units) Analysis by Product Type, 2020-2035
  • Figure 50: North America Market Value Share (%) and BPS Analysis by Product Type, 2025-2035
  • Figure 51: North America Market Y-o-Y Growth (%) Projections by Product Type, 2025-2035
  • Figure 52: North America Market Value (USD Million) Analysis by Channel, 2020-2035
  • Figure 53: North America Market Volume (Units) Analysis by Channel, 2020-2035
  • Figure 54: North America Market Value Share (%) and BPS Analysis by Channel, 2025-2035
  • Figure 55: North America Market Y-o-Y Growth (%) Projections by Channel, 2025-2035
  • Figure 56: North America Market Attractiveness by Extract, 2025-2035
  • Figure 57: North America Market Attractiveness by Function, 2025-2035
  • Figure 58: North America Market Attractiveness by Product Type, 2025-2035
  • Figure 59: North America Market Attractiveness by Channel, 2025-2035
  • Figure 60: North America Market Attractiveness by Country, 2025-2035
  • Figure 61: Latin America Market Value (USD Million) by Extract, 2025-2035
  • Figure 62: Latin America Market Value (USD Million) by Function, 2025-2035
  • Figure 63: Latin America Market Value (USD Million) by Product Type, 2025-2035
  • Figure 64: Latin America Market Value (USD Million) by Channel, 2025-2035
  • Figure 65: Latin America Market Value (USD Million) by Country, 2025-2035
  • Figure 66: Latin America Market Value (USD Million) Analysis by Country, 2020-2035
  • Figure 67: Latin America Market Volume (Units) Analysis by Country, 2020-2035
  • Figure 68: Latin America Market Value Share (%) and BPS Analysis by Country, 2025-2035
  • Figure 69: Latin America Market Y-o-Y Growth (%) Projections by Country, 2025-2035
  • Figure 70: Latin America Market Value (USD Million) Analysis by Extract, 2020-2035
  • Figure 71: Latin America Market Volume (Units) Analysis by Extract, 2020-2035
  • Figure 72: Latin America Market Value Share (%) and BPS Analysis by Extract, 2025-2035
  • Figure 73: Latin America Market Y-o-Y Growth (%) Projections by Extract, 2025-2035
  • Figure 74: Latin America Market Value (USD Million) Analysis by Function, 2020-2035
  • Figure 75: Latin America Market Volume (Units) Analysis by Function, 2020-2035
  • Figure 76: Latin America Market Value Share (%) and BPS Analysis by Function, 2025-2035
  • Figure 77: Latin America Market Y-o-Y Growth (%) Projections by Function, 2025-2035
  • Figure 78: Latin America Market Value (USD Million) Analysis by Product Type, 2020-2035
  • Figure 79: Latin America Market Volume (Units) Analysis by Product Type, 2020-2035
  • Figure 80: Latin America Market Value Share (%) and BPS Analysis by Product Type, 2025-2035
  • Figure 81: Latin America Market Y-o-Y Growth (%) Projections by Product Type, 2025-2035
  • Figure 82: Latin America Market Value (USD Million) Analysis by Channel, 2020-2035
  • Figure 83: Latin America Market Volume (Units) Analysis by Channel, 2020-2035
  • Figure 84: Latin America Market Value Share (%) and BPS Analysis by Channel, 2025-2035
  • Figure 85: Latin America Market Y-o-Y Growth (%) Projections by Channel, 2025-2035
  • Figure 86: Latin America Market Attractiveness by Extract, 2025-2035
  • Figure 87: Latin America Market Attractiveness by Function, 2025-2035
  • Figure 88: Latin America Market Attractiveness by Product Type, 2025-2035
  • Figure 89: Latin America Market Attractiveness by Channel, 2025-2035
  • Figure 90: Latin America Market Attractiveness by Country, 2025-2035
  • Figure 91: Europe Market Value (USD Million) by Extract, 2025-2035
  • Figure 92: Europe Market Value (USD Million) by Function, 2025-2035
  • Figure 93: Europe Market Value (USD Million) by Product Type, 2025-2035
  • Figure 94: Europe Market Value (USD Million) by Channel, 2025-2035
  • Figure 95: Europe Market Value (USD Million) by Country, 2025-2035
  • Figure 96: Europe Market Value (USD Million) Analysis by Country, 2020-2035
  • Figure 97: Europe Market Volume (Units) Analysis by Country, 2020-2035
  • Figure 98: Europe Market Value Share (%) and BPS Analysis by Country, 2025-2035
  • Figure 99: Europe Market Y-o-Y Growth (%) Projections by Country, 2025-2035
  • Figure 100: Europe Market Value (USD Million) Analysis by Extract, 2020-2035
  • Figure 101: Europe Market Volume (Units) Analysis by Extract, 2020-2035
  • Figure 102: Europe Market Value Share (%) and BPS Analysis by Extract, 2025-2035
  • Figure 103: Europe Market Y-o-Y Growth (%) Projections by Extract, 2025-2035
  • Figure 104: Europe Market Value (USD Million) Analysis by Function, 2020-2035
  • Figure 105: Europe Market Volume (Units) Analysis by Function, 2020-2035
  • Figure 106: Europe Market Value Share (%) and BPS Analysis by Function, 2025-2035
  • Figure 107: Europe Market Y-o-Y Growth (%) Projections by Function, 2025-2035
  • Figure 108: Europe Market Value (USD Million) Analysis by Product Type, 2020-2035
  • Figure 109: Europe Market Volume (Units) Analysis by Product Type, 2020-2035
  • Figure 110: Europe Market Value Share (%) and BPS Analysis by Product Type, 2025-2035
  • Figure 111: Europe Market Y-o-Y Growth (%) Projections by Product Type, 2025-2035
  • Figure 112: Europe Market Value (USD Million) Analysis by Channel, 2020-2035
  • Figure 113: Europe Market Volume (Units) Analysis by Channel, 2020-2035
  • Figure 114: Europe Market Value Share (%) and BPS Analysis by Channel, 2025-2035
  • Figure 115: Europe Market Y-o-Y Growth (%) Projections by Channel, 2025-2035
  • Figure 116: Europe Market Attractiveness by Extract, 2025-2035
  • Figure 117: Europe Market Attractiveness by Function, 2025-2035
  • Figure 118: Europe Market Attractiveness by Product Type, 2025-2035
  • Figure 119: Europe Market Attractiveness by Channel, 2025-2035
  • Figure 120: Europe Market Attractiveness by Country, 2025-2035
  • Figure 121: East Asia Market Value (USD Million) by Extract, 2025-2035
  • Figure 122: East Asia Market Value (USD Million) by Function, 2025-2035
  • Figure 123: East Asia Market Value (USD Million) by Product Type, 2025-2035
  • Figure 124: East Asia Market Value (USD Million) by Channel, 2025-2035
  • Figure 125: East Asia Market Value (USD Million) by Country, 2025-2035
  • Figure 126: East Asia Market Value (USD Million) Analysis by Country, 2020-2035
  • Figure 127: East Asia Market Volume (Units) Analysis by Country, 2020-2035
  • Figure 128: East Asia Market Value Share (%) and BPS Analysis by Country, 2025-2035
  • Figure 129: East Asia Market Y-o-Y Growth (%) Projections by Country, 2025-2035
  • Figure 130: East Asia Market Value (USD Million) Analysis by Extract, 2020-2035
  • Figure 131: East Asia Market Volume (Units) Analysis by Extract, 2020-2035
  • Figure 132: East Asia Market Value Share (%) and BPS Analysis by Extract, 2025-2035
  • Figure 133: East Asia Market Y-o-Y Growth (%) Projections by Extract, 2025-2035
  • Figure 134: East Asia Market Value (USD Million) Analysis by Function, 2020-2035
  • Figure 135: East Asia Market Volume (Units) Analysis by Function, 2020-2035
  • Figure 136: East Asia Market Value Share (%) and BPS Analysis by Function, 2025-2035
  • Figure 137: East Asia Market Y-o-Y Growth (%) Projections by Function, 2025-2035
  • Figure 138: East Asia Market Value (USD Million) Analysis by Product Type, 2020-2035
  • Figure 139: East Asia Market Volume (Units) Analysis by Product Type, 2020-2035
  • Figure 140: East Asia Market Value Share (%) and BPS Analysis by Product Type, 2025-2035
  • Figure 141: East Asia Market Y-o-Y Growth (%) Projections by Product Type, 2025-2035
  • Figure 142: East Asia Market Value (USD Million) Analysis by Channel, 2020-2035
  • Figure 143: East Asia Market Volume (Units) Analysis by Channel, 2020-2035
  • Figure 144: East Asia Market Value Share (%) and BPS Analysis by Channel, 2025-2035
  • Figure 145: East Asia Market Y-o-Y Growth (%) Projections by Channel, 2025-2035
  • Figure 146: East Asia Market Attractiveness by Extract, 2025-2035
  • Figure 147: East Asia Market Attractiveness by Function, 2025-2035
  • Figure 148: East Asia Market Attractiveness by Product Type, 2025-2035
  • Figure 149: East Asia Market Attractiveness by Channel, 2025-2035
  • Figure 150: East Asia Market Attractiveness by Country, 2025-2035
  • Figure 151: South Asia & Pacific Market Value (USD Million) by Extract, 2025-2035
  • Figure 152: South Asia & Pacific Market Value (USD Million) by Function, 2025-2035
  • Figure 153: South Asia & Pacific Market Value (USD Million) by Product Type, 2025-2035
  • Figure 154: South Asia & Pacific Market Value (USD Million) by Channel, 2025-2035
  • Figure 155: South Asia & Pacific Market Value (USD Million) by Country, 2025-2035
  • Figure 156: South Asia & Pacific Market Value (USD Million) Analysis by Country, 2020-2035
  • Figure 157: South Asia & Pacific Market Volume (Units) Analysis by Country, 2020-2035
  • Figure 158: South Asia & Pacific Market Value Share (%) and BPS Analysis by Country, 2025-2035
  • Figure 159: South Asia & Pacific Market Y-o-Y Growth (%) Projections by Country, 2025-2035
  • Figure 160: South Asia & Pacific Market Value (USD Million) Analysis by Extract, 2020-2035
  • Figure 161: South Asia & Pacific Market Volume (Units) Analysis by Extract, 2020-2035
  • Figure 162: South Asia & Pacific Market Value Share (%) and BPS Analysis by Extract, 2025-2035
  • Figure 163: South Asia & Pacific Market Y-o-Y Growth (%) Projections by Extract, 2025-2035
  • Figure 164: South Asia & Pacific Market Value (USD Million) Analysis by Function, 2020-2035
  • Figure 165: South Asia & Pacific Market Volume (Units) Analysis by Function, 2020-2035
  • Figure 166: South Asia & Pacific Market Value Share (%) and BPS Analysis by Function, 2025-2035
  • Figure 167: South Asia & Pacific Market Y-o-Y Growth (%) Projections by Function, 2025-2035
  • Figure 168: South Asia & Pacific Market Value (USD Million) Analysis by Product Type, 2020-2035
  • Figure 169: South Asia & Pacific Market Volume (Units) Analysis by Product Type, 2020-2035
  • Figure 170: South Asia & Pacific Market Value Share (%) and BPS Analysis by Product Type, 2025-2035
  • Figure 171: South Asia & Pacific Market Y-o-Y Growth (%) Projections by Product Type, 2025-2035
  • Figure 172: South Asia & Pacific Market Value (USD Million) Analysis by Channel, 2020-2035
  • Figure 173: South Asia & Pacific Market Volume (Units) Analysis by Channel, 2020-2035
  • Figure 174: South Asia & Pacific Market Value Share (%) and BPS Analysis by Channel, 2025-2035
  • Figure 175: South Asia & Pacific Market Y-o-Y Growth (%) Projections by Channel, 2025-2035
  • Figure 176: South Asia & Pacific Market Attractiveness by Extract, 2025-2035
  • Figure 177: South Asia & Pacific Market Attractiveness by Function, 2025-2035
  • Figure 178: South Asia & Pacific Market Attractiveness by Product Type, 2025-2035
  • Figure 179: South Asia & Pacific Market Attractiveness by Channel, 2025-2035
  • Figure 180: South Asia & Pacific Market Attractiveness by Country, 2025-2035
  • Figure 181: Middle East and Africa Market Value (USD Million) by Extract, 2025-2035
  • Figure 182: Middle East and Africa Market Value (USD Million) by Function, 2025-2035
  • Figure 183: Middle East and Africa Market Value (USD Million) by Product Type, 2025-2035
  • Figure 184: Middle East and Africa Market Value (USD Million) by Channel, 2025-2035
  • Figure 185: Middle East and Africa Market Value (USD Million) by Country, 2025-2035
  • Figure 186: Middle East and Africa Market Value (USD Million) Analysis by Country, 2020-2035
  • Figure 187: Middle East and Africa Market Volume (Units) Analysis by Country, 2020-2035
  • Figure 188: Middle East and Africa Market Value Share (%) and BPS Analysis by Country, 2025-2035
  • Figure 189: Middle East and Africa Market Y-o-Y Growth (%) Projections by Country, 2025-2035
  • Figure 190: Middle East and Africa Market Value (USD Million) Analysis by Extract, 2020-2035
  • Figure 191: Middle East and Africa Market Volume (Units) Analysis by Extract, 2020-2035
  • Figure 192: Middle East and Africa Market Value Share (%) and BPS Analysis by Extract, 2025-2035
  • Figure 193: Middle East and Africa Market Y-o-Y Growth (%) Projections by Extract, 2025-2035
  • Figure 194: Middle East and Africa Market Value (USD Million) Analysis by Function, 2020-2035
  • Figure 195: Middle East and Africa Market Volume (Units) Analysis by Function, 2020-2035
  • Figure 196: Middle East and Africa Market Value Share (%) and BPS Analysis by Function, 2025-2035
  • Figure 197: Middle East and Africa Market Y-o-Y Growth (%) Projections by Function, 2025-2035
  • Figure 198: Middle East and Africa Market Value (USD Million) Analysis by Product Type, 2020-2035
  • Figure 199: Middle East and Africa Market Volume (Units) Analysis by Product Type, 2020-2035
  • Figure 200: Middle East and Africa Market Value Share (%) and BPS Analysis by Product Type, 2025-2035
  • Figure 201: Middle East and Africa Market Y-o-Y Growth (%) Projections by Product Type, 2025-2035
  • Figure 202: Middle East and Africa Market Value (USD Million) Analysis by Channel, 2020-2035
  • Figure 203: Middle East and Africa Market Volume (Units) Analysis by Channel, 2020-2035
  • Figure 204: Middle East and Africa Market Value Share (%) and BPS Analysis by Channel, 2025-2035
  • Figure 205: Middle East and Africa Market Y-o-Y Growth (%) Projections by Channel, 2025-2035
  • Figure 206: Middle East and Africa Market Attractiveness by Extract, 2025-2035
  • Figure 207: Middle East and Africa Market Attractiveness by Function, 2025-2035
  • Figure 208: Middle East and Africa Market Attractiveness by Product Type, 2025-2035
  • Figure 209: Middle East and Africa Market Attractiveness by Channel, 2025-2035
  • Figure 210: Middle East and Africa Market Attractiveness by Country, 2025-2035

Frequently Asked Questions

How big is the Sea Buckthorn Actives Market in 2025?

The global Sea Buckthorn Actives Market is estimated to be valued at USD 1,152.3 million in 2025.

What will be the size of the Sea Buckthorn Actives Market in 2035?

The market size for the Sea Buckthorn Actives Market is projected to reach USD 3,813.2 million by 2035.

How much will be the Sea Buckthorn Actives Market growth between 2025 and 2035?

The Sea Buckthorn Actives Market is expected to grow at a CAGR of 12.7% between 2025 and 2035.

What are the key product types in the Sea Buckthorn Actives Market?

The key product types in the Sea Buckthorn Actives Market are serums and other product formats such as creams, lotions, oils, and capsules.

Which functional segment will contribute significant share in the Sea Buckthorn Actives Market in 2025?

The anti-aging functional segment is expected to command 52.5% of the Sea Buckthorn Actives Market share in 2025, making it the leading application area.

Explore Similar Insights

Future Market Insights

Sea Buckthorn Actives Market