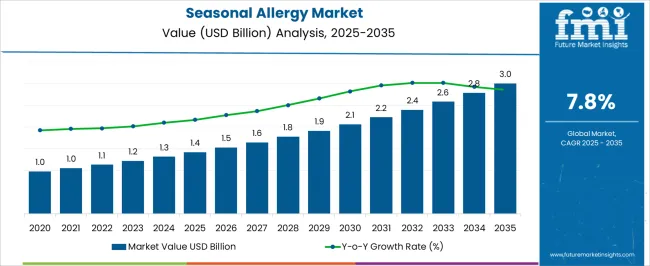
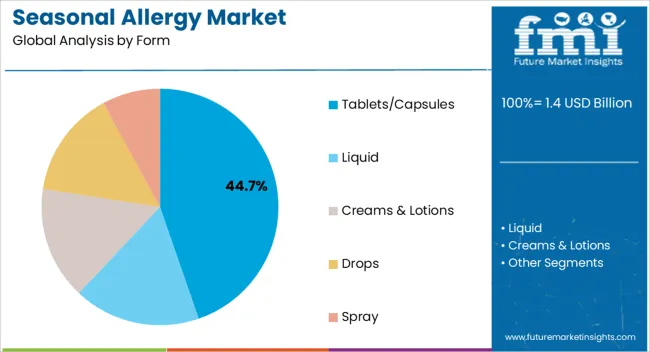
The global seasonal allergy market enjoys a valuation of USD 1.15 Billion in 2022, and it is further projected to expand at a CAGR of 7.8% over the forecasted years. According to a recent study by Future Market Insights, tablets/capsules by form leading the market with a share of about 37.1% in the year 2022, within the global market.
Market Outlook
Data Points | Market Insights |
---|---|
Market Value 2022 | USD 1.15 Billion |
Market Value 2023 | USD 1.22 Billion |
Market Value 2033 | USD 2.58 Billion |
CAGR 2023 to 2033 | 7.8% |
Market Share of Top 5 Countries | 62.1% |
Key Market Players | Merck KGaA, Johnson & Johnson, Allergopharma, Sanofi SA, McNeil Consumer Healthcare, Genentech Inc., GlaxoSmithKline PLC, Leti Pharma, Alerpharma S.A, Allergan, Inc., Meda Pharmaceuticals, Inc, Novartis International AG, Bausch Health Companies Inc., Allergopharma, ALK Abello, Stallergenes, Greer, Allergy Therapeutics, Aimmune Therapeutics, Biomay AG, HAL Allergy Group, Bayer, AstraZeneca |
Seasonal allergies, like other allergies, develop when the body's immune system overreacts to a trigger in the environment, usually in the spring, summer, or fall when specific plants pollinate. A growing number of producers have identified allergies as a viable market, and with the help of a research and development team, they are delivering fresh, cutting-edge therapy and treatment options to the market, expanding the range of already available treatments. A large portion of people are still affected by seasonal allergies yearly.
The global sales of the market are anticipated to rise at a CAGR of 7.8% between 2023 and 2033, owing to the rising prevalence of allergic diseases.
The global market holds around 5.7%share of the overall global allergy treatment market with a value of around USD 20.2 Million, in 2022.
Longer pollen seasons during warmer temperatures or higher carbon dioxide emissions brings about higher quantities of pollen. These are the key contributors to the seasonal allergies affecting an individual. The incidence rate and prevalence rate of seasonal allergies are growing rapidly owing to which the demand for available treatments is expected to increase over the forecast period.
Antihistamines, decongestants, nasal corticosteroids, allergen immunotherapy, and leukotriene receptor antagonists are some of the most well-liked treatments for seasonal allergies. Antihistamines dominate the market since they are one of the most widely used and widely prescribed medications for the treatment of allergies, both with and without a prescription.
Owing to the above-mentioned factors, the global market is expected to grow at a prominent pace, and reach a valuation of around USD 2.58 Billion during the year 2033.
This creates an enormous opportunity for the manufacturer to explore the seasonal allergy market. Several biopharma businesses with tested technology and cutting-edge treatment choices that are unique and have been approved have emerged as a result of the life science industry's entry into the pharmaceutical sector. This enables medical professionals to rely on these novel treatment possibilities.
For instance, allergy immunotherapy as a treatment has proven to be successful in multiple clinical trials. Such as high-dose, standardized vaccinations are used in subcutaneous injection immunotherapy (SCIT). These medications typically contain 5–20 mcg of the main allergen. SCITs are given as maintenance injections every month. Also, sublingual allergy immunotherapy (SLIT) involves the sublingual space's unique, tolerance-promoting immune cells, also known as oral Langerhans cells. Liquid antigens (drops) and pills are the two therapeutic options for SLIT.
Overall, it is anticipated that the market for seasonal allergies will rise over the coming years as more research and development are put into creating fresh, efficient treatment choices.
The market is experiencing a decline due to the adverse effects associated with allergy shots and tablets.
Periodic injections are administered over time as allergy shots. Immunotherapy for allergies is a protracted treatment that might last anywhere between three and five years. It entirely depends on the kind and degree of allergy.
Each allergy shot contains a very small amount of the exact ingredients or substances that cause allergic responses.
Patients frequently discontinue therapy in the middle of the procedure due to extended treatment schedules, age, health, physical location, and financial constraints.
The time associated with the treatment may hinder market growth.
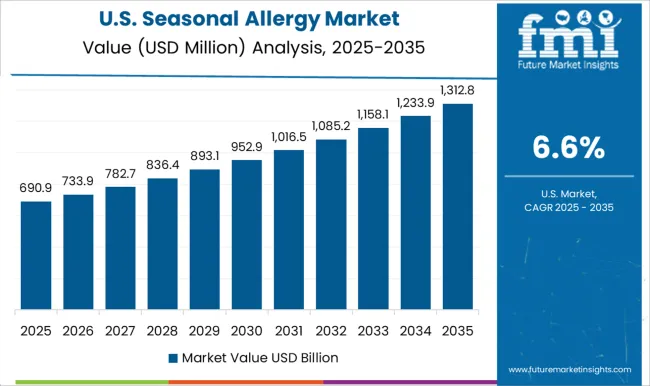
The USA dominates the North American region with a global market share of around 30.8% in 2022. In the United States, the importance of artificial intelligence (AI) in medical sciences cannot be overstated. The healthcare industry in the US is one of the largest in the world, and it faces numerous challenges, such as rising costs, an aging population, and a shortage of healthcare professionals.
AI has the potential to address many of these challenges by improving the accuracy and efficiency of medical diagnosis and treatment. For instance, in the case of seasonal allergies, AI The Weather Channel data science team has been trying to develop a tool to assist seasonal allergy sufferers as spring progresses and summer draws closer. Allergy Insights with Watson, a new service that uses AI to assist forecast seasonal allergy risk in the United States, is freely accessible on The Weather Channel app and weather.com.
In order to aware people in making the more appropriate decisions and preparing for allergy season, united states in going to witness an exponential growth in the global market
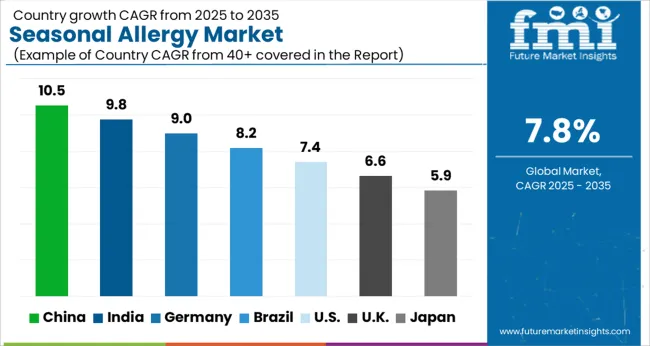
China has a market share of 9.5%, with a market value of USD 109.9 Million in the global seasonal allergy market in 2022.
In China, allergy immunotherapy (AIT) has been practiced for more than 60 years. The Chinese College of Allergy and Asthma (CCAA), a specialized branch of CDMA that serves as the primary certifying body for AIT, was formed in 2016 with the backing of the Chinese Medical Association (CMA) and the Chinese Medical Doctors Association (CMDA). Chinese allergists and researchers have made significant advancements in the creation of AIT. Chinese allergists and researchers have published a large number of articles globally that include original research investigations, systematic reviews, case studies, and clinical trials. Sublingual immunotherapy (SLIT) is starting to gain popularity in China, where traditional subcutaneous immunotherapy (SCIT) is now the favored AIT.
Similar to the United States, immunotherapy is popular in China and it is expected to establish a steady growth in the coming years.
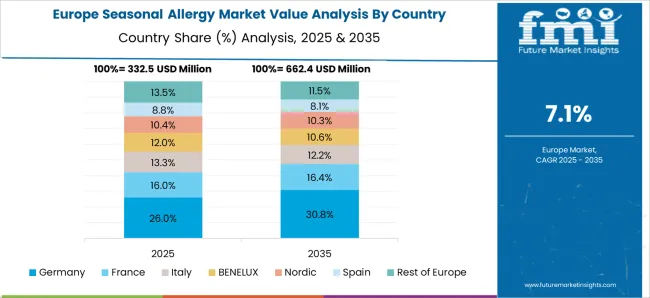
Germany holds a market share of 8.7% in 2022 in the global seasonal allergy market, owing to the presence of many established players in European countries.
Germany is a global leader in biotechnology, and the environment for the growth of commercial biotechnology is only improving. This has a favorable impact on the growth of new businesses that specialize in this industry. There were more businesses between 2015 and 2019 by 20.7%. Germany continues to be the top European nation for funding the biotechnology sector. 78% of the industry's overall budget in 2019 was generated through venture capital and initial public offerings (IPOs). About 70% of all businesses in Germany use biotechnology for medical purposes, which is particularly significant in light of the recent developments brought on by COVID-19.
Germany is strengthening its manufacturing and development of novel drugs which will positively grow the market in the future.
India holds a share of around 6.6% in the global market in 2022.
The prevalence of allergies and asthma is increasing in India, and it has turned into a serious health issue. Symptoms can range from mild rhinitis to severe asthma, and even life-threatening anaphylaxis. This subcontinent has a very broad "allergen repertoire" because of its distinct climatic conditions, flora, and dietary customs. To make an accurate diagnosis and create immunotherapeutic vaccines, allergy-eliciting chemicals must be correctly identified, purified, and molecularly characterized. Although there are many reports on common allergies, the majority of these studies relied on early allergen detection and identification. Recombinant technologies and structural biology have only been used to characterize a small number of these allergen compounds.
There are still millions of cases of the disease worldwide, despite India's prevalence rates generally being lower than those of high-income countries. Due to the large number of patients, Indian biopharmaceutical companies must enhance their supply of treatment medications.
Tablets/Capsules are mostly favored by patients suffering from allergies. It has contributed USD 427.4 Million to the global market in 2022.
Because of its durability and patient acceptability, the tablet is the most commonly utilized dosage form out of all those that are available. As a result, the coating plays a crucial role in the tablet's composition. The superior aesthetic qualities, such as color, texture, mouth feel, and flavor masking, depending on the film and sugar coatings. This makes tablets/capsules the most lucrative form.
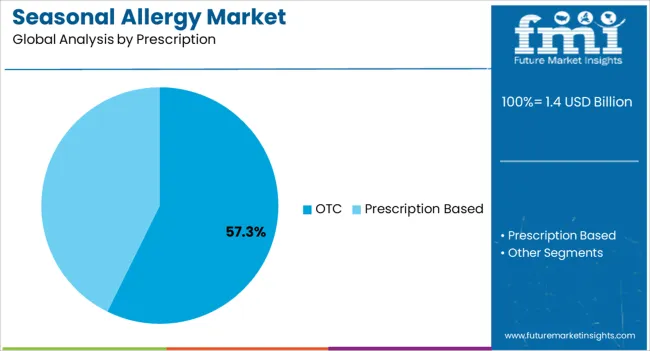
OTC led the global market with over 76.0% value share in 2022. Customers find it simpler to buy OTC medications because they are widely accessible and may be purchased without a prescription. People can save time and money by not having to wait for prescriptions to be filled or make appointments with doctors. More people can afford OTC medications because they are often less expensive than prescription medicines.
Oral is mostly preferred by patients. It has a market share of 36.6% in the global market in 2022. Oral drugs are uncomplicated to administer, patients can take them at home without a doctor's supervision. Oral drugs are advantageous for those with chronic illnesses who require long-term care. Oral drugs are typically less expensive than those administered intravenously or orally, which necessitate more specialized equipment and physician oversight.
Antihistamines have a market share of 46.0% in the global market in 2022.
The ease of use and accessibility of over-the-counter antihistamines is high. Second-generation antihistamines are also thought to be a better option. However, each one must be assessed based on their particular efficacy and safety.
Hospital pharmacies hold a market share of 35.9% during the year 2022. Hospitals are the primary locations where readily available, licensed, and approved medication can be found. By collaborating with doctors, nurses, and pharmacy staff to provide the proper medications and supplies during treatment procedures, hospital pharmacies can significantly improve patient care. Hospitals can exceed their patient satisfaction goals with the guarantee of improved patient outcomes. Due to the extensive treatment offered in hospital settings, the category is predicted to expand at a profitable rate throughout the projection period.
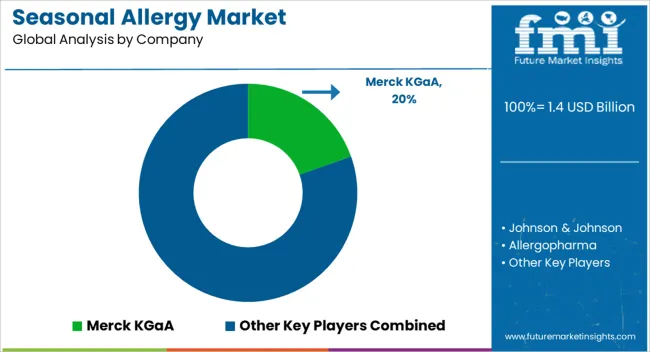
Collaboration with scientific and research foundations to increase public awareness and receiving product approvals from regulatory bodies are the key strategies opted by key players within this market space.
Similarly, recent developments related to companies within the seasonal allergy market space have been tracked by the team at Future Market Insights. These are available in the full report.
Attribute | Details |
---|---|
Forecast Period | 2023 to 2033 |
Historical Data Available for | 2018 to 2022 |
Market Analysis | USD Million for Value |
Key Regions Covered | North America; Latin America; Europe; South Asia; East Asia; Oceania; and the Middle East & Africa |
Key Countries Covered | The USA, Canada, Brazil, Mexico, Argentina, the United kingdom, Germany, Italy, Russia, Spain, France, Benelux, India, Thailand, Indonesia, Malaysia, Japan, China, South Korea, Australia, New Zealand, Türkiye, GCC Countries, North Africa and South Africa |
Key Market Segments Covered | Form, Prescription Type, Route of Administration, Treatment, Distribution Channel |
Key Companies Profiled | Merck KGaA; Johnson & Johnson; Allergopharma; Sanofi SA; McNeil Consumer Healthcare,; Genentech Inc.; GlaxoSmithKline PLC; Leti Pharma,; Alerpharma S.A; Allergan, Inc.; Meda Pharmaceuticals, Inc; Novartis International AG; Bausch Health Companies Inc.; Allergopharma; ALK Abello; Stallergenes Greer; Allergy Therapeutics; Aimmune Therapeutics; Biomay AG; HAL Allergy Group; Bayer; AstraZeneca |
Pricing | Available upon Request |
Table 01: Global Market Value (US$ Million) Analysis 2018 to 2022 and Forecast 2023 to 2033, by Form
Table 02: Global Market Value (US$ Million) Analysis 2018 to 2022 and Forecast 2023 to 2033, by Prescription Type
Table 03: Global Market Value (US$ Million) Analysis 2018 to 2022 and Forecast 2023 to 2033, by Route of Administration
Table 04: Global Market Value (US$ Million) Analysis 2018 to 2022 and Forecast 2023 to 2033, by Treatment
Table 05: Global Market Value (US$ Million) Analysis 2018 to 2022 and Forecast 2023 to 2033, by Distribution Channel
Table 06: Global Market Value (US$ Million) Analysis 2018 to 2022 and Forecast 2023 to 2033, by Region
Table 07: North America Market Value (US$ Million) Analysis 2018 to 2022 and Forecast 2023 to 2033, by Country
Table 08: North America Market Value (US$ Million) Analysis 2018 to 2022 and Forecast 2023 to 2033, by Form
Table 09: North America Market Value (US$ Million) Analysis 2018 to 2022 and Forecast 2023 to 2033, by Prescription Type
Table 10: North America Market Value (US$ Million) Analysis 2018 to 2022 and Forecast 2023 to 2033, by Route of Administration
Table 11: North America Market Value (US$ Million) Analysis 2018 to 2022 and Forecast 2023 to 2033, by Treatment
Table 12: North America Market Value (US$ Million) Analysis 2018 to 2022 and Forecast 2023 to 2033, by Distribution Channel
Table 13: Latin America Market Value (US$ Million) Analysis 2018 to 2022 and Forecast 2023 to 2033, by Country
Table 14: Latin America Market Value (US$ Million) Analysis 2018 to 2022 and Forecast 2023 to 2033, by Form
Table 15: Latin America Market Value (US$ Million) Analysis 2018 to 2022 and Forecast 2023 to 2033, by Prescription Type
Table 16: Latin America Market Value (US$ Million) Analysis 2018 to 2022 and Forecast 2023 to 2033, by Route of Administration
Table 17: Latin America Market Value (US$ Million) Analysis 2018 to 2022 and Forecast 2023 to 2033, by Treatment
Table 18: Latin America Market Value (US$ Million) Analysis 2018 to 2022 and Forecast 2023 to 2033, by Distribution Channel
Table 19: Europe Market Value (US$ Million) Analysis 2018 to 2022 and Forecast 2023 to 2033, by Country
Table 20: Europe Market Value (US$ Million) Analysis 2018 to 2022 and Forecast 2023 to 2033, by Form
Table 21: Europe Market Value (US$ Million) Analysis 2018 to 2022 and Forecast 2023 to 2033, by Prescription Type
Table 22: Europe Market Value (US$ Million) Analysis 2018 to 2022 and Forecast 2023 to 2033, by Route of Administration
Table 23: Europe Market Value (US$ Million) Analysis 2018 to 2022 and Forecast 2023 to 2033, by Treatment
Table 24: Europe Market Value (US$ Million) Analysis 2018 to 2022 and Forecast 2023 to 2033, by Distribution Channel
Table 25: East Asia Market Value (US$ Million) Analysis 2018 to 2022 and Forecast 2023 to 2033, by Country
Table 26: East Asia Market Value (US$ Million) Analysis 2018 to 2022 and Forecast 2023 to 2033, by Form
Table 27: East Asia Market Value (US$ Million) Analysis 2018 to 2022 and Forecast 2023 to 2033, by Prescription Type
Table 28: East Asia Market Value (US$ Million) Analysis 2018 to 2022 and Forecast 2023 to 2033, by Route of Administration
Table 29: East Asia Market Value (US$ Million) Analysis 2018 to 2022 and Forecast 2023 to 2033, by Treatment
Table 30: East Asia Market Value (US$ Million) Analysis 2018 to 2022 and Forecast 2023 to 2033, by Distribution Channel
Table 31: South Asia Market Value (US$ Million) Analysis 2018 to 2022 and Forecast 2023 to 2033, by Country
Table 32: South Asia Market Value (US$ Million) Analysis 2018 to 2022 and Forecast 2023 to 2033, by Form
Table 33: South Asia Market Value (US$ Million) Analysis 2018 to 2022 and Forecast 2023 to 2033, by Prescription Type
Table 34: South Asia Market Value (US$ Million) Analysis 2018 to 2022 and Forecast 2023 to 2033, by Route of Administration
Table 35: South Asia Market Value (US$ Million) Analysis 2018 to 2022 and Forecast 2023 to 2033, by Treatment
Table 36: South Asia Market Value (US$ Million) Analysis 2018 to 2022 and Forecast 2023 to 2033, by Distribution Channel
Table 37: Oceania Market Value (US$ Million) Analysis 2018 to 2022 and Forecast 2023 to 2033, by Country
Table 38: Oceania Market Value (US$ Million) Analysis 2018 to 2022 and Forecast 2023 to 2033, by Form
Table 39: Oceania Market Value (US$ Million) Analysis 2018 to 2022 and Forecast 2023 to 2033, by Prescription Type
Table 40: Oceania Market Value (US$ Million) Analysis 2018 to 2022 and Forecast 2023 to 2033, by Route of Administration
Table 41: Oceania Market Value (US$ Million) Analysis 2018 to 2022 and Forecast 2023 to 2033, by Treatment
Table 42: Oceania Market Value (US$ Million) Analysis 2018 to 2022 and Forecast 2023 to 2033, by Distribution Channel
Table 43: Middle East & Africa Market Value (US$ Million) Analysis 2018 to 2022 and Forecast 2023 to 2033, by Country
Table 44: Middle East & Africa Market Value (US$ Million) Analysis 2018 to 2022 and Forecast 2023 to 2033, by Form
Table 45: Middle East & Africa Market Value (US$ Million) Analysis 2018 to 2022 and Forecast 2023 to 2033, by Prescription Type
Table 46: Middle East & Africa Market Value (US$ Million) Analysis 2018 to 2022 and Forecast 2023 to 2033, by Route of Administration
Table 47: Middle East & Africa Market Value (US$ Million) Analysis 2018 to 2022 and Forecast 2023 to 2033, by Treatment
Table 48: Middle East & Africa Market Value (US$ Million) Analysis 2018 to 2022 and Forecast 2023 to 2033, by Distribution Channel
Figure 01: Global Market Value (US$ Million) Analysis, 2018 to 2022
Figure 02: Global Market Forecast & Y-o-Y Growth, 2023 to 2033
Figure 03: Global Market Absolute $ Opportunity (US$ Million) Analysis, 2022 to 2032
Figure 04: Global Market Value Share (%) Analysis 2023 and 2033, by Form
Figure 05: Global Market Y-o-Y Growth (%) Analysis 2022-2033, by Form
Figure 06: Global Market Attractiveness Analysis 2023 to 2033, by Form
Figure 07: Global Market Value Share (%) Analysis 2023 and 2033, by Prescription Type
Figure 08: Global Market Y-o-Y Growth (%) Analysis 2022-2033, by Prescription Type
Figure 09: Global Market Attractiveness Analysis 2023 to 2033, by Prescription Type
Figure 10: Global Market Value Share (%) Analysis 2023 and 2033, by Route of Administration
Figure 11: Global Market Y-o-Y Growth (%) Analysis 2022-2033, by Route of Administration
Figure 12: Global Market Attractiveness Analysis 2023 to 2033, by Route of Administration
Figure 13: Global Market Value Share (%) Analysis 2023 and 2033, by Treatment
Figure 14: Global Market Y-o-Y Growth (%) Analysis 2022-2033, by Treatment
Figure 15: Global Market Attractiveness Analysis 2023 to 2033, by Treatment
Figure 16: Global Market Value Share (%) Analysis 2023 and 2033, by Distribution Channel
Figure 17: Global Market Y-o-Y Growth (%) Analysis 2022-2033, by Distribution Channel
Figure 18: Global Market Attractiveness Analysis 2023 to 2033, by Distribution Channel
Figure 19: Global Market Value Share (%) Analysis 2023 and 2033, by Region
Figure 20: Global Market Y-o-Y Growth (%) Analysis 2022-2033, by Region
Figure 21: Global Market Attractiveness Analysis 2023 to 2033, by Region
Figure 22: North America Market Value (US$ Million) Analysis, 2018 to 2022
Figure 23: North America Market Value (US$ Million) Forecast, 2023 to 2033
Figure 24: North America Market Value Share, by Form (2023 E)
Figure 25: North America Market Value Share, by Prescription Type (2023 E)
Figure 26: North America Market Value Share, by Route of Administration (2023 E)
Figure 27: North America Market Value Share, by Treatment (2023 E)
Figure 28: North America Market Value Share, by Distribution Channel (2023 E)
Figure 29: North America Market Value Share, by Country (2023 E)
Figure 30: North America Market Attractiveness Analysis by Form, 2023 to 2033
Figure 31: North America Market Attractiveness Analysis by Prescription Type, 2023 to 2033
Figure 32: North America Market Attractiveness Analysis by Route of Administration, 2023 to 2033
Figure 33: North America Market Attractiveness Analysis by Treatment, 2023 to 2033
Figure 34: North America Market Attractiveness Analysis by Distribution Channel, 2023 to 2033
Figure 35: North America Market Attractiveness Analysis by Country, 2023 to 2033
Figure 36: USA Market Value Proportion Analysis, 2022
Figure 37: Global Vs. USA Growth Comparison
Figure 38: USA Market Share Analysis (%) by Form, 2023 and 2033
Figure 39: USA Market Share Analysis (%) by Prescription Type, 2023 and 2033
Figure 40: USA Market Share Analysis (%) by Route of Administration, 2023 and 2033
Figure 41: USA Market Share Analysis (%) by Treatment, 2023 and 2033
Figure 42: USA Market Share Analysis (%) by Distribution Channel, 2023 and 2033
Figure 43: Canada Market Value Proportion Analysis, 2022
Figure 44: Global Vs. Canada. Growth Comparison
Figure 45: Canada Market Share Analysis (%) by Form, 2023 and 2033
Figure 46: Canada Market Share Analysis (%) by Prescription Type, 2023 and 2033
Figure 47: Canada Market Share Analysis (%) by Route of Administration, 2023 and 2033
Figure 48: Canada Market Share Analysis (%) by Treatment, 2023 and 2033
Figure 49: Canada Market Share Analysis (%) by Distribution Channel, 2023 and 2033
Figure 50: Latin America Market Value (US$ Million) Analysis, 2018 to 2022
Figure 51: Latin America Market Value (US$ Million) Forecast, 2023 to 2033
Figure 52: Latin America Market Value Share, by Form (2023 E)
Figure 53: Latin America Market Value Share, by Prescription Type (2023 E)
Figure 54: Latin America Market Value Share, by Route of Administration (2023 E)
Figure 55: Latin America Market Value Share, by Treatment (2023 E)
Figure 56: Latin America Market Value Share, by Distribution Channel (2023 E)
Figure 57: Latin America Market Value Share, by Country (2023 E)
Figure 58: Latin America Market Attractiveness Analysis by Form, 2023 to 2033
Figure 59: Latin America Market Attractiveness Analysis by Prescription Type, 2023 to 2033
Figure 60: Latin America Market Attractiveness Analysis by Route of Administration, 2023 to 2033
Figure 61: Latin America Market Attractiveness Analysis by Treatment, 2023 to 2033
Figure 62: Latin America Market Attractiveness Analysis by Distribution Channel, 2023 to 2033
Figure 63: Latin America Market Attractiveness Analysis by Country, 2023 to 2033
Figure 64: Mexico Market Value Proportion Analysis, 2022
Figure 65: Global Vs Mexico Growth Comparison
Figure 66: Mexico Market Share Analysis (%) by Form, 2023 and 2033
Figure 67: Mexico Market Share Analysis (%) by Prescription Type, 2023 and 2033
Figure 68: Mexico Market Share Analysis (%) by Route of Administration, 2023 and 2033
Figure 69: Mexico Market Share Analysis (%) by Treatment, 2023 and 2033
Figure 70: Mexico Market Share Analysis (%) by Distribution Channel, 2023 and 2033
Figure 71: Brazil Market Value Proportion Analysis, 2022
Figure 72: Global Vs. Brazil. Growth Comparison
Figure 73: Brazil Market Share Analysis (%) by Form, 2023 and 2033
Figure 74: Brazil Market Share Analysis (%) by Prescription Type, 2023 and 2033
Figure 75: Brazil Market Share Analysis (%) by Route of Administration, 2023 and 2033
Figure 76: Brazil Market Share Analysis (%) by Treatment, 2023 and 2033
Figure 77: Brazil Market Share Analysis (%) by Distribution Channel, 2023 and 2033
Figure 78: Argentina Market Value Proportion Analysis, 2022
Figure 79: Global Vs Argentina Growth Comparison
Figure 80: Argentina Market Share Analysis (%) by Form, 2023 and 2033
Figure 81: Argentina Market Share Analysis (%) by Prescription Type, 2023 and 2033
Figure 82: Argentina Market Share Analysis (%) by Route of Administration, 2023 and 2033
Figure 83: Argentina Market Share Analysis (%) by Treatment, 2023 and 2033
Figure 84: Argentina Market Share Analysis (%) by Distribution Channel, 2023 and 2033
Figure 85: Europe Market Value (US$ Million) Analysis, 2018 to 2022
Figure 86: Europe Market Value (US$ Million) Forecast, 2023 to 2033
Figure 87: Europe Market Value Share, by Form (2023 E)
Figure 88: Europe Market Value Share, by Prescription Type (2023 E)
Figure 89: Europe Market Value Share, by Route of Administration (2023 E)
Figure 90: Europe Market Value Share, by Treatment (2023 E)
Figure 91: Europe Market Value Share, by Distribution Channel (2023 E)
Figure 92: Europe Market Value Share, by Country (2023 E)
Figure 93: Europe Market Attractiveness Analysis by Form, 2023 to 2033
Figure 94: Europe Market Attractiveness Analysis by Prescription Type, 2023 to 2033
Figure 95: Europe Market Attractiveness Analysis by Route of Administration, 2023 to 2033
Figure 96: Europe Market Attractiveness Analysis by Treatment, 2023 to 2033
Figure 97: Europe Market Attractiveness Analysis by Distribution Channel, 2023 to 2033
Figure 98: Europe Market Attractiveness Analysis by Country, 2023 to 2033
Figure 99: United kingdom Market Value Proportion Analysis, 2022
Figure 100: Global Vs. United kingdom Growth Comparison
Figure 101: United kingdom Market Share Analysis (%) by Form, 2023 and 2033
Figure 102: United kingdom Market Share Analysis (%) by Prescription Type, 2023 and 2033
Figure 103: United kingdom Market Share Analysis (%) by Route of Administration, 2023 and 2033
Figure 104: United kingdom Market Share Analysis (%) by Treatment, 2023 and 2033
Figure 105: United kingdom Market Share Analysis (%) by Distribution Channel, 2023 and 2033
Figure 106: Germany Market Value Proportion Analysis, 2022
Figure 107: Global Vs. Germany Growth Comparison
Figure 108: Germany Market Share Analysis (%) by Form, 2023 and 2033
Figure 109: Germany Market Share Analysis (%) by Prescription Type, 2023 and 2033
Figure 110: Germany Market Share Analysis (%) by Route of Administration, 2023 and 2033
Figure 111: Germany Market Share Analysis (%) by Treatment, 2023 and 2033
Figure 112: Germany Market Share Analysis (%) by Distribution Channel, 2023 and 2033
Figure 113: Italy Market Value Proportion Analysis, 2022
Figure 114: Global Vs. Italy Growth Comparison
Figure 115: Italy Market Share Analysis (%) by Form, 2023 and 2033
Figure 116: Italy Market Share Analysis (%) by Prescription Type, 2023 and 2033
Figure 117: Italy Market Share Analysis (%) by Route of Administration, 2023 and 2033
Figure 118: Italy Market Share Analysis (%) by Treatment, 2023 and 2033
Figure 119: Italy Market Share Analysis (%) by Distribution Channel, 2023 and 2033
Figure 120: France Market Value Proportion Analysis, 2022
Figure 121: Global Vs France Growth Comparison
Figure 122: France Market Share Analysis (%) by Form, 2023 and 2033
Figure 123: France Market Share Analysis (%) by Prescription Type, 2023 and 2033
Figure 124: France Market Share Analysis (%) by Route of Administration, 2023 and 2033
Figure 125: France Market Share Analysis (%) by Treatment, 2023 and 2033
Figure 126: France Market Share Analysis (%) by Distribution Channel, 2023 and 2033
Figure 127: Spain Market Value Proportion Analysis, 2022
Figure 128: Global Vs Spain Growth Comparison
Figure 129: Spain Market Share Analysis (%) by Form, 2023 and 2033
Figure 130: Spain Market Share Analysis (%) by Prescription Type, 2023 and 2033
Figure 131: Spain Market Share Analysis (%) by Route of Administration, 2023 and 2033
Figure 132: Spain Market Share Analysis (%) by Treatment, 2023 and 2033
Figure 133: Spain Market Share Analysis (%) by Distribution Channel, 2023 and 2033
Figure 134: Russia Market Value Proportion Analysis, 2022
Figure 135: Global Vs Russia Growth Comparison
Figure 136: Russia Market Share Analysis (%) by Form, 2023 and 2033
Figure 137: Russia Market Share Analysis (%) by Prescription Type, 2023 and 2033
Figure 138: Russia Market Share Analysis (%) by Route of Administration, 2023 and 2033
Figure 139: Russia Market Share Analysis (%) by Treatment, 2023 and 2033
Figure 140: Russia Market Share Analysis (%) by Distribution Channel, 2023 and 2033
Figure 141: BENELUX Market Value Proportion Analysis, 2022
Figure 142: Global Vs BENELUX Growth Comparison
Figure 143: BENELUX Market Share Analysis (%) by Form, 2023 and 2033
Figure 144: BENELUX Market Share Analysis (%) by Prescription Type, 2023 and 2033
Figure 145: BENELUX Market Share Analysis (%) by Route of Administration, 2023 and 2033
Figure 146: BENELUX Market Share Analysis (%) by Treatment, 2023 and 2033
Figure 147: BENELUX Market Share Analysis (%) by Distribution Channel, 2023 and 2033
Figure 148: East Asia Market Value (US$ Million) Analysis, 2018 to 2022
Figure 149: East Asia Market Value (US$ Million) Forecast, 2023 to 2033
Figure 150: East Asia Market Value Share, by Form (2023 E)
Figure 151: East Asia Market Value Share, by Prescription Type (2023 E)
Figure 152: East Asia Market Value Share, by Route of Administration (2023 E)
Figure 153: East Asia Market Value Share, by Treatment (2023 E)
Figure 154: East Asia Market Value Share, by Distribution Channel (2023 E)
Figure 155: East Asia Market Value Share, by Country (2023 E)
Figure 156: East Asia Market Attractiveness Analysis by Form, 2023 to 2033
Figure 157: East Asia Market Attractiveness Analysis by Prescription Type, 2023 to 2033
Figure 158: East Asia Market Attractiveness Analysis by Route of Administration, 2023 to 2033
Figure 159: East Asia Market Attractiveness Analysis by Treatment, 2023 to 2033
Figure 160: East Asia Market Attractiveness Analysis by Distribution Channel, 2023 to 2033
Figure 161: East Asia Market Attractiveness Analysis by Country, 2023 to 2033
Figure 162: China Market Value Proportion Analysis, 2022
Figure 163: Global Vs. China Growth Comparison
Figure 164: China Market Share Analysis (%) by Form, 2023 and 2033
Figure 165: China Market Share Analysis (%) by Prescription Type, 2023 and 2033
Figure 166: China Market Share Analysis (%) by Route of Administration, 2023 and 2033
Figure 167: China Market Share Analysis (%) by Treatment, 2023 and 2033
Figure 168: China Market Share Analysis (%) by Distribution Channel, 2023 and 2033
Figure 169: Japan Market Value Proportion Analysis, 2022
Figure 170: Global Vs. Japan Growth Comparison
Figure 171: Japan Market Share Analysis (%) by Form, 2023 and 2033
Figure 172: Japan Market Share Analysis (%) by Prescription Type, 2023 and 2033
Figure 173: Japan Market Share Analysis (%) by Route of Administration, 2023 and 2033
Figure 174: Japan Market Share Analysis (%) by Treatment, 2023 and 2033
Figure 175: Japan Market Share Analysis (%) by Distribution Channel, 2023 and 2033
Figure 176: South Korea Market Value Proportion Analysis, 2022
Figure 177: Global Vs South Korea Growth Comparison
Figure 178: South Korea Market Share Analysis (%) by Form, 2023 and 2033
Figure 179: South Korea Market Share Analysis (%) by Prescription Type, 2023 and 2033
Figure 180: South Korea Market Share Analysis (%) by Route of Administration, 2023 and 2033
Figure 181: South Korea Market Share Analysis (%) by Treatment, 2023 and 2033
Figure 182: South Korea Market Share Analysis (%) by Distribution Channel, 2023 and 2033
Figure 183: South Asia Market Value (US$ Million) Analysis, 2018 to 2022
Figure 184: South Asia Market Value (US$ Million) Forecast, 2023 to 2033
Figure 185: South Asia Market Value Share, by Form (2023 E)
Figure 186: South Asia Market Value Share, by Prescription Type (2023 E)
Figure 187: South Asia Market Value Share, by Route of Administration (2023 E)
Figure 188: South Asia Market Value Share, by Treatment (2023 E)
Figure 189: South Asia Market Value Share, by Distribution Channel (2023 E)
Figure 190: South Asia Market Value Share, by Country (2023 E)
Figure 191: South Asia Market Attractiveness Analysis by Form, 2023 to 2033
Figure 192: South Asia Market Attractiveness Analysis by Prescription Type, 2023 to 2033
Figure 193: South Asia Market Attractiveness Analysis by Route of Administration, 2023 to 2033
Figure 194: South Asia Market Attractiveness Analysis by Treatment, 2023 to 2033
Figure 195: South Asia Market Attractiveness Analysis by Distribution Channel, 2023 to 2033
Figure 196: South Asia Market Attractiveness Analysis by Country, 2023 to 2033
Figure 197: India Market Value Proportion Analysis, 2022
Figure 198: Global Vs. India Growth Comparison
Figure 199: India Market Share Analysis (%) by Form, 2023 and 2033
Figure 200: India Market Share Analysis (%) by Prescription Type, 2023 and 2033
Figure 201: India Market Share Analysis (%) by Route of Administration, 2023 and 2033
Figure 202: India Market Share Analysis (%) by Treatment, 2023 and 2033
Figure 203: India Market Share Analysis (%) by Distribution Channel, 2023 and 2033
Figure 204: Indonesia Market Value Proportion Analysis, 2022
Figure 205: Global Vs. Indonesia Growth Comparison
Figure 206: Indonesia Market Share Analysis (%) by Form, 2023 and 2033
Figure 207: Indonesia Market Share Analysis (%) by Prescription Type, 2023 and 2033
Figure 208: Indonesia Market Share Analysis (%) by Route of Administration, 2023 and 2033
Figure 209: Indonesia Market Share Analysis (%) by Treatment, 2023 and 2033
Figure 210: Indonesia Market Share Analysis (%) by Distribution Channel, 2023 and 2033
Figure 211: Malaysia Market Value Proportion Analysis, 2022
Figure 212: Global Vs. Malaysia Growth Comparison
Figure 213: Malaysia Market Share Analysis (%) by Form, 2023 and 2033
Figure 214: Malaysia Market Share Analysis (%) by Prescription Type, 2023 and 2033
Figure 215: Malaysia Market Share Analysis (%) by Route of Administration, 2023 and 2033
Figure 216: Malaysia Market Share Analysis (%) by Treatment, 2023 and 2033
Figure 217: Malaysia Market Share Analysis (%) by Distribution Channel, 2023 and 2033
Figure 218: Thailand Market Value Proportion Analysis, 2022
Figure 219: Global Vs. Thailand Growth Comparison
Figure 220: Thailand Market Share Analysis (%) by Form, 2023 and 2033
Figure 221: Thailand Market Share Analysis (%) by Prescription Type, 2023 and 2033
Figure 222: Thailand Market Share Analysis (%) by Route of Administration, 2023 and 2033
Figure 223: Thailand Market Share Analysis (%) by Treatment, 2023 and 2033
Figure 224: Thailand Market Share Analysis (%) by Distribution Channel, 2023 and 2033
Figure 225: Oceania Market Value (US$ Million) Analysis, 2018 to 2022
Figure 226: Oceania Market Value (US$ Million) Forecast, 2023 to 2033
Figure 227: Oceania Market Value Share, by Form (2023 E)
Figure 228: Oceania Market Value Share, by Prescription Type (2023 E)
Figure 229: Oceania Market Value Share, by Route of Administration (2023 E)
Figure 230: Oceania Market Value Share, by Treatment (2023 E)
Figure 231: Oceania Market Value Share, by Distribution Channel (2023 E)
Figure 232: Oceania Market Value Share, by Country (2023 E)
Figure 233: Oceania Market Attractiveness Analysis by Form, 2023 to 2033
Figure 234: Oceania Market Attractiveness Analysis by Prescription Type, 2023 to 2033
Figure 235: Oceania Market Attractiveness Analysis by Route of Administration, 2023 to 2033
Figure 236: Oceania Market Attractiveness Analysis by Treatment, 2023 to 2033
Figure 237: Oceania Market Attractiveness Analysis by Distribution Channel, 2023 to 2033
Figure 238: Oceania Market Attractiveness Analysis by Country, 2023 to 2033
Figure 239: Australia Market Value Proportion Analysis, 2022
Figure 240: Global Vs. Australia Growth Comparison
Figure 241: Australia Market Share Analysis (%) by Form, 2023 and 2033
Figure 242: Australia Market Share Analysis (%) by Prescription Type, 2023 and 2033
Figure 243: Australia Market Share Analysis (%) by Route of Administration, 2023 and 2033
Figure 244: Australia Market Share Analysis (%) by Treatment, 2023 and 2033
Figure 245: Australia Market Share Analysis (%) by Distribution Channel, 2023 and 2033
Figure 246: New Zealand Market Value Proportion Analysis, 2022
Figure 247: Global Vs New Zealand Growth Comparison
Figure 248: New Zealand Market Share Analysis (%) by Form, 2023 and 2033
Figure 249: New Zealand Market Share Analysis (%) by Prescription Type, 2023 and 2033
Figure 250: New Zealand Market Share Analysis (%) by Route of Administration, 2023 and 2033
Figure 251: New Zealand Market Share Analysis (%) by Treatment, 2023 and 2033
Figure 252: New Zealand Market Share Analysis (%) by Distribution Channel, 2023 and 2033
Figure 253: Middle East & Africa Market Value (US$ Million) Analysis, 2018 to 2022
Figure 254: Middle East & Africa Market Value (US$ Million) Forecast, 2023 to 2033
Figure 255: Middle East & Africa Market Value Share, by Form (2023 E)
Figure 256: Middle East & Africa Market Value Share, by Prescription Type (2023 E)
Figure 257: Middle East & Africa Market Value Share, by Route of Administration (2023 E)
Figure 258: Middle East & Africa Market Value Share, by Treatment (2023 E)
Figure 259: Middle East & Africa Market Value Share, by Distribution Channel (2023 E)
Figure 260: Middle East & Africa Market Value Share, by Country (2023 E)
Figure 261: Middle East & Africa Market Attractiveness Analysis by Form, 2023 to 2033
Figure 262: Middle East & Africa Market Attractiveness Analysis by Prescription Type, 2023 to 2033
Figure 263: Middle East & Africa Market Attractiveness Analysis by Route of Administration, 2023 to 2033
Figure 264: Middle East & Africa Market Attractiveness Analysis by Treatment, 2023 to 2033
Figure 265: Middle East & Africa Market Attractiveness Analysis by Distribution Channel, 2023 to 2033
Figure 266: Middle East & Africa Market Attractiveness Analysis by Country, 2023 to 2033
Figure 267: GCC Countries Market Value Proportion Analysis, 2022
Figure 268: Global Vs GCC Countries Growth Comparison
Figure 269: GCC Countries Market Share Analysis (%) by Form, 2023 and 2033
Figure 270: GCC Countries Market Share Analysis (%) by Prescription Type, 2023 and 2033
Figure 271: GCC Countries Market Share Analysis (%) by Route of Administration, 2023 and 2033
Figure 272: GCC Countries Market Share Analysis (%) by Treatment, 2023 and 2033
Figure 273: GCC Countries Market Share Analysis (%) by Distribution Channel, 2023 and 2033
Figure 274: Türkiye Market Value Proportion Analysis, 2022
Figure 275: Global Vs. Türkiye Growth Comparison
Figure 276: Türkiye Market Share Analysis (%) by Form, 2023 and 2033
Figure 277: Türkiye Market Share Analysis (%) by Prescription Type, 2023 and 2033
Figure 278: Türkiye Market Share Analysis (%) by Route of Administration, 2023 and 2033
Figure 279: Türkiye Market Share Analysis (%) by Treatment, 2023 and 2033
Figure 280: Türkiye Market Share Analysis (%) by Distribution Channel, 2023 and 2033
Figure 281: South Africa Market Value Proportion Analysis, 2022
Figure 282: Global Vs. South Africa Growth Comparison
Figure 283: South Africa Market Share Analysis (%) by Form, 2023 and 2033
Figure 284: South Africa Market Share Analysis (%) by Prescription Type, 2023 and 2033
Figure 285: South Africa Market Share Analysis (%) by Route of Administration, 2023 and 2033
Figure 286: South Africa Market Share Analysis (%) by Treatment, 2023 and 2033
Figure 287: South Africa Market Share Analysis (%) by Distribution Channel, 2023 and 2033
Figure 288: North Africa Market Value Proportion Analysis, 2022
Figure 289: Global Vs North Africa Growth Comparison
Figure 290: North Africa Market Share Analysis (%) by Form, 2023 and 2033
Figure 291: North Africa Market Share Analysis (%) by Prescription Type, 2023 and 2033
Figure 292: North Africa Market Share Analysis (%) by Route of Administration, 2023 and 2033
Figure 293: North Africa Market Share Analysis (%) by Treatment, 2023 and 2033
Figure 294: North Africa Market Share Analysis (%) by Distribution Channel, 2023 and 2033
Figure 295: Israel Market Value Proportion Analysis, 2022
Figure 296: Global Vs Israel Growth Comparison
Figure 297: Israel Market Share Analysis (%) by Form, 2023 and 2033
Figure 298: Israel Market Share Analysis (%) by Prescription Type, 2023 and 2033
Figure 299: Israel Market Share Analysis (%) by Route of Administration, 2023 and 2033
Figure 300: Israel Market Share Analysis (%) by Treatment, 2023 and 2033
Figure 301: Israel Market Share Analysis (%) by Distribution Channel, 2023 and 2033
The seasonal allergy market is anticipated to go up from USD 1.22 billion in 2023 to USD 2.58 billion by 2033, exhibiting a CAGR of 7.8%.
With a 5.7% CAGR between 2018 and 2022, the seasonal allergy market size reached USD 1.15 billion in 2022.
Given its prevalent allergenic flora and demand for effective treatments, the United States stands as the dominant market for seasonal allergy products.
Seasonal allergy market trends include rising allergen sensitization, personalized treatment demand, and improved allergy management methods.
Prominent market players such as Merck KGaA, Johnson & Johnson, Allergopharma, Sanofi SA, McNeil Consumer Healthcare, and Genentech Inc. dominate the seasonal allergy market.
Explore Therapy Area Insights
Thank you!
You will receive an email from our Business Development Manager. Please be sure to check your SPAM/JUNK folder too.