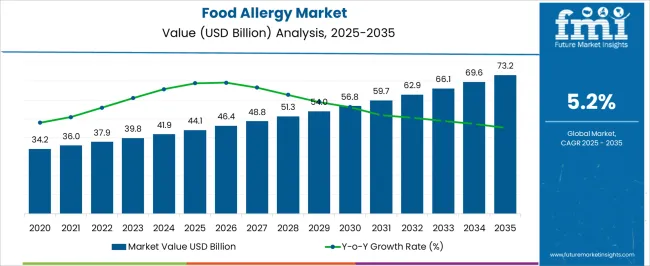
The Food Allergy Market is estimated to be valued at USD 44.1 billion in 2025 and is projected to reach USD 73.2 billion by 2035, registering a compound annual growth rate (CAGR) of 5.2% over the forecast period.
| Metric | Value |
|---|---|
| Food Allergy Market Estimated Value in (2025 E) | USD 44.1 billion |
| Food Allergy Market Forecast Value in (2035 F) | USD 73.2 billion |
| Forecast CAGR (2025 to 2035) | 5.2% |
The food allergy market is witnessing sustained growth as rising prevalence of allergic conditions, increasing awareness of food-related anaphylaxis, and enhanced diagnostic capabilities reshape patient care and management practices. Regulatory emphasis on allergen labeling and growing advocacy for safer food environments have further accelerated adoption of targeted therapies and preventive measures.
Advancements in immunotherapy techniques and introduction of innovative treatment modalities have expanded the scope of care beyond symptomatic relief, paving the way for improved patient outcomes. Hospitals and specialty clinics are strengthening their capacity to manage complex cases, and pharmaceutical innovation continues to introduce therapies with better efficacy and safety profiles.
The future trajectory of the market is expected to benefit from increased investment in research and development, broader screening programs, and deeper integration of food allergy management into primary care settings, reinforcing the momentum toward widespread and standardized treatment pathways.
The market is segmented by Allergen Source, Treatment, and End-use and region. By Allergen Source, the market is divided into Peanut, Gluten, Mustard, Milk, Egg, Fish, and Others. In terms of Treatment, the market is classified into Antihistamines, Adrenaline, Oral Immunotherapy, and Others. Based on End-use, the market is segmented into Hospitals, Clinics, and Ambulatory Surgery Centers. Regionally, the market is classified into North America, Latin America, Western Europe, Eastern Europe, Balkan & Baltic Countries, Russia & Belarus, Central Asia, East Asia, South Asia & Pacific, and the Middle East & Africa.
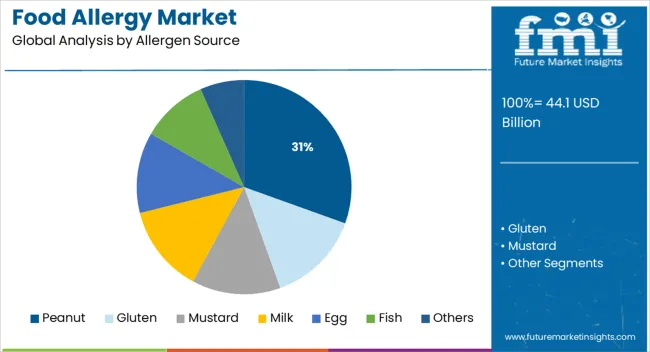
When segmented by allergen source, the peanut segment is projected to account for 30.5% of the total market revenue in 2025, affirming its position as the leading allergen category. This dominance has been shaped by the high prevalence and severity of peanut allergies, which often manifest as life-threatening reactions requiring immediate medical intervention.
Food labeling regulations and heightened consumer awareness have intensified demand for precise diagnostics and effective management solutions targeted at peanut sensitization. Clinical focus on this allergen has been reinforced by its disproportionate contribution to pediatric and adult anaphylaxis cases, prompting substantial investment in desensitization therapies and emergency response preparedness.
The persistent nature of peanut allergy across age groups and its significant public health impact have cemented its prominence within the overall food allergy landscape.
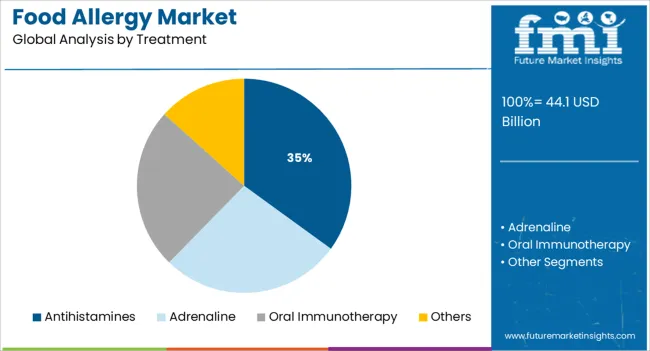
In terms of treatment, antihistamines are expected to hold 35.0% of the market revenue in 2025, positioning them as the most utilized therapy option. This leadership has been influenced by their wide availability, cost effectiveness, and proven efficacy in alleviating mild to moderate allergic symptoms such as urticaria, itching, and rhinitis.
Their inclusion in clinical guidelines and over-the-counter accessibility have facilitated broad adoption among patients and healthcare providers alike. Additionally, the ability of antihistamines to provide rapid symptomatic relief has reinforced their role as a first-line intervention in acute episodes, particularly in non-severe reactions.
Continued advancements in second-generation formulations with improved safety profiles and longer duration of action have further strengthened the segment’s standing within the treatment paradigm.
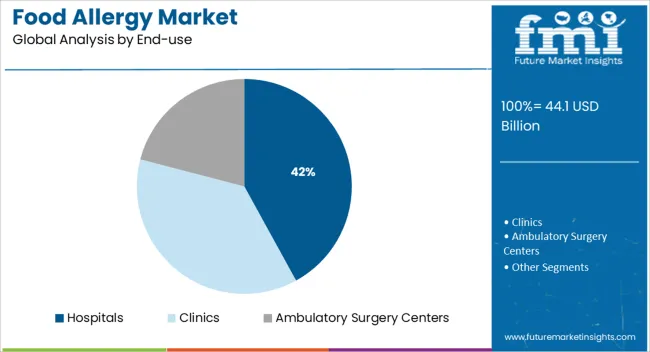
Segmenting by end use reveals that hospitals are projected to capture 42.0% of the food allergy market revenue in 2025, maintaining their position as the foremost care setting. This leadership has been driven by their comprehensive infrastructure, multidisciplinary expertise, and capacity to manage severe allergic reactions including anaphylaxis.
Hospitals have increasingly prioritized allergy units and emergency preparedness protocols, enabling timely and effective interventions. The ability to perform confirmatory diagnostics, administer advanced therapies, and provide continuous monitoring has made hospitals the preferred destination for both acute and complex cases.
Growing patient confidence in hospital-based care and institutional focus on quality outcomes have further solidified this segment’s dominance, underscoring its central role in managing the rising burden of food allergies.
According to FMI, food allergy sales grew at a CAGR of 4.8% in the historical period 2020 to 2025. Kids are increasingly suffering from food allergies, which is the latest epidemic of the current generation.
Several allergen-specific and non-specific therapies are under investigation as potential treatment options for people suffering from food allergies; however, in terms of therapeutic outcomes, immunotherapy has been identified as the most promising treatment option for individuals who suffer from food allergies to date.
Providing an overview of recent developments in the treatment of food allergies is the objective of this review.
Anaphylaxis is still an unpredictable possibility with food allergies, which continue to increase in prevalence.
There are fewer treatment options available, even though diagnostic accuracy is improving. Allergy management relies on avoiding offending allergens and educating patients on how to manage them. Although precautions and vigilance are taken, accidental ingesting continues.
Recent advancements made in the study of humoral and cellular immune responses and tolerance mechanisms in food allergy have led to the development of several therapeutic strategies to treat food allergies in an effort to cure or remit them long term.
Accordingly, the market for food allergy is projected to grow at a CAGR of 5.2% between 2025 and 2035.
According to research, asthma incidences are expected to rise from 2025 to 2035. Allergies to food commonly coexist with asthma. There is a greater likelihood that food allergies and asthma symptoms will become severe under these circumstances.
The food allergy market growth rate is also influenced by rising healthcare expenditures that help improve its infrastructure. The government is also increasing funding for healthcare infrastructure, which will impact the dynamics of the market even further.
Across the globe, both children and adults are experiencing an increase in food allergies. With the increase in allergic diseases, it is likely that the demand for preventative and therapeutic measures for food allergies will increase.
Additionally, 2/5th of the overall demand for allergy care is likely to be driven by an increased focus on research and development to offer advanced products to consumers.
In recent years, there has been an increase in allergies and awareness about food disorders that has forced the food industry and restaurants to follow regulatory norms in order to serve the nation.
Gluten-free and dairy-free foods are an increase in demand on the market because both dietary programs and increasing awareness of food allergies among consumers have contributed to this demand.
Modern Medicine's Approach to Treat Food Allergies
The number of activities involved in research and development has increased over the past few years. Furthermore, the expansion of the market is largely due to the increased participation in research and development activities in the market.
As a result, the food allergy market will have many opportunities for growth in the future. Drug approvals and launches will continue to drive the market's growth.
Food allergy market growth will also be positively impacted by increased investment in modern technologies and the emergence of new markets.
In recent years, there has been a great deal of progress in understanding immunological mechanisms behind allergic disease, as well as a great deal of progress in identifying food allergens, which may lead to new therapeutic approaches.
Researchers are currently looking into several forms of immunomodulation therapies, including peptide immunotherapy, mutant protein immunotherapy, allergy DNA vaccination, immunostimulatory DNA vaccination, and anti-immunoglobulin E (anti-IgE).
A lack of awareness regarding allergic conditions often leads to underdiagnosis and underestimation of these conditions, despite their high prevalence. In addition, inaccurate test results may negatively impact the growth of the food allergy market in the future.
A lack of uniformity in diagnostic criteria greatly limits the evidence for food allergy prevalence and management.
Furthermore, the delay in the issuance of the results will negatively impact the growth of the market, as well as the fact that it involves a large volume of blood for multiple tests, which is hard for younger children and will hamper the growth.
A large price tag for the tests, as well as the absence of allergy tests, are the main concerns affecting the market. Despite this, organizations like the European Federation of Allergy and Airway Diseases Patients Associations (EFA) have introduced a lot of campaigns aimed at boosting food allergy awareness in the market.
New Entrants Bring Positive Changes to the Food Allergy Landscape
New entrants are capitalizing on technological advances in the food allergy field to introduce new solutions and gain a competitive edge in the market.
These companies constantly invest in research and development to stay ahead of changing consumer preferences. The company is striving to advance the food allergy market and improve its position in the forum.
According to the forecast, North America is likely to account for 43% of global food allergy treatments. Several factors are responsible for this dominance, including a large number of patients, advancements in food allergy treatment, and a high level of awareness regarding food allergies and treatment.
The development of new food allergy treatments and the development of new drugs in the USA market will further widen the market for food allergy treatments.
As a result of the recent approval of oral immunotherapy (OIT) by the Food and Drug Administration (FDA), patients with peanut allergies can now benefit from this treatment, while patients with mild reactions are not suitable for this treatment.
A study published in JAMA Network Open Journal found that 10.8% of adults in the survey were food allergic, while nearly 17% believed they were. Food allergies are prevalent among nearly half of the adult population, and 38% of them have been to an emergency room as a result of food allergies.
Researchers at the American College of Allergy, Asthma, and Immunology (ACAAI) published a study in the scientific journal Annals of Allergy, Asthma, and Immunology that found targeted cognitive behavioral therapy (CBT) to significantly reduce anxiety associated with food allergies (FAA).
According to the estimate, the European region is expected to dominate the market. The revenue generated from this region accounts for 36% of the total revenue generated worldwide.
Many people in the region suffer from allergies, which accounts for the region's dominance in the food allergy market. Food allergies affect over 150 million people worldwide, representing 20 percent of the region's population, according to the European Academy of Allergy and Clinical Immunology (EAACI).
Children and adults with food allergies are reported to be affected by food allergies at a rate ranging from 3-4%, respectively. Over 17 million Europeans suffer from allergies related to food, according to the European Academy of Allergy and Clinical Immunology.
Over the past decade, the number of children who have been admitted to the hospital for severe reactions has increased by 7X.
In addition to minimizing the occurrence of food allergic reactions caused by undeclared allergens, the Joint Research Centre (JRC) of the European Commission has several other objectives.
As Europeans become more aware of their allergies to certain foods and stricter compliance with regulatory requirements, the European food allergen testing market continues to grow.
Based on allergen sources, the market is segmented into gluten, peanut, mustard, milk, egg, fish, and other food allergy market. FMI predicts that peanuts allergen sources will dominate the market throughout the projection period. Peanut food allergy dominates more than 25% of the market.
The increasing prevalence of peanut allergies is a major factor driving the peanut allergy market. Furthermore, research is steadily being conducted to develop individual allergen immunotherapies (AIT) that can help in achieving allergen neutralization in less time with minimal side effects.
Additionally, pharma and biotech companies are strongly inclining toward discovering new immunotherapies for peanut allergy, which is significantly driving the market growth.
In recent years, peanut allergy treatment and management have advanced dramatically. To desensitize an individual to allergens, new research is exploring oral immunotherapy, which gradually increases the amount of allergen a person is exposed to.
A number of studies have also been conducted investigating the potential reduction in peanut allergy risk by using probiotics, allergen-specific immunotherapy, and gene therapy. A new diagnostic test that is more accurate and less invasive will be developed, as well as biomarkers specific to peanut allergy that can be located.
Food allergies are not uncommon. Approximately 17 million Europeans suffer from food allergies each year, of whom 3.5 million are under 25 years old, according to the European Federation of Allergy and Airways Diseases Patients Associations (EFA).
Most children are allergic to peanuts and peanut allergy is the most common cause of food allergy death.
Based on treatment type, the food allergy market is segmented into antihistamines treatment. The oral immunotherapy segment is expected to represent 22% of the market and grow at a CAGR of 3.6% during the evaluation period.
Research and development efforts are being conducted for the trials to develop proven methods for maximizing benefits and minimizing potential harm.
A strict avoidance of confirmed food allergens is recommended for the management of food allergy until food allergy OIT and other treatments have been proven to be reliable, safe, standardized, and approved for routine use in Australia (TGA) or New Zealand (Medsafe).
In childhood and adolescence with peanut allergy (PA), oral immunotherapy with Palforzia (POIT) aims to mitigate accidental allergic reactions. This therapy is a relatively new approach, so it's hard to know how many patients and families will choose it over strict avoidance.
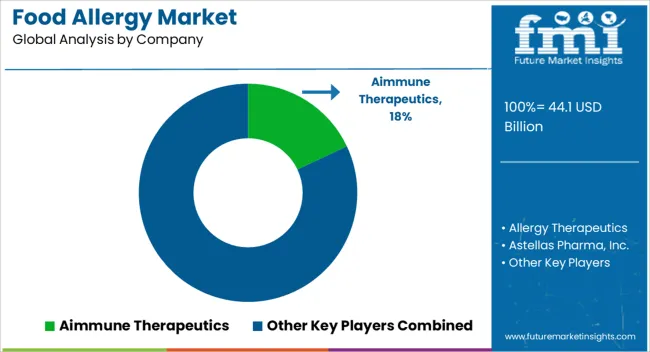
Several domestic and regional players participate in the global food allergy market, which is highly fragmented and competitive. Mergers and acquisitions, expansions, collaborations, and partnerships are among the marketing strategies used by key players.
A company's marketing strategy can also be upscaled by developing new products. The implementation of these strategies has led to the development of advanced food allergy products.
Vionic, FARE's new partner, supports education and research to benefit people with life-threatening food allergies. In the year-end campaign, Future Starts Now, FARE is targeting to raise USD 1 million to achieve its goal of raising USD 220,000.
FARE and Vionic signed an official Partner Agreement in the fall of 2025. By collaborating with FARE, Vionic is improving the lives and health of people who suffer from food allergies. With this partnership, FARE will expand awareness and support of its strategic campaigns aimed at benefitting individuals with food allergies.
A new investor, Edward-Elmhurst Health, led a funding round for childhood food allergy prevention start-up Ready, Set, Food.
In addition to Danone's corporate venture arm, Danone Manifesto Ventures, as well as entrepreneur Mark Cuban and AF Ventures (formerly AccelFoods), there are returning investors this year as well. After raising USD 3 million in July of last year, Ready, Set Food raised another USD 3 million in less than a year.
| Report Attribute | Details |
|---|---|
| Market Value in 2025 | USD 44.1 billion |
| Market Value in 2035 | USD 73.2 billion |
| Growth Rate | CAGR of 5.2% from 2025 to 2035 |
| Base Year for Estimation | 2025 |
| Historical Data | 2020 to 2025 |
| Forecast Period | 2025 to 2035 |
| Quantitative Units | Revenue in USD Billion and CAGR from 2025 to 2035 |
| Report Coverage | Revenue Forecast, Company Ranking, Competitive Landscape, Growth Factors, Trends, and Pricing Analysis |
| Segments Covered | Allergen Source, Treatment, End Use, Region |
| Regions Covered | USA; Canada; Brazil; Mexico; Germany; UK; France; Spain; Italy; China; Japan; South Korea; Singapore; Thailand; Indonesia; Australia; New Zealand; GCC; South Africa; Israel; North America; Latin America; Europe; Asia Pacific; Middle East & Africa |
| Key Countries Profiled | USA, Canada, Brazil, Mexico, Germany, UK, France, Spain, Italy, China, Japan, South Korea, Singapore, Thailand, Indonesia, Australia, New Zealand, GCC, South Africa, Israel |
| Key Companies Profiled | Allergy Therapeutics; Astellas Pharma Inc.; Immunomic Therapeutics Inc.; Prota Therapeutics; Aimmune Therapeutics; Aravex; Cambridge Allergy Ltd.; ALS Limited; Charm Sciences; Danaher Corporation |
| Customization | Available Upon Request |
The global food allergy market is estimated to be valued at USD 44.1 billion in 2025.
The market size for the food allergy market is projected to reach USD 73.2 billion by 2035.
The food allergy market is expected to grow at a 5.2% CAGR between 2025 and 2035.
The key product types in food allergy market are peanut, gluten, mustard, milk, egg, fish and others.
In terms of treatment, antihistamines segment to command 35.0% share in the food allergy market in 2025.


Full Research Suite comprises of:
Market outlook & trends analysis
Interviews & case studies
Strategic recommendations
Vendor profiles & capabilities analysis
5-year forecasts
8 regions and 60+ country-level data splits
Market segment data splits
12 months of continuous data updates
DELIVERED AS:
PDF EXCEL ONLINE
Food Allergy Immunotherapy Market Analysis Size and Share Forecast Outlook 2025 to 2035
Food & Beverage OEE Software Market Size and Share Forecast Outlook 2025 to 2035
Food Grade Crosslinked Polyvinylpolypyrrolidone (PVPP) Market Size and Share Forecast Outlook 2025 to 2035
Food Grade Cassia Gum Powder Market Size and Share Forecast Outlook 2025 to 2035
Food Grade Dry Film Lubricant Market Size and Share Forecast Outlook 2025 to 2035
Foodservice Equipment Market Analysis - Size, Share, and Forecast Outlook 2025 to 2035
Food Basket Market Forecast and Outlook 2025 to 2035
Food Grade Tremella Polysaccharide Market Size and Share Forecast Outlook 2025 to 2035
Food Sorting Machine Market Size and Share Forecast Outlook 2025 to 2035
Foodservice Paper Bag Market Size and Share Forecast Outlook 2025 to 2035
Food Stabilizers Market Size and Share Forecast Outlook 2025 to 2035
Food Packaging Film Market Size and Share Forecast Outlook 2025 to 2035
Food Certification Market Size and Share Forecast Outlook 2025 to 2035
Food Tray Market Size and Share Forecast Outlook 2025 to 2035
Food & Beverage Industrial Disinfection and Cleaning Market Size and Share Forecast Outlook 2025 to 2035
Food Technology Market Size and Share Forecast Outlook 2025 to 2035
Food Tourism Sector Market Size and Share Forecast Outlook 2025 to 2035
Food Processing Boiler Market Size and Share Forecast Outlook 2025 to 2035
Food Packaging Machines Market Size and Share Forecast Outlook 2025 to 2035
Food Minerals Market Size and Share Forecast Outlook 2025 to 2035

Thank you!
You will receive an email from our Business Development Manager. Please be sure to check your SPAM/JUNK folder too.
Chat With
MaRIA