Seaweed-Based Anti-Aging Ingredients Market Size and Share Forecast Outlook 2025 to 2035

A valuation of USD 1,803.1 million has been projected for the seaweed-based anti-aging ingredients market in 2025, which is expected to rise to USD 5,806.7 million by 2035. This growth reflects an absolute increase of USD 4,003.6 million, equating to a market expansion of over 193% during the period. The overall trend translates into a CAGR of 12.4%, signifying robust, sustained momentum across global regions and applications.
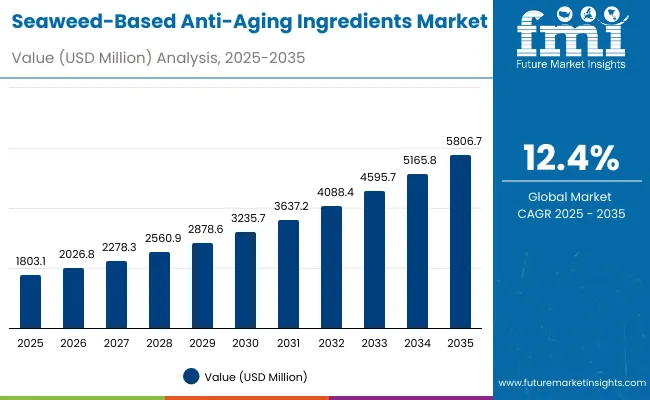
Quick Stats for Seaweed-Based Anti-Aging Ingredients Market

  • Market Value (2025): USD 1,803.1 Million
  • Forecast Value (2035): USD 5,806.7 Million
  • Forecast CAGR (2025 to 2035): 12.4%
  • Leading Segment in 2025: Anti-aging & firming (55.6%)
  • Key Growth Regions: Asia-Pacific (China, India, Japan), Europe, North America
  • Top Key Players: Algatech, Codif, Solabia, Greentech, Marinova, Ashland, BASF, Croda, Seppic, Givaudan

Seaweed Based Anti Aging Ingredients Market

Seaweed-Based Anti-Aging Ingredients Market Key Takeaways

Metric Value
Seaweed-Based Anti-Aging Ingredients Market Estimated Value in (2025E) USD 1,803.1 million
Seaweed-Based Anti-Aging Ingredients Market Forecast Value in (2035F) USD 5,806.7 million
Forecast CAGR (2025 to 2035) 12.40%

From 2025 to 2030, market value is estimated to climb from USD 1,803.1 million to USD 3,235.7 million, generating USD 1,432.6 million in additional revenue. This contribution accounts for 35.8% of the total decade growth. The period is anticipated to be characterized by steady adoption of marine-derived actives, supported by growing consumer inclination toward natural and sustainable skincare solutions. Anti-aging & firming functions, projected to hold 55.6% share in 2025, are expected to drive strong demand due to proven efficacy in skin tightening and wrinkle reduction. Brown algae-based ingredients, forecast at 49.5% share in 2025, are anticipated to lead the source category given their antioxidant-rich profile.

Between 2030 and 2035, growth is forecast to accelerate, with market size increasing from USD 3,235.7 million to USD 5,806.7 million, contributing USD 2,571.0 million, which equals 64.2% of total expansion. This phase is expected to be fueled by advanced biotechnology-based extraction methods and wider consumer acceptance of marine biotech claims, which are projected at 52.5% share in 2025. Expanding applications across premium skincare portfolios and heightened demand in high-growth economies such as China and India are anticipated to reinforce this trajectory.

From 2020 to 2024, momentum for marine-derived actives had been steadily established as consumer demand for clean-label and natural skincare accelerated. The adoption of seaweed-based ingredients was driven primarily by their recognized efficacy in firming, hydration, and wrinkle reduction. During this period, competition was highly fragmented, with biotechnology-focused suppliers and marine extraction specialists holding a dominant influence.

By 2025, demand is projected to advance to USD 1,803.1 million, marking a turning point as brown algae and marine biotech claims emerge as decisive differentiators. Over the decade to 2035, the market is forecast to reach USD 5,806.7 million, with significant growth concentrated in Asia-Pacific, where China and India are projected to post the fastest CAGRs at 20.1% and 22.7% respectively. The competitive landscape is expected to evolve as sustainability credentials, biotechnology-driven innovation, and clinical validation become the pillars of market leadership. Industry players are anticipated to pursue advanced extraction technologies, partnerships in biotech, and premium positioning to secure competitive advantage.

Why the Seaweed-Based Anti-Aging Ingredients Market is growing?

Growth in the seaweed-based anti-aging ingredients market is being fueled by rising consumer preference for natural, sustainable, and marine-derived skincare solutions. Increasing recognition of the efficacy of seaweed extracts in improving skin firmness, reducing wrinkles, and enhancing hydration has been widely acknowledged, driving adoption across premium beauty portfolios. Clean-label trends and regulatory encouragement for safe, traceable ingredients are reinforcing this momentum. Biotechnology-driven extraction methods are being advanced to enhance purity and performance, positioning marine biotech claims as a core driver of long-term demand. Expanding middle-class populations in Asia-Pacific, particularly in China and India, are contributing significantly through heightened awareness of natural beauty products and higher disposable incomes. In mature markets such as North America and Europe, demand is being strengthened by innovation in cosmeceuticals and clinical validations of seaweed actives. With sustainability and transparency becoming essential purchase criteria, the market is expected to witness accelerated growth over the next decade.

Segmental Analysis

The seaweed-based anti-aging ingredients market has been segmented across multiple parameters to highlight the core growth drivers. By function, the market is divided into anti-aging & firming and others, reflecting the diverse benefits offered by marine-derived actives. By claim, the focus is placed on marine biotech and others, showcasing the rising prominence of biotechnology-led extraction processes and their impact on product positioning. By source, the market is categorized into brown algae and others, underlining the specific types of algae that are being leveraged for skincare applications.

Each of these segments is expected to demonstrate distinctive growth momentum. Anti-aging & firming functions are anticipated to dominate due to clinically validated efficacy, while marine biotech claims are projected to gain traction as sustainability and innovation become decisive factors. Brown algae are forecast to hold the leading share in the source category, supported by their rich antioxidant properties and proven effectiveness in skin protection.
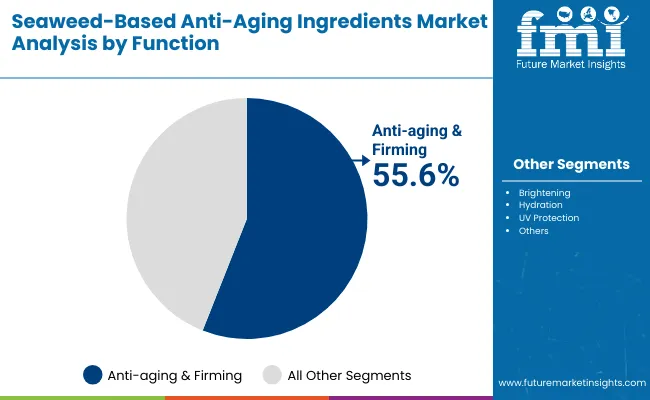
Insights into the Function Segment with Anti-Aging & Firming Leading in Market Share

Seaweed Based Anti Aging Ingredients Market By Function

Segment Market Value Share, 2025
Anti-aging & firming 55.6%
Others 44.4%

The function segment is expected to be led by anti-aging & firming, projected at 55.6% share in 2025 with USD 1,000.3 million in revenue. Strong consumer trust in marine-derived actives for wrinkle reduction, skin elasticity, and firmness has reinforced this dominance. Demand has been shaped by a growing shift toward natural alternatives to synthetic ingredients, with seaweed extracts positioned as clinically backed solutions. Others, holding 44.4% share valued at USD 801.38 million, are forecast to remain important contributors as hydration and brightening gain relevance in multi-functional skincare. Continuous innovation in bioactive formulations and cosmeceutical adoption is anticipated to strengthen the overall outlook, with anti-aging & firming retaining its leadership role throughout the forecast horizon.
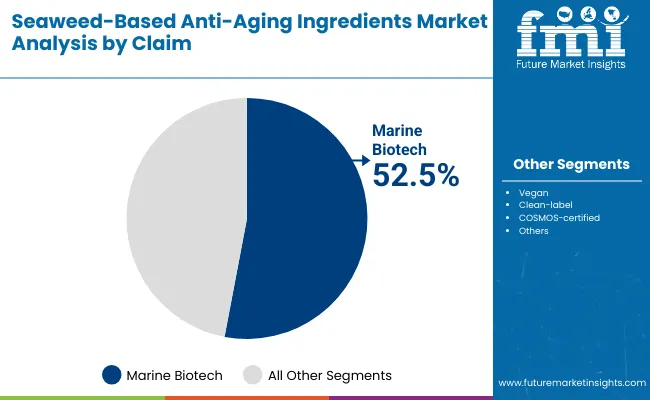
Insights into the Claim Segment with Marine Biotech Dominating the Demand

Seaweed Based Anti Aging Ingredients Market By Claim

Segment Market Value Share, 2025
Marine biotech 52.5%
Others 47.5%

Marine biotech claims are projected to hold 52.5% share in 2025, equal to USD 945.5 million, establishing them as the leading claim category. The segment’s strength has been derived from rising awareness of advanced extraction techniques that enhance ingredient purity and efficacy. Biotechnology-driven processes are being increasingly favored by both formulators and consumers, as they align with clean-label standards and sustainability expectations. Other claims, representing 47.5% share and USD 856.02 million, are forecast to retain steady demand due to widespread application in traditional skincare lines. The growing consumer emphasis on science-backed natural products is anticipated to further elevate marine biotech positioning, solidifying its dominance in the market over the coming decade.
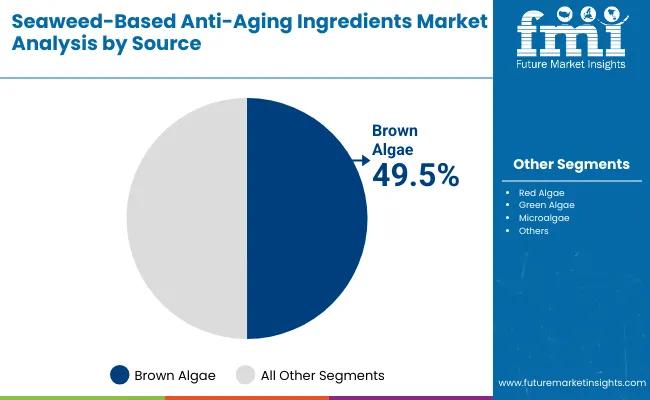
Insights into the Source Segment with Brown Algae Leading the Adoption

Seaweed Based Anti Aging Ingredients Market By Source

Segment Market Value Share, 2025
Brown algae 49.5%
Others 50.5%

Brown algae are expected to capture 49.5% share of the market in 2025, valued at USD 890.9 million, reinforcing their role as the most prominent source. Their high antioxidant concentration and proven anti-inflammatory properties have driven consistent preference among formulators and consumers. The ability of brown algae to protect skin from oxidative stress has positioned them as a natural alternative to synthetic anti-aging ingredients. Others, holding 50.5% share at USD 910.66 million, are anticipated to remain highly relevant as red algae, green algae, and microalgae find growing applications in skincare formulations. Continuous expansion of clinical research supporting algae-based efficacy is expected to further strengthen brown algae’s leadership within the source segment.

What are the Drivers, Restraints, and Key Trends of the Seaweed-Based Anti-Aging Ingredients Market?

Complex supply chain dependencies and stringent regulatory benchmarks are shaping the dynamics of the seaweed-based anti-aging ingredients market, even as innovations in biotechnology and sustainability commitments strengthen adoption across skincare industries seeking clinically validated and eco-conscious formulations.

Advancement in Marine Biotechnology

The growth trajectory of the seaweed-based anti-aging ingredients market is being reinforced by breakthroughs in marine biotechnology that allow extraction of bioactives with higher purity and potency. Precision fermentation and enzymatic processing techniques are being employed to unlock compounds previously difficult to isolate at scale. This development is enhancing ingredient efficacy while lowering contamination risks, ensuring compliance with evolving safety regulations. Over the next decade, such advances are expected to redefine product formulations, positioning seaweed-derived actives as premium solutions within both cosmeceutical and dermocosmetic categories. The convergence of biotechnology and marine sciences is therefore anticipated to be a decisive catalyst for long-term growth.

Integration of Sustainability Metrics into Consumer Value Propositions

The market is being transformed by a shift in purchasing behavior where sustainability has been elevated from a supporting attribute to a primary value determinant. Brands are being increasingly evaluated on their ability to demonstrate transparent sourcing, carbon-conscious extraction processes, and traceable supply chains. Seaweed-based ingredients are being positioned favorably as naturally regenerative resources, yet credibility is now being measured through verifiable certifications and lifecycle assessments. This trend is driving companies to adopt circular economy frameworks and invest in ocean stewardship initiatives to reinforce brand trust. The embedding of sustainability metrics into marketing narratives is expected to become a critical differentiator, shaping competitive landscapes over the forecast horizon.
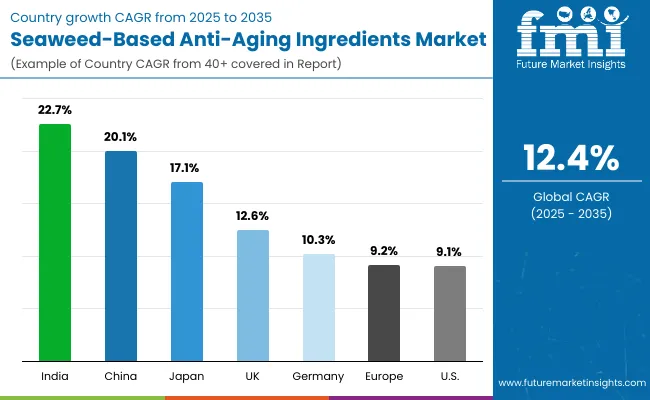
Analysis of Seaweed-Based Anti-Aging Ingredients Market By Key Countries

Country Wise Analysis Seaweed Based Anti Aging Ingredients Market

Countries CAGR
China 20.1%
USA 9.1%
India 22.7%
UK 12.6%
Germany 10.3%
Japan 17.1%

The global seaweed-based anti-aging ingredients market has been projected to expand unevenly across key countries, with growth dynamics strongly influenced by biotechnology innovation, sustainability mandates, and consumer preferences for natural skincare. Asia-Pacific is anticipated to emerge as the fastest-growing region, with India recording the highest CAGR of 22.7% during 2025-2035. Rapidly expanding middle-class populations, coupled with increasing awareness of marine-derived actives, are expected to support this trajectory. China, with a CAGR of 20.1%, is positioned as another powerhouse, where strong domestic supply capabilities and demand for premium beauty products are projected to reinforce market leadership.

Japan, with an estimated CAGR of 17.1%, is forecast to leverage advanced R&D and consumer inclination toward science-backed formulations, enhancing its competitive strength in the regional landscape. In Europe, the UK (12.6%) and Germany (10.3%) are expected to show steady progress, driven by stringent compliance standards and strong clean-label adoption across personal care portfolios. The USA, with a more moderate CAGR of 9.1%, reflects a mature yet evolving market, where innovation in cosmeceuticals and biotechnology collaborations are expected to underpin future growth. Collectively, these countries are anticipated to drive sustained momentum, shaping the decade-long outlook for seaweed-based anti-aging ingredients.
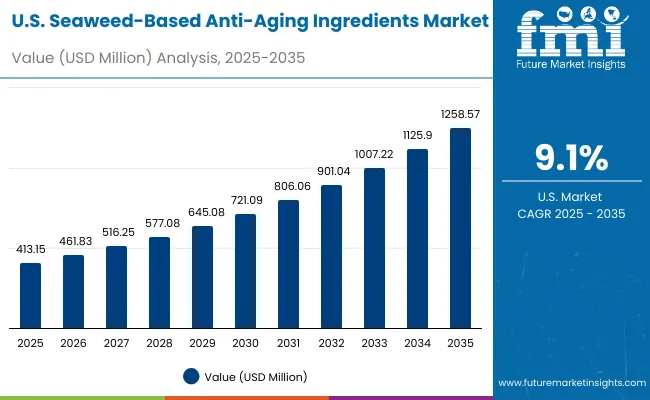
Sales Outlook for Seaweed-Based Anti-Aging Ingredients in the United States

Usa Seaweed Based Anti Aging Ingredients Market

Year USA Seaweed-Based Anti-Aging Ingredients Market (USD Million)
2025 413.15
2026 461.83
2027 516.25
2028 577.08
2029 645.08
2030 721.09
2031 806.06
2032 901.04
2033 1,007.22
2034 1,125.90
2035 1,258.57

The Seaweed-Based Anti-Aging Ingredients Market in the United States is projected to grow at a CAGR of 12.0%, led by expanding demand for marine-derived actives in premium skincare and cosmeceutical applications. A consistent year-on-year increase has been observed in anti-aging & firming formulations, supported by consumer trust in clinically validated seaweed extracts. The healthcare-aligned beauty segment, particularly dermocosmetics, has been integrating these ingredients into advanced product lines for targeted skin treatments. Adoption is also expanding in clean-label beauty portfolios, where seaweed-based claims resonate strongly with eco-conscious consumers. Regulatory momentum toward safe, traceable ingredients and the rise of biotechnology-enhanced extraction methods are creating opportunities for premium positioning and long-term brand differentiation in the USA

  • Anti-aging & firming functions remain the dominant application, driven by proven efficacy in skin tightening and wrinkle reduction.
  • Marine biotech claims are gaining traction as biotechnology-led extraction ensures higher purity and sustainability alignment.
  • Clean-label certifications are being prioritized, with traceable sourcing and eco-conscious branding reinforcing consumer confidence.

Growth and Expansion Outlook for Seaweed-Based Anti-Aging Ingredients Market in the United Kingdom

The Seaweed-Based Anti-Aging Ingredients Market in the United Kingdom is projected to grow at a CAGR of 12.6% during 2025-2035, supported by rising consumer preference for natural skincare with clinically validated efficacy. The UK beauty industry has been increasingly shaped by clean-label adoption, where seaweed extracts are positioned as sustainable alternatives to synthetic actives. Demand is expected to be reinforced by premium skincare brands investing in marine-derived solutions that address anti-aging and hydration. Regulatory scrutiny over ingredient transparency is also anticipated to drive wider uptake of certified seaweed-based actives.

  • Clean-label beauty is gaining strength, with marine extracts seen as compliant with ethical sourcing standards.
  • Premium skincare portfolios are incorporating seaweed as core anti-aging components.
  • Regulatory focus on sustainability and transparency is expected to elevate adoption.
  • Innovation in biotech-based claims is set to differentiate market offerings.

Growth and Expansion Outlook for Seaweed-Based Anti-Aging Ingredients Market in India

The Seaweed-Based Anti-Aging Ingredients Market in India is expected to expand at a CAGR of 22.7% from 2025 to 2035, making it the fastest-growing country globally. This rapid growth is being fueled by a rising middle-class population, increased disposable incomes, and heightened awareness of marine-derived skincare benefits. Domestic supply strengths, coupled with the adoption of biotechnology-enabled extraction methods, are expected to position India as a hub for both consumption and production. Local brands are forecast to integrate seaweed-based actives into affordable beauty lines while premium categories expand in urban centers.

  • High CAGR (22.7%) reflects strong domestic demand growth.
  • Local sourcing potential supports cost efficiency and scalability.
  • Urban consumer bases are driving premium skincare adoption.
  • Biotech partnerships are anticipated to reinforce long-term product innovation.

Sales Outlook for Seaweed-Based Anti-Aging Ingredients in China

The Seaweed-Based Anti-Aging Ingredients Market in China is forecast to register a CAGR of 20.1% between 2025 and 2035, placing it among the leading growth markets. Expanding demand for premium and cosmeceutical formulations is expected to reinforce adoption. With advanced R&D and strong government backing for biotechnology, China is anticipated to dominate global supply and innovation in marine actives. Rising consumer awareness of sustainability and clinical validation has created opportunities for brands that integrate seaweed-based actives into high-performance skincare.
  • Premium cosmeceutical demand is strengthening market adoption.
  • Government support for biotechnology is reinforcing innovation.
  • Sustainability-driven consumers are shaping product development.
  • China’s scale positions it as a global leader in seaweed-based skincare.

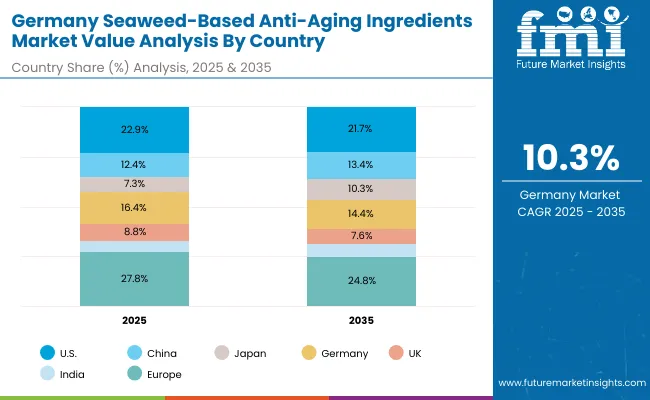
In-depth Analysis of Seaweed-Based Anti-Aging Ingredients in Germany

Germony Seaweed Based Anti Aging Ingredients Market By Country

Countries 2025
USA 22.9%
China 12.4%
Japan 7.3%
Germany 16.4%
UK 8.8%
India 5.5%
Countries 2035
USA 21.7%
China 13.4%
Japan 10.3%
Germany 14.4%
UK 7.6%
India 6.2%

The Seaweed-Based Anti-Aging Ingredients Market in Germany is expected to grow at a CAGR of 10.3% during 2025 to 2035, driven by strong alignment with Europe’s clean-label and sustainability regulations. German consumers have been prioritizing natural, eco-certified skincare products, where seaweed-derived actives are well positioned. Innovation in dermo cosmetics and clinical testing standards is anticipated to elevate demand, particularly in pharmacy-led distribution channels. Partnerships between biotech firms and beauty companies are also forecast to support greater penetration of marine-based actives in the market.
  • Clean-label demand is driving preference for seaweed-based actives.
  • Dermo cosmetic innovation is enhancing credibility and uptake.
  • Pharmacy-led distribution is expanding consumer access.
  • Biotech collaborations are expected to foster next-generation marine extracts.

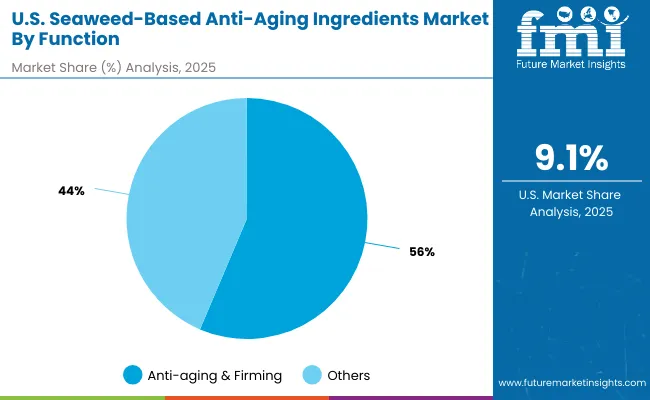
Growth Outlook for Seaweed-Based Anti-Aging Ingredients Market in USA

Usa Seaweed Based Anti Aging Ingredients Market By Function

Segment Market Value Share, 2025
Anti-aging & firming 56.4%
Others 43.6%

The Seaweed-Based Anti-Aging Ingredients Market in the United States is projected at USD 413.15 million in 2025. Anti-aging & firming contributes 56.4% (USD 232.8 million), while others hold 43.6% (USD 180.32 million), highlighting the dominance of efficacy-driven skincare functions. This leadership reflects strong consumer confidence in seaweed-based actives for wrinkle reduction, elasticity improvement, and long-term skin rejuvenation. Demand has been shaped by a shift toward clinically validated, marine-derived solutions that outperform synthetic ingredients in premium and cosmeceutical applications.

Other functions, while slightly smaller in share, are expected to remain vital as hydration, brightening, and protection benefits gain traction in multifunctional skincare portfolios. The convergence of cosmeceuticals and clean-label products is anticipated to reinforce adoption across both mainstream and luxury segments. As biotechnology innovations expand ingredient potency, these functional categories are expected to diversify further, strengthening the overall USA market.
  • Anti-aging & firming dominates with 56.4% share in 2025.
  • Market size projected at USD 413.15 million in 2025.
  • Other functions maintain relevance through hydration and brightening benefits.
  • Biotech-driven potency is expected to enhance performance differentiation.

Opportunity Analysis of China Seaweed-Based Anti-Aging Ingredients Market

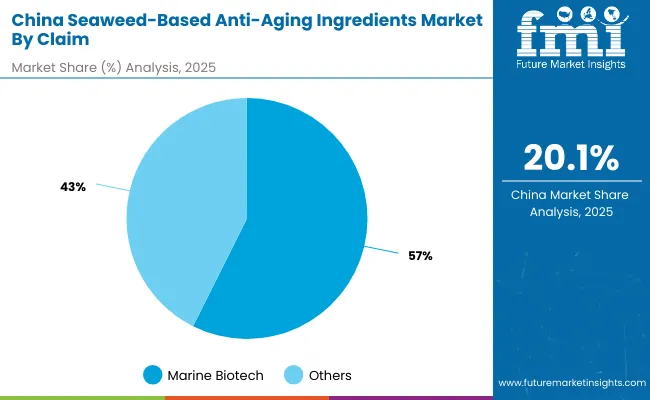
China Seaweed Based Anti Aging Ingredients Market By Claim

Segment Market Value Share, 2025
Marine biotech 57.4%
Others 42.6%

The Seaweed-Based Anti-Aging Ingredients Market in China is projected at USD 223.04 million in 2025. Marine biotech claims contribute 57.4% (USD 128 million), while others hold 42.6% (USD 94.96 million), underscoring the strong preference for biotechnology-driven innovation in skincare. This leadership reflects China’s rapid adoption of advanced extraction methods that enhance ingredient purity, efficacy, and sustainability.

Marine biotech formulations are expected to gain further traction as consumers prioritize science-backed natural ingredients that deliver visible results. Government support for biotechnology research and rising investments in cosmeceuticals are anticipated to amplify this dominance, positioning China as a hub for marine-based skincare innovation.

Other claims, while holding a smaller share, are projected to retain importance as multifunctional products targeting hydration, brightening, and overall skin health expand their appeal. The interplay of biotech-driven efficiency and consumer demand for clean-label solutions is expected to define market dynamics over the decade.
  • Marine biotech claims lead with 57.4% share in 2025.
  • Market size projected at USD 223.04 million in 2025.
  • Biotech-backed innovation strengthens product differentiation.
  • Government and industry support reinforce market leadership.

Competitive Landscape of Seaweed-Based Anti-Aging Ingredients Market

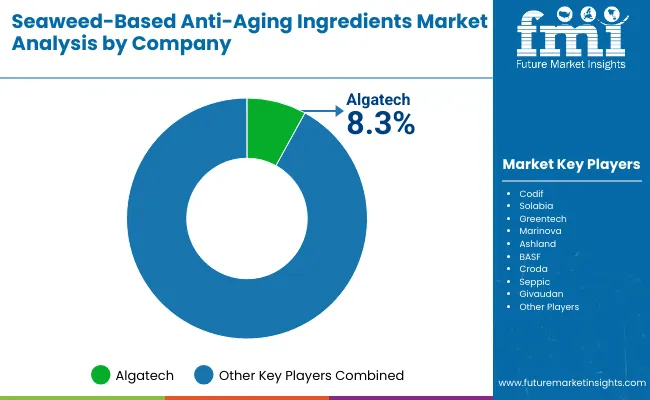
Seaweed Based Anti Aging Ingredients Market By Company

Company Global Value Share 2025
Algatech 8.3%
Others 91.7%

The market is moderately fragmented, with global leaders, mid-sized innovators, and niche specialists competing across marine-derived actives. Leading suppliers such as Algatech, BASF, Croda, Givaudan, and Ashland have been positioned strongly through portfolio breadth in seaweed extracts and biotechnology-enabled actives. Their strategies are being oriented toward clinically validated efficacy, traceable sourcing, and end-to-end partnerships with premium and dermocosmetic brands. Emphasis has been placed on marine-biotech processes that raise purity and potency while aligning with sustainability certifications.

Mid-sized players including Solabia, Greentech, Seppic, Marinova, and Codif are advancing differentiated extracts and standardized phycocompounds. Agility in R&D collaborations, faster custom development cycles, and targeted claims (firming, antioxidant defense, barrier support) are being used to win briefs from clean-label and pharmacy-led brands.

Specialists focused on high-grade brown-algae and microalgae fractions are competing on provenance, cold-chain processing, and verified bioactivity. Competitive differentiation is shifting from commodity extracts toward integrated ecosystems: validated in-vitro/in-vivo dossiers, lifecycle-assessment reporting, and co-development programs that accelerate time-to-launch. Over the forecast horizon, market share is expected to consolidate around suppliers that combine marine-biotech scale-up, documented clinical outcomes, and credible sustainability disclosures.

Key Developments in Seaweed-Based Anti-Aging Ingredients Market

  • June 2025 Origin by Ocean and CABB Group entered into a strategic partnership to establish a first-of-a-kind (FOAK) algae biorefinery at CABB’s production site in Kokkola, Finland. This facility is being designed to commercialize and scale ingredients (alginate, fucoidan, biomass residue) from invasive brown algae.
  • April 2025 BioMara, a seaweed-biotech startup, unveiled Revyntra, a high-purity fucoidan ingredient designed for long-lasting radiance and premature aging defense at in-cosmetics Global in Amsterdam. The ingredient was sourced from regeneratively farmed seaweed, is traceable, and is claimed to be effective at low inclusion rates in skincare & haircare formulations.

Scope of the Report

Item Value
Quantitative Units Global market size USD 1,803.1 million (2025); forecast USD 5,806.7 million (2035); CAGR 12.4% (2025-2035)
Component / Inputs Seaweed extracts and marine bioactives (e.g., fucoidan, alginate, phlorotannins), carrier systems, preservatives compliant with clean-label norms
Primary Segments Function: Anti-aging & firming, Others, Claim: Marine biotech, Others, Source: Brown algae, Others
Applications Serums, creams/lotions, masks, capsules/powders across premium skincare and dermocosmetics
Channels E-commerce, pharmacies, natural beauty stores, specialty beauty retail
End-use Industry Beauty & personal care manufacturers, cosmeceuticals, dermocosmetic/pharmacy brands, contract manufacturers (CMOs), indie clean-beauty brands
Regions Covered North America, Europe, Asia-Pacific, Latin America, Middle East & Africa
Countries Covered United States, China, India, United Kingdom, Germany, Japan
Key Companies Profiled Algatech, Codif, Solabia, Greentech, Marinova, Ashland, BASF, Croda, Seppic, Givaudan
Competitive Snapshot Moderately fragmented; leader Algatech ~8.3% global value share (2025); long tail of regional specialists; increasing partnerships for biotech extraction and clinical validation
Regulatory & Standards COSMOS-certified, clean-label and traceability requirements; sustainability and lifecycle-assessment reporting emphasized
Growth Drivers (Summary) Consumer shift to natural & sustainable actives; biotech extraction improving purity/efficacy; premiumization in dermocosmetics
Risks/Constraints Raw-material variability, harvest seasonality, certification costs, scale-up challenges for consistent bioactivity
Additional Attributes Dollar sales by Function (e.g., Anti-aging & firming USD 232.8 million in USA 2025); sales by Claim in China (Marine biotech USD 128 million, 2025); brown algae leadership (49.5% share; USD 890.9 million, 2025); emphasis on clinical dossiers, traceable sourcing, and sustainability metrics; rapid growth in India (CAGR 22.7%), China (20.1%), Japan (17.1%); partnerships for marine-biotech scale-up and co-development with premium brands.

Key Segments

By Source:

  • Brown algae
  • Red algae
  • Green algae
  • Microalgae

By Function:

  • Anti-aging & firming
  • Brightening
  • Hydration
  • UV protection

By Product Type:

  • Serums
  • Creams/lotions
  • Masks
  • Capsules/powders

By Channel:

  • E-commerce
  • Pharmacies
  • Natural beauty stores
  • Specialty beauty retail

By Claim:

  • Marine biotech
  • Vegan
  • Clean-label
  • COSMOS-certified

By Region:

  • North America
  • Latin America
  • Europe
  • East Asia
  • South Asia & Pacific
  • Middle East and Africa

Table of Content

  1. Executive Summary
    • Global Market Outlook
    • Demand-side Trends
    • Supply-side Trends
    • Technology Roadmap Analysis
    • Analysis and Recommendations
  2. Market Overview
    • Market Coverage / Taxonomy
    • Market Definition / Scope / Limitations
  3. Market Background
    • Market Dynamics
      • Drivers
      • Restraints
      • Opportunity
      • Trends
    • Scenario Forecast
      • Demand in Optimistic Scenario
      • Demand in Likely Scenario
      • Demand in Conservative Scenario
    • Opportunity Map Analysis
    • Product Life Cycle Analysis
    • Supply Chain Analysis
    • Investment Feasibility Matrix
    • Value Chain Analysis
    • PESTLE and Porter’s Analysis
    • Regulatory Landscape
    • Regional Parent Market Outlook
    • Production and Consumption Statistics
    • Import and Export Statistics
  4. Global Analysis 2020 to 2024 and Forecast, 2025 to 2035
    • Historical Market Size Value (USD Million) Analysis, 2020 to 2024
    • Current and Future Market Size Value (USD Million) Projections, 2025 to 2035
      • Y-o-Y Growth Trend Analysis
      • Absolute $ Opportunity Analysis
  5. Global Pricing Analysis 2020 to 2024 and Forecast 2025 to 2035
  6. Global Analysis 2020 to 2024 and Forecast 2025 to 2035, By Source
    • Introduction / Key Findings
    • Historical Market Size Value (USD Million) Analysis By Source, 2020 to 2024
    • Current and Future Market Size Value (USD Million) Analysis and Forecast By Source, 2025 to 2035
      • Brown algae
      • Red algae
      • Green algae
      • Microalgae
    • Y-o-Y Growth Trend Analysis By Source, 2020 to 2024
    • Absolute $ Opportunity Analysis By Source, 2025 to 2035
  7. Global Analysis 2020 to 2024 and Forecast 2025 to 2035, By Function
    • Introduction / Key Findings
    • Historical Market Size Value (USD Million) Analysis By Function, 2020 to 2024
    • Current and Future Market Size Value (USD Million) Analysis and Forecast By Function, 2025 to 2035
      • Anti-aging & firming
      • Brightening
      • Hydration
      • UV protection
    • Y-o-Y Growth Trend Analysis By Function, 2020 to 2024
    • Absolute $ Opportunity Analysis By Function, 2025 to 2035
  8. Global Analysis 2020 to 2024 and Forecast 2025 to 2035, By Product Type
    • Introduction / Key Findings
    • Historical Market Size Value (USD Million) Analysis By Product Type, 2020 to 2024
    • Current and Future Market Size Value (USD Million) Analysis and Forecast By Product Type, 2025 to 2035
      • Serums
      • Creams/lotions
      • Masks
      • Capsules/powders
    • Y-o-Y Growth Trend Analysis By Product Type, 2020 to 2024
    • Absolute $ Opportunity Analysis By Product Type, 2025 to 2035
  9. Global Analysis 2020 to 2024 and Forecast 2025 to 2035, By Channel
    • Introduction / Key Findings
    • Historical Market Size Value (USD Million) Analysis By Channel, 2020 to 2024
    • Current and Future Market Size Value (USD Million) Analysis and Forecast By Channel, 2025 to 2035
      • E-commerce
      • Pharmacies
      • Natural beauty stores
      • Specialty beauty retail
    • Y-o-Y Growth Trend Analysis By Channel, 2020 to 2024
    • Absolute $ Opportunity Analysis By Channel, 2025 to 2035
  10. Global Analysis 2020 to 2024 and Forecast 2025 to 2035, By Claim
    • Introduction / Key Findings
    • Historical Market Size Value (USD Million) Analysis By Claim, 2020 to 2024
    • Current and Future Market Size Value (USD Million) Analysis and Forecast By Claim, 2025 to 2035
      • Marine biotech
      • Vegan
      • Clean-label
      • COSMOS-certified
    • Y-o-Y Growth Trend Analysis By Claim, 2020 to 2024
    • Absolute $ Opportunity Analysis By Claim, 2025 to 2035
  11. Global Analysis 2020 to 2024 and Forecast 2025 to 2035, By Region
    • Introduction
    • Historical Market Size Value (USD Million) Analysis By Region, 2020 to 2024
    • Current Market Size Value (USD Million) Analysis and Forecast By Region, 2025 to 2035
      • North America
      • Latin America
      • Europe
      • East Asia
      • South Asia & Pacific
      • Middle East and Africa
    • Market Attractiveness Analysis By Region
  12. North America Analysis 2020 to 2024 and Forecast 2025 to 2035, By Country
    • Historical Market Size Value (USD Million) Trend Analysis By Market Taxonomy, 2020 to 2024
    • Market Size Value (USD Million) Forecast By Market Taxonomy, 2025 to 2035
      • By Country
        • USA
        • Canada
      • By Source
      • By Function
      • By Product Type
      • By Channel
      • By Claim
    • Market Attractiveness Analysis
      • By Country
      • By Source
      • By Function
      • By Product Type
      • By Channel
      • By Claim
    • Key Takeaways
  13. Latin America Analysis 2020 to 2024 and Forecast 2025 to 2035, By Country
    • Historical Market Size Value (USD Million) Trend Analysis By Market Taxonomy, 2020 to 2024
    • Market Size Value (USD Million) Forecast By Market Taxonomy, 2025 to 2035
      • By Country
        • Brazil
        • Mexico
        • Colombia
        • Rest of Latin America
      • By Source
      • By Function
      • By Product Type
      • By Channel
      • By Claim
    • Market Attractiveness Analysis
      • By Country
      • By Source
      • By Function
      • By Product Type
      • By Channel
      • By Claim
    • Key Takeaways
  14. Europe Analysis 2020 to 2024 and Forecast 2025 to 2035, By Country
    • Historical Market Size Value (USD Million) Trend Analysis By Market Taxonomy, 2020 to 2024
    • Market Size Value (USD Million) Forecast By Market Taxonomy, 2025 to 2035
      • By Country
        • Germany
        • UK
        • France
        • Italy
        • Spain
        • Belgium
        • Netherlands
        • Nordic
        • Switzerland
        • Russia
        • Poland
        • Rest of Europe
      • By Source
      • By Function
      • By Product Type
      • By Channel
      • By Claim
    • Market Attractiveness Analysis
      • By Country
      • By Source
      • By Function
      • By Product Type
      • By Channel
      • By Claim
    • Key Takeaways
  15. East Asia Analysis 2020 to 2024 and Forecast 2025 to 2035, By Country
    • Historical Market Size Value (USD Million) Trend Analysis By Market Taxonomy, 2020 to 2024
    • Market Size Value (USD Million) Forecast By Market Taxonomy, 2025 to 2035
      • By Country
        • China
        • Japan
        • South Korea
      • By Source
      • By Function
      • By Product Type
      • By Channel
      • By Claim
    • Market Attractiveness Analysis
      • By Country
      • By Source
      • By Function
      • By Product Type
      • By Channel
      • By Claim
    • Key Takeaways
  16. South Asia & Pacific Analysis 2020 to 2024 and Forecast 2025 to 2035, By Country
    • Historical Market Size Value (USD Million) Trend Analysis By Market Taxonomy, 2020 to 2024
    • Market Size Value (USD Million) Forecast By Market Taxonomy, 2025 to 2035
      • By Country
        • India
        • Thailand
        • Malaysia
        • Indonesia
        • Singapore
        • Vietnam
        • Australia
        • New Zealand
        • Rest of South Asia
      • By Source
      • By Function
      • By Product Type
      • By Channel
      • By Claim
    • Market Attractiveness Analysis
      • By Country
      • By Source
      • By Function
      • By Product Type
      • By Channel
      • By Claim
    • Key Takeaways
  17. Middle East and Africa Analysis 2020 to 2024 and Forecast 2025 to 2035, By Country
    • Historical Market Size Value (USD Million) Trend Analysis By Market Taxonomy, 2020 to 2024
    • Market Size Value (USD Million) Forecast By Market Taxonomy, 2025 to 2035
      • By Country
        • Turkey
        • UAE
        • Saudi Arabia
        • Israel
        • Other GCC Countries
        • North Africa
        • South Africa
      • By Source
      • By Function
      • By Product Type
      • By Channel
      • By Claim
    • Market Attractiveness Analysis
      • By Country
      • By Source
      • By Function
      • By Product Type
      • By Channel
      • By Claim
    • Key Takeaways
  18. Key Countries Analysis
    • USA
      • Pricing Analysis
      • Market Share Analysis, 2024
        • By Source
        • By Function
        • By Product Type
        • By Channel
        • By Claim
    • Canada
      • Pricing Analysis
      • Market Share Analysis, 2024
        • By Source
        • By Function
        • By Product Type
        • By Channel
        • By Claim
    • Mexico
      • Pricing Analysis
      • Market Share Analysis, 2024
        • By Source
        • By Function
        • By Product Type
        • By Channel
        • By Claim
    • Brazil
      • Pricing Analysis
      • Market Share Analysis, 2024
        • By Source
        • By Function
        • By Product Type
        • By Channel
        • By Claim
    • Germany
      • Pricing Analysis
      • Market Share Analysis, 2024
        • By Source
        • By Function
        • By Product Type
        • By Channel
        • By Claim
    • UK
      • Pricing Analysis
      • Market Share Analysis, 2024
        • By Source
        • By Function
        • By Product Type
        • By Channel
        • By Claim
    • Italy
      • Pricing Analysis
      • Market Share Analysis, 2024
        • By Source
        • By Function
        • By Product Type
        • By Channel
        • By Claim
    • Spain
      • Pricing Analysis
      • Market Share Analysis, 2024
        • By Source
        • By Function
        • By Product Type
        • By Channel
        • By Claim
    • France
      • Pricing Analysis
      • Market Share Analysis, 2024
        • By Source
        • By Function
        • By Product Type
        • By Channel
        • By Claim
    • India
      • Pricing Analysis
      • Market Share Analysis, 2024
        • By Source
        • By Function
        • By Product Type
        • By Channel
        • By Claim
    • Australia & New Zealand
      • Pricing Analysis
      • Market Share Analysis, 2024
        • By Source
        • By Function
        • By Product Type
        • By Channel
        • By Claim
    • China
      • Pricing Analysis
      • Market Share Analysis, 2024
        • By Source
        • By Function
        • By Product Type
        • By Channel
        • By Claim
    • Japan
      • Pricing Analysis
      • Market Share Analysis, 2024
        • By Source
        • By Function
        • By Product Type
        • By Channel
        • By Claim
    • South Korea
      • Pricing Analysis
      • Market Share Analysis, 2024
        • By Source
        • By Function
        • By Product Type
        • By Channel
        • By Claim
    • Russia
      • Pricing Analysis
      • Market Share Analysis, 2024
        • By Source
        • By Function
        • By Product Type
        • By Channel
        • By Claim
    • Poland
      • Pricing Analysis
      • Market Share Analysis, 2024
        • By Source
        • By Function
        • By Product Type
        • By Channel
        • By Claim
    • Hungary
      • Pricing Analysis
      • Market Share Analysis, 2024
        • By Source
        • By Function
        • By Product Type
        • By Channel
        • By Claim
    • Kingdom of Saudi Arabia
      • Pricing Analysis
      • Market Share Analysis, 2024
        • By Source
        • By Function
        • By Product Type
        • By Channel
        • By Claim
    • South Africa
      • Pricing Analysis
      • Market Share Analysis, 2024
        • By Source
        • By Function
        • By Product Type
        • By Channel
        • By Claim
  19. Market Structure Analysis
    • Competition Dashboard
    • Competition Benchmarking
    • Market Share Analysis of Top Players
      • By Regional
      • By Source
      • By Function
      • By Product Type
      • By Channel
      • By Claim
  20. Competition Analysis
    • Competition Deep Dive
      • Algatech
        • Overview
        • Product Portfolio
        • Profitability by Market Segments (Product/Age /Sales Channel/Region)
        • Sales Footprint
        • Strategy Overview
        • Codif
        • Solabia
        • Greentech
        • Marinova
        • Ashland
        • BASF
        • Croda
        • Seppic
        • Givaudan
    • Assumptions & Acronyms Used
    • Research Methodology

List of Tables

  • Table 1: Global Value (USD Million) Forecast by Region, 2020-2035
  • Table 2: Global Value (USD Million) Forecast by Source, 2020-2035
  • Table 3: Global Value (USD Million) Forecast by Function, 2020-2035
  • Table 4: Global Value (USD Million) Forecast by Product Type, 2020-2035
  • Table 5: Global Value (USD Million) Forecast by Channel, 2020-2035
  • Table 6: Global Value (USD Million) Forecast by Claim, 2020-2035
  • Table 7: North America Value (USD Million) Forecast by Country, 2020-2035
  • Table 8: North America Value (USD Million) Forecast by Source, 2020-2035
  • Table 9: North America Value (USD Million) Forecast by Function, 2020-2035
  • Table 10: North America Value (USD Million) Forecast by Product Type, 2020-2035
  • Table 11: North America Value (USD Million) Forecast by Channel, 2020-2035
  • Table 12: North America Value (USD Million) Forecast by Claim, 2020-2035
  • Table 13: Latin America Value (USD Million) Forecast by Country, 2020-2035
  • Table 14: Latin America Value (USD Million) Forecast by Source, 2020-2035
  • Table 15: Latin America Value (USD Million) Forecast by Function, 2020-2035
  • Table 16: Latin America Value (USD Million) Forecast by Product Type, 2020-2035
  • Table 17: Latin America Value (USD Million) Forecast by Channel, 2020-2035
  • Table 18: Latin America Value (USD Million) Forecast by Claim, 2020-2035
  • Table 19: Europe Value (USD Million) Forecast by Country, 2020-2035
  • Table 20: Europe Value (USD Million) Forecast by Source, 2020-2035
  • Table 21: Europe Value (USD Million) Forecast by Function, 2020-2035
  • Table 22: Europe Value (USD Million) Forecast by Product Type, 2020-2035
  • Table 23: Europe Value (USD Million) Forecast by Channel, 2020-2035
  • Table 24: Europe Value (USD Million) Forecast by Claim, 2020-2035
  • Table 25: East Asia Value (USD Million) Forecast by Country, 2020-2035
  • Table 26: East Asia Value (USD Million) Forecast by Source, 2020-2035
  • Table 27: East Asia Value (USD Million) Forecast by Function, 2020-2035
  • Table 28: East Asia Value (USD Million) Forecast by Product Type, 2020-2035
  • Table 29: East Asia Value (USD Million) Forecast by Channel, 2020-2035
  • Table 30: East Asia Value (USD Million) Forecast by Claim, 2020-2035
  • Table 31: South Asia & Pacific Value (USD Million) Forecast by Country, 2020-2035
  • Table 32: South Asia & Pacific Value (USD Million) Forecast by Source, 2020-2035
  • Table 33: South Asia & Pacific Value (USD Million) Forecast by Function, 2020-2035
  • Table 34: South Asia & Pacific Value (USD Million) Forecast by Product Type, 2020-2035
  • Table 35: South Asia & Pacific Value (USD Million) Forecast by Channel, 2020-2035
  • Table 36: South Asia & Pacific Value (USD Million) Forecast by Claim, 2020-2035
  • Table 37: Middle East and Africa Value (USD Million) Forecast by Country, 2020-2035
  • Table 38: Middle East and Africa Value (USD Million) Forecast by Source, 2020-2035
  • Table 39: Middle East and Africa Value (USD Million) Forecast by Function, 2020-2035
  • Table 40: Middle East and Africa Value (USD Million) Forecast by Product Type, 2020-2035
  • Table 41: Middle East and Africa Value (USD Million) Forecast by Channel, 2020-2035
  • Table 42: Middle East and Africa Value (USD Million) Forecast by Claim, 2020-2035

List of Figures

  • Figure 1: Global Pricing Analysis
  • Figure 2: Global Value (USD Million) Forecast 2020-2035
  • Figure 3: Global Value Share and BPS Analysis by Source, 2025 and 2035
  • Figure 4: Global Y-o-Y Growth Comparison by Source, 2025-2035
  • Figure 5: Global Attractiveness Analysis by Source
  • Figure 6: Global Value Share and BPS Analysis by Function, 2025 and 2035
  • Figure 7: Global Y-o-Y Growth Comparison by Function, 2025-2035
  • Figure 8: Global Attractiveness Analysis by Function
  • Figure 9: Global Value Share and BPS Analysis by Product Type, 2025 and 2035
  • Figure 10: Global Y-o-Y Growth Comparison by Product Type, 2025-2035
  • Figure 11: Global Attractiveness Analysis by Product Type
  • Figure 12: Global Value Share and BPS Analysis by Channel, 2025 and 2035
  • Figure 13: Global Y-o-Y Growth Comparison by Channel, 2025-2035
  • Figure 14: Global Attractiveness Analysis by Channel
  • Figure 15: Global Value Share and BPS Analysis by Claim, 2025 and 2035
  • Figure 16: Global Y-o-Y Growth Comparison by Claim, 2025-2035
  • Figure 17: Global Attractiveness Analysis by Claim
  • Figure 18: Global Value (USD Million) Share and BPS Analysis by Region, 2025 and 2035
  • Figure 19: Global Y-o-Y Growth Comparison by Region, 2025-2035
  • Figure 20: Global Attractiveness Analysis by Region
  • Figure 21: North America Incremental $ Opportunity, 2025-2035
  • Figure 22: Latin America Incremental $ Opportunity, 2025-2035
  • Figure 23: Europe Incremental $ Opportunity, 2025-2035
  • Figure 24: East Asia Incremental $ Opportunity, 2025-2035
  • Figure 25: South Asia & Pacific Incremental $ Opportunity, 2025-2035
  • Figure 26: Middle East and Africa Incremental $ Opportunity, 2025-2035
  • Figure 27: North America Value Share and BPS Analysis by Country, 2025 and 2035
  • Figure 28: North America Value Share and BPS Analysis by Source, 2025 and 2035
  • Figure 29: North America Y-o-Y Growth Comparison by Source, 2025-2035
  • Figure 30: North America Attractiveness Analysis by Source
  • Figure 31: North America Value Share and BPS Analysis by Function, 2025 and 2035
  • Figure 32: North America Y-o-Y Growth Comparison by Function, 2025-2035
  • Figure 33: North America Attractiveness Analysis by Function
  • Figure 34: North America Value Share and BPS Analysis by Product Type, 2025 and 2035
  • Figure 35: North America Y-o-Y Growth Comparison by Product Type, 2025-2035
  • Figure 36: North America Attractiveness Analysis by Product Type
  • Figure 37: North America Value Share and BPS Analysis by Channel, 2025 and 2035
  • Figure 38: North America Y-o-Y Growth Comparison by Channel, 2025-2035
  • Figure 39: North America Attractiveness Analysis by Channel
  • Figure 40: North America Value Share and BPS Analysis by Claim, 2025 and 2035
  • Figure 41: North America Y-o-Y Growth Comparison by Claim, 2025-2035
  • Figure 42: North America Attractiveness Analysis by Claim
  • Figure 43: Latin America Value Share and BPS Analysis by Country, 2025 and 2035
  • Figure 44: Latin America Value Share and BPS Analysis by Source, 2025 and 2035
  • Figure 45: Latin America Y-o-Y Growth Comparison by Source, 2025-2035
  • Figure 46: Latin America Attractiveness Analysis by Source
  • Figure 47: Latin America Value Share and BPS Analysis by Function, 2025 and 2035
  • Figure 48: Latin America Y-o-Y Growth Comparison by Function, 2025-2035
  • Figure 49: Latin America Attractiveness Analysis by Function
  • Figure 50: Latin America Value Share and BPS Analysis by Product Type, 2025 and 2035
  • Figure 51: Latin America Y-o-Y Growth Comparison by Product Type, 2025-2035
  • Figure 52: Latin America Attractiveness Analysis by Product Type
  • Figure 53: Latin America Value Share and BPS Analysis by Channel, 2025 and 2035
  • Figure 54: Latin America Y-o-Y Growth Comparison by Channel, 2025-2035
  • Figure 55: Latin America Attractiveness Analysis by Channel
  • Figure 56: Latin America Value Share and BPS Analysis by Claim, 2025 and 2035
  • Figure 57: Latin America Y-o-Y Growth Comparison by Claim, 2025-2035
  • Figure 58: Latin America Attractiveness Analysis by Claim
  • Figure 59: Europe Value Share and BPS Analysis by Country, 2025 and 2035
  • Figure 60: Europe Value Share and BPS Analysis by Source, 2025 and 2035
  • Figure 61: Europe Y-o-Y Growth Comparison by Source, 2025-2035
  • Figure 62: Europe Attractiveness Analysis by Source
  • Figure 63: Europe Value Share and BPS Analysis by Function, 2025 and 2035
  • Figure 64: Europe Y-o-Y Growth Comparison by Function, 2025-2035
  • Figure 65: Europe Attractiveness Analysis by Function
  • Figure 66: Europe Value Share and BPS Analysis by Product Type, 2025 and 2035
  • Figure 67: Europe Y-o-Y Growth Comparison by Product Type, 2025-2035
  • Figure 68: Europe Attractiveness Analysis by Product Type
  • Figure 69: Europe Value Share and BPS Analysis by Channel, 2025 and 2035
  • Figure 70: Europe Y-o-Y Growth Comparison by Channel, 2025-2035
  • Figure 71: Europe Attractiveness Analysis by Channel
  • Figure 72: Europe Value Share and BPS Analysis by Claim, 2025 and 2035
  • Figure 73: Europe Y-o-Y Growth Comparison by Claim, 2025-2035
  • Figure 74: Europe Attractiveness Analysis by Claim
  • Figure 75: East Asia Value Share and BPS Analysis by Country, 2025 and 2035
  • Figure 76: East Asia Value Share and BPS Analysis by Source, 2025 and 2035
  • Figure 77: East Asia Y-o-Y Growth Comparison by Source, 2025-2035
  • Figure 78: East Asia Attractiveness Analysis by Source
  • Figure 79: East Asia Value Share and BPS Analysis by Function, 2025 and 2035
  • Figure 80: East Asia Y-o-Y Growth Comparison by Function, 2025-2035
  • Figure 81: East Asia Attractiveness Analysis by Function
  • Figure 82: East Asia Value Share and BPS Analysis by Product Type, 2025 and 2035
  • Figure 83: East Asia Y-o-Y Growth Comparison by Product Type, 2025-2035
  • Figure 84: East Asia Attractiveness Analysis by Product Type
  • Figure 85: East Asia Value Share and BPS Analysis by Channel, 2025 and 2035
  • Figure 86: East Asia Y-o-Y Growth Comparison by Channel, 2025-2035
  • Figure 87: East Asia Attractiveness Analysis by Channel
  • Figure 88: East Asia Value Share and BPS Analysis by Claim, 2025 and 2035
  • Figure 89: East Asia Y-o-Y Growth Comparison by Claim, 2025-2035
  • Figure 90: East Asia Attractiveness Analysis by Claim
  • Figure 91: South Asia & Pacific Value Share and BPS Analysis by Country, 2025 and 2035
  • Figure 92: South Asia & Pacific Value Share and BPS Analysis by Source, 2025 and 2035
  • Figure 93: South Asia & Pacific Y-o-Y Growth Comparison by Source, 2025-2035
  • Figure 94: South Asia & Pacific Attractiveness Analysis by Source
  • Figure 95: South Asia & Pacific Value Share and BPS Analysis by Function, 2025 and 2035
  • Figure 96: South Asia & Pacific Y-o-Y Growth Comparison by Function, 2025-2035
  • Figure 97: South Asia & Pacific Attractiveness Analysis by Function
  • Figure 98: South Asia & Pacific Value Share and BPS Analysis by Product Type, 2025 and 2035
  • Figure 99: South Asia & Pacific Y-o-Y Growth Comparison by Product Type, 2025-2035
  • Figure 100: South Asia & Pacific Attractiveness Analysis by Product Type
  • Figure 101: South Asia & Pacific Value Share and BPS Analysis by Channel, 2025 and 2035
  • Figure 102: South Asia & Pacific Y-o-Y Growth Comparison by Channel, 2025-2035
  • Figure 103: South Asia & Pacific Attractiveness Analysis by Channel
  • Figure 104: South Asia & Pacific Value Share and BPS Analysis by Claim, 2025 and 2035
  • Figure 105: South Asia & Pacific Y-o-Y Growth Comparison by Claim, 2025-2035
  • Figure 106: South Asia & Pacific Attractiveness Analysis by Claim
  • Figure 107: Middle East and Africa Value Share and BPS Analysis by Country, 2025 and 2035
  • Figure 108: Middle East and Africa Value Share and BPS Analysis by Source, 2025 and 2035
  • Figure 109: Middle East and Africa Y-o-Y Growth Comparison by Source, 2025-2035
  • Figure 110: Middle East and Africa Attractiveness Analysis by Source
  • Figure 111: Middle East and Africa Value Share and BPS Analysis by Function, 2025 and 2035
  • Figure 112: Middle East and Africa Y-o-Y Growth Comparison by Function, 2025-2035
  • Figure 113: Middle East and Africa Attractiveness Analysis by Function
  • Figure 114: Middle East and Africa Value Share and BPS Analysis by Product Type, 2025 and 2035
  • Figure 115: Middle East and Africa Y-o-Y Growth Comparison by Product Type, 2025-2035
  • Figure 116: Middle East and Africa Attractiveness Analysis by Product Type
  • Figure 117: Middle East and Africa Value Share and BPS Analysis by Channel, 2025 and 2035
  • Figure 118: Middle East and Africa Y-o-Y Growth Comparison by Channel, 2025-2035
  • Figure 119: Middle East and Africa Attractiveness Analysis by Channel
  • Figure 120: Middle East and Africa Value Share and BPS Analysis by Claim, 2025 and 2035
  • Figure 121: Middle East and Africa Y-o-Y Growth Comparison by Claim, 2025-2035
  • Figure 122: Middle East and Africa Attractiveness Analysis by Claim

Frequently Asked Questions

How big is the Seaweed-Based Anti-Aging Ingredients Market in 2025?

The global Seaweed-Based Anti-Aging Ingredients Market is estimated to be valued at USD 1,803.1 million in 2025.

What will be the size of the Seaweed-Based Anti-Aging Ingredients Market in 2035?

The market size for the Seaweed-Based Anti-Aging Ingredients Market is projected to reach USD 5,806.7 million by 2035.

How much will be the Seaweed-Based Anti-Aging Ingredients Market growth between 2025 and 2035?

The Seaweed-Based Anti-Aging Ingredients Market is expected to grow at a CAGR of 12.4% between 2025 and 2035.

What are the key product types in the Seaweed-Based Anti-Aging Ingredients Market?

The key product types in the Seaweed-Based Anti-Aging Ingredients Market include serums, creams/lotions, masks, and capsules/powders.

Which function segment will contribute significant share in the Seaweed-Based Anti-Aging Ingredients Market in 2025?

In terms of function, the anti-aging & firming segment is expected to command 55.6% share in the Seaweed-Based Anti-Aging Ingredients Market in 2025.

Explore Similar Insights

Future Market Insights

Seaweed-Based Anti-Aging Ingredients Market

Chat With

MaRIA

Hi There, I am MaRIA, Your Market Research Intelligence Assistant. How may I help you?