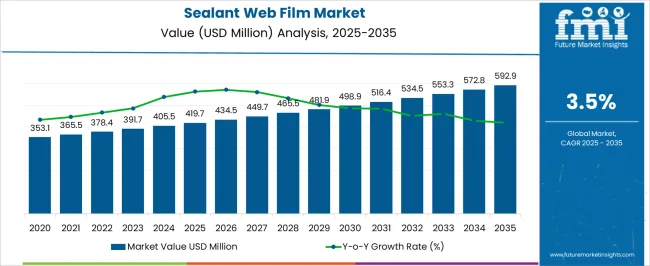
The Sealant Web Film Market is estimated to be valued at USD 419.7 million in 2025 and is projected to reach USD 592.9 million by 2035, registering a compound annual growth rate (CAGR) of 3.5% over the forecast period.
| Metric | Value |
|---|---|
| Sealant Web Film Market Estimated Value in (2025 E) | USD 419.7 million |
| Sealant Web Film Market Forecast Value in (2035 F) | USD 592.9 million |
| Forecast CAGR (2025 to 2035) | 3.5% |
The sealant web film market is experiencing robust growth driven by increasing demand for flexible packaging solutions, rising consumer preference for convenience-oriented and protective packaging, and advancements in polymer processing technologies. Current market dynamics are characterized by expanding use across food, pharmaceutical, and industrial sectors, with manufacturers focusing on enhancing barrier properties, durability, and ease of application.
Regulatory emphasis on material safety, recyclability, and sustainability is shaping product development strategies, while cost optimization and supply chain efficiencies are being pursued to maintain competitiveness. The future outlook is supported by ongoing innovation in sealant materials and film design, the rise of automated packaging systems, and growing adoption in emerging economies with expanding retail and e-commerce sectors.
Growth rationale is underpinned by the versatility of sealant web films in protecting products, extending shelf life, and ensuring consumer convenience, combined with the ability of manufacturers to customize material properties and thicknesses to meet application-specific requirements, thereby fostering sustained market expansion and penetration across global packaging industries.
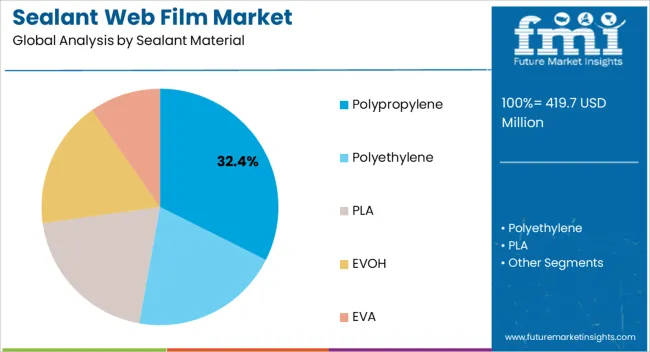
The polypropylene segment, representing 32.4% of the sealant material category, has emerged as the leading material due to its favorable mechanical strength, chemical resistance, and heat-sealing capabilities. Its adoption has been supported by compatibility with multiple substrate types and ability to meet diverse packaging requirements.
Production consistency and adherence to safety and regulatory standards have reinforced market confidence, while innovations in polymer formulations have improved clarity, flexibility, and barrier properties. The segment’s growth has been strengthened by demand from food and pharmaceutical packaging applications, where durability and product protection are critical.
Strategic partnerships with converters and packaging equipment manufacturers have facilitated wider deployment Ongoing R&D efforts are expected to expand the applicability of polypropylene sealants, maintain competitive positioning, and sustain contribution to overall market share.
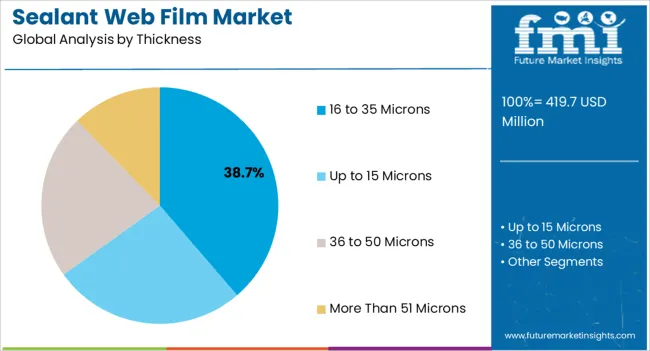
The 16 to 35 microns thickness segment, accounting for 38.7% of the thickness category, has maintained leadership due to its optimal balance between material efficiency and functional performance. Adoption has been driven by its suitability for a wide range of packaging formats, providing adequate barrier protection and seal integrity while minimizing material usage.
Production standards and quality control measures have ensured consistent thickness, supporting reliability in sealing processes. The segment’s growth has been reinforced by increasing automation in packaging lines and demand for lightweight, cost-effective solutions.
Ongoing innovations in extrusion and coating technologies are expected to enhance uniformity and performance, sustaining the segment’s market share and relevance across multiple end-use applications.
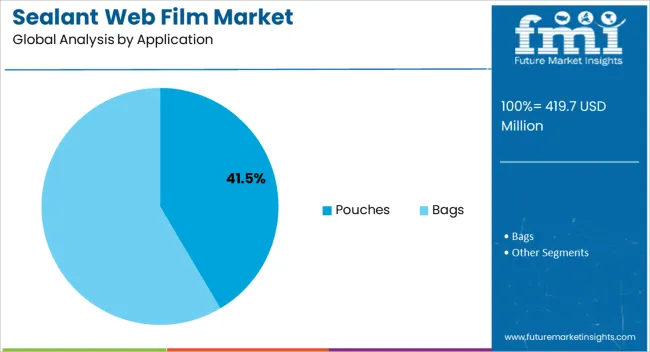
The pouches segment, holding 41.5% of the application category, has emerged as the leading application due to its flexibility, convenience, and efficiency in protecting packaged goods. Adoption has been supported by the expanding use of stand-up, resealable, and multi-layer pouches in food, personal care, and pharmaceutical sectors.
Benefits such as extended shelf life, reduced storage space, and enhanced consumer appeal have reinforced preference among manufacturers and end-users. The segment’s growth is being strengthened by increased penetration in retail and e-commerce channels, while process improvements in sealing and laminating have enhanced product quality.
Continued innovation in pouch design and compatibility with automated packaging systems is expected to sustain market share and drive further adoption globally.
| Attributes | Details |
|---|---|
| Sealant Web Film Market Size (2020) | USD 353.1 million |
| Sealant Web Film Market Size (2025) | USD 419.7 million |
The market valuation of sealant web film appreciated from USD 353.1 million in 2020 to USD 419.7 million in 2025. Over the forecast period, the market is anticipated to expand at a CAGR of 3.7% to achieve USD 592.9 million by 2035. Leading factors that are propelling market growth include:
Polyethylene is a significantly preferred sealant material for sealant web films. Since the material offers a strong and durable seal that restricts the inflow and outflow of moisture, it is utilized in numerous food packaging applications like cereal bags, bread bags, and frozen food packaging.
| Segment | Polyethylene |
|---|---|
| Market Share % (2025) | 77.1% |
The material used in medical packaging applications offers a sterile and safe environment for medical products. The material also finds application in industrial packaging like pallet wrapping and shipping bags that protect the products from damage. Due to its versatility and cost-effectiveness, the material finds applications in several industries.
The food and beverage segment is expected to obtain a 42.4% market share in 2025. Sealant web films are significantly utilized in food and beverage packaging as they protect the food from contamination, thus ensuring food quality and safety.
| Segment | Food and Beverages |
|---|---|
| Market Share % (2025) | 42.4% |
These films are used to develop tamper-evident seals on food and beverage packaging to ensure that the product is fit for consumption. These seals are also utilized to develop eye-catching food and beverage packaging to boost brand awareness. Surging demand for packaged and ready-to-eat meals is expected to benefit the sales of sealant web films over the forecast period.
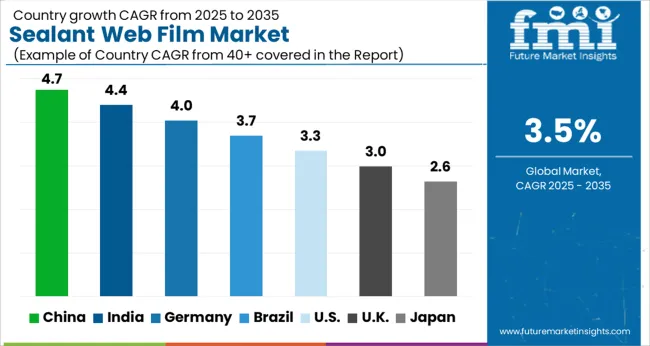
The Canada sealant web film market is anticipated to register a CAGR of 3.2% through 2035. The market is expected to be driven by the following factors:
| Country | Canada |
|---|---|
| Forecast CAGR % (2025 to 2035) | 3.2% |
The India sealant web film market is predicted to expand at a CAGR of 6.2% through 2035. Key factors that are augmenting the adoption of sealant web films in India are as follows:
| Country | India |
|---|---|
| Forecast CAGR % (2025 to 2035) | 6.2% |
The sealant web film market in China is projected to register a CAGR of 5.6% through 2035. Given below are the factors that are yielding sales of sealant web film in China:
| Country | China |
|---|---|
| Forecast CAGR % (2025 to 2035) | 5.6% |
The Thailand sealant web film market is anticipated to record a CAGR of 5.1% through 2035. The following factors are bolstering the adoption of sealant web films in Thailand:
| Country | Thailand |
|---|---|
| Forecast CAGR % (2025 to 2035) | 5.1% |
The United Kingdom sealant web film market is estimated to record a CAGR of 3.8% through 2035. The following factors facilitate the market growth in the United Kingdom:
| Country | The United Kingdom |
|---|---|
| Forecast CAGR % (2025 to 2035) | 3.8% |
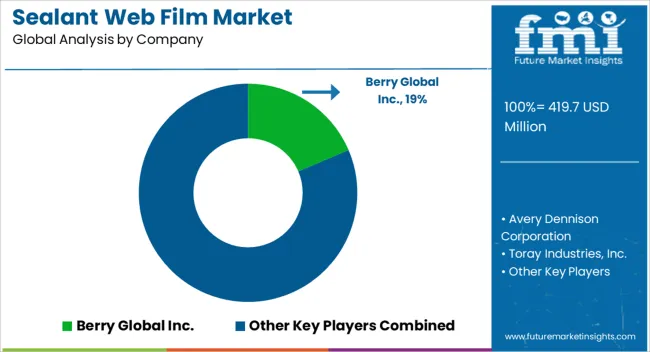
The global market is fragmented, with regional and international players vying for a larger market share. Players compete for product price, quality, innovation, and customer service. Additionally, to keep up with the latest consumer trends, market players are developing more sustainable packaging solutions to assist their customers in meeting their sustainability goals.
Market participants are expanding their footprint in emerging economies of Latin America and Asia Pacific as these regions display heightened demand for sealant web films due to inflating disposable incomes and increasing population density. Moreover, key providers of sealant web films are making technological upgrades through product development, the launch of new manufacturing processes, etc., to enhance sealant web films' quality and performance.
Leading players in the market are expected to focus on capturing new markets and product innovation. In contrast, new entrants are predicted to lead with an effective marketing strategy and a strong product portfolio.
Key Developments in the Sealant Web Film Market:
| Attribute | Details |
|---|---|
| Forecast Period | 2025 to 2035 |
| Historical Data Available for | 2020 to 2025 |
| Market Analysis | USD million for Value and ‘000 Tonnes for Volume |
| Key Regions Covered | North America; Latin America; Western Europe; Eastern Europe; Asia Pacific; The Middle East and Africa (MEA) |
| Key Countries Covered | The United States, Canada, Brazil, Mexico, Germany, Italy, France, the United Kingdom, Spain, Poland, Russia, GCC Countries, South Africa, China, and India |
| Key Segments Covered | Sealant Material, Thickness, Application, End Use, and Region |
| Key Companies Profiled | Avery Dennison Corporation; Berry Global Inc.; Toray Industries, Inc.; Polyfilm Group; DIC Corporation; Plastic Suppliers, Inc.; Jindal Poly Films Ltd; DuPont de Nemours, Inc.; Cosmo Films Ltd.; Dai Nippon Printing Co., Ltd. |
| Report Coverage | Market Forecast, Company Share Analysis, Competition Intelligence, DROT Analysis, Market Dynamics and Challenges, and Strategic Growth Initiatives |
| Customization and Pricing | Available upon Request |
The global sealant web film market is estimated to be valued at USD 419.7 million in 2025.
The market size for the sealant web film market is projected to reach USD 592.9 million by 2035.
The sealant web film market is expected to grow at a 3.5% CAGR between 2025 and 2035.
The key product types in sealant web film market are polypropylene, polyethylene, _ldpe, _lldpe, pla, evoh and eva.
In terms of thickness, 16 to 35 microns segment to command 38.7% share in the sealant web film market in 2025.


Our Research Products

The "Full Research Suite" delivers actionable market intel, deep dives on markets or technologies, so clients act faster, cut risk, and unlock growth.

The Leaderboard benchmarks and ranks top vendors, classifying them as Established Leaders, Leading Challengers, or Disruptors & Challengers.

Locates where complements amplify value and substitutes erode it, forecasting net impact by horizon

We deliver granular, decision-grade intel: market sizing, 5-year forecasts, pricing, adoption, usage, revenue, and operational KPIs—plus competitor tracking, regulation, and value chains—across 60 countries broadly.

Spot the shifts before they hit your P&L. We track inflection points, adoption curves, pricing moves, and ecosystem plays to show where demand is heading, why it is changing, and what to do next across high-growth markets and disruptive tech

Real-time reads of user behavior. We track shifting priorities, perceptions of today’s and next-gen services, and provider experience, then pace how fast tech moves from trial to adoption, blending buyer, consumer, and channel inputs with social signals (#WhySwitch, #UX).

Partner with our analyst team to build a custom report designed around your business priorities. From analysing market trends to assessing competitors or crafting bespoke datasets, we tailor insights to your needs.
Supplier Intelligence
Discovery & Profiling
Capacity & Footprint
Performance & Risk
Compliance & Governance
Commercial Readiness
Who Supplies Whom
Scorecards & Shortlists
Playbooks & Docs
Category Intelligence
Definition & Scope
Demand & Use Cases
Cost Drivers
Market Structure
Supply Chain Map
Trade & Policy
Operating Norms
Deliverables
Buyer Intelligence
Account Basics
Spend & Scope
Procurement Model
Vendor Requirements
Terms & Policies
Entry Strategy
Pain Points & Triggers
Outputs
Pricing Analysis
Benchmarks
Trends
Should-Cost
Indexation
Landed Cost
Commercial Terms
Deliverables
Brand Analysis
Positioning & Value Prop
Share & Presence
Customer Evidence
Go-to-Market
Digital & Reputation
Compliance & Trust
KPIs & Gaps
Outputs
Full Research Suite comprises of:
Market outlook & trends analysis
Interviews & case studies
Strategic recommendations
Vendor profiles & capabilities analysis
5-year forecasts
8 regions and 60+ country-level data splits
Market segment data splits
12 months of continuous data updates
DELIVERED AS:
PDF EXCEL ONLINE
LDPE & LLDPE Sealant Web Films Market Insights and Trends 2025 to 2035
Sealant Films Market
Bio-based sealant films Market Size and Share Forecast Outlook 2025 to 2035
Key Players & Market Share in Bio-based Sealant Films
Film and TV IP Peripherals Market Size and Share Forecast Outlook 2025 to 2035
Web Development Outsourcing Services Market Size and Share Forecast Outlook 2025 to 2035
Film Wrapped Wire Market Size and Share Forecast Outlook 2025 to 2035
Film-Insulated Wire Market Size and Share Forecast Outlook 2025 to 2035
Film Forming Starches Market Size and Share Forecast Outlook 2025 to 2035
Film Formers Market Size and Share Forecast Outlook 2025 to 2035
Website Builder Tool Market Size and Share Forecast Outlook 2025 to 2035
Web Scraping Software Market Size and Share Forecast Outlook 2025 to 2035
Web Real-Time Communication (WebRTC) Solution Market Analysis - Size, Share, and Forecast 2025 to 2035
Webbing Cutting Machine Market Size and Share Forecast Outlook 2025 to 2035
Web Performance Optimization (WPO) Solution Market Size and Share Forecast Outlook 2025 to 2035
Web3 Gaming Market Report - Growth & Forecast 2025 to 2035
Web3 Messaging Tools Market Report - Growth & Forecast 2025 to 2035
Film Capacitors Market Analysis & Forecast by Material, Application, End Use, and Region Through 2035
Web Conferencing Market Analysis 2025 to 2035 by Component, Deployment, End-Use, and Region-Forecast from 2025 to 2035
Film Tourism Industry Analysis by Type, by End User, by Tourist Type, by Booking Channel, and by Region - Forecast for 2025 to 2035

Thank you!
You will receive an email from our Business Development Manager. Please be sure to check your SPAM/JUNK folder too.
Chat With
MaRIA