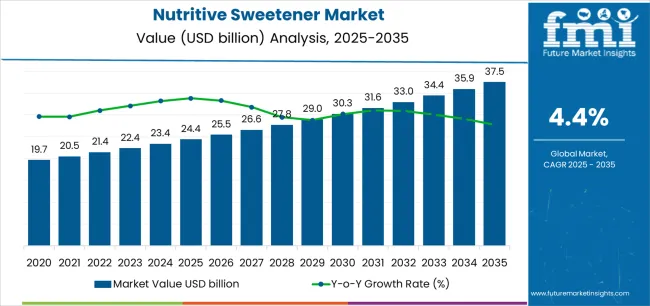
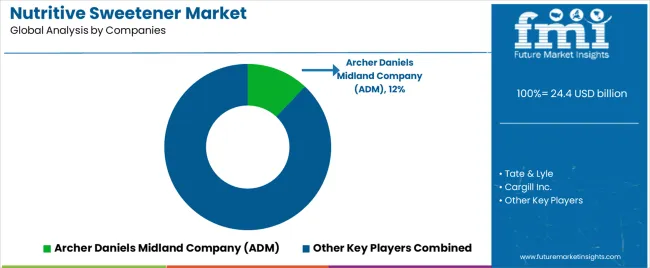
The nutritive sweetener market, advancing from USD 24.4 billion in 2025 to USD 37.5 billion by 2035 at a strong upward trajectory, is deeply intertwined with food innovation trends that are reshaping global consumption patterns and ingredient technologies. The projected expansion of USD 13.1 billion across the decade puts focus on sweeteners no longer being viewed solely as taste enhancers but as functional, health-oriented, and formulation-friendly components that support evolving food industry needs. Food innovation is expected to drive both diversification and integration of nutritive sweeteners across multiple processing environments.
During the first half of the forecast horizon, rising consumer health awareness is pushing brands to reformulate with natural and organic alternatives. This innovation trend emphasizes reduced calorie density, cleaner ingredient labels, and better metabolic responses, particularly in beverages, bakery, and dairy segments. Companies are experimenting with advanced extraction methods for cane, beet, honey, and plant-derived sugars to ensure consistency, while enhancing sensory attributes. The inclusion of nutritive sweeteners in functional beverages, fortified foods, and performance nutrition products shows that innovation is not confined to taste but extends to energy balance, digestion, and bioavailability. This convergence of taste and wellness is expected to accelerate the uptake of sweeteners that offer both indulgence and health credentials.
In the latter half of the period, food innovation will focus on blending nutritive sweeteners with alternative formulations to deliver optimized sensory and functional profiles. Specialty blends combining sucrose, glucose, and emerging nutritive compounds will be integrated into multi-functional food systems that emphasize balanced energy release and compatibility with clean-label requirements. A prominent trend will be the use of sweeteners as part of broader nutrition platforms, where food technology companies develop holistic formulation toolkits encompassing taste, texture, and functional enrichment. Beverage innovation pipelines, bakery product diversification, and convenience food categories will embed sweetener technologies into recipes that meet both indulgence and wellness expectations, signaling a deeper transformation in formulation strategies.
Innovation is also expected to reflect sourcing practices and traceability, as demand for responsibly harvested and minimally processed ingredients becomes embedded in consumer choice. While nutritive sweeteners traditionally faced criticism for caloric contribution, modern reformulations are reframing them as “better-for-you” solutions when incorporated in smaller, more controlled quantities. Food processors are therefore innovating portion control, delivery systems, and hybrid formulations to optimize metabolic outcomes.
| Period | Primary Revenue Buckets | Share | Notes |
|---|---|---|---|
| Today | Food processing applications | 42% | Bulk ingredient sales, B2B relationships |
| Beverage manufacturing | 28% | Soft drinks, juices, energy drinks | |
| Household/retail consumption | 15% | Consumer packaged sweeteners | |
| Bakery and confectionery | 10% | Specialized sweetening systems | |
| Pharmaceutical formulations | 5% | Syrup bases, tablet coatings | |
| Future (3-5 yrs) | Organic & natural sweeteners | 35-40% | Clean-label demand, premium positioning |
| Functional beverage sweetening | 25-30% | Sports nutrition, health drinks | |
| Specialty food applications | 15-20% | Plant-based products, functional foods | |
| Direct-to-consumer channels | 10-15% | E-commerce, subscription models | |
| Pharmaceutical & nutraceutical | 8-12% | Sugar-free formulations, taste masking | |
| Alternative sweetener blends | 5-8% | Hybrid systems, reduced-sugar solutions |
| Metric | Value |
|---|---|
| Market Value (2025) | USD 24.4 billion |
| Market Forecast (2035) | USD 37.5 billion |
| Growth Rate | 4.40% CAGR |
| Leading Product Type | Fructose |
| Primary Nature | Organic Growing Fastest |
The market demonstrates strong fundamentals with fructose capturing dominant 38% share through superior sweetness intensity and versatile food processing applications. Organic sweeteners show fastest growth trajectory, supported by increasing consumer demand for natural ingredients and clean-label products. Geographic expansion remains concentrated in developed markets with established food processing infrastructure, while emerging economies show accelerating adoption rates driven by rising disposable incomes and changing dietary patterns.
The market segments by product type into fructose, sucrose, corn sugar, honey, high fructose corn syrup (HFCS), and other nutritive sweeteners, representing the evolution from traditional table sugar to sophisticated sweetening systems for comprehensive food formulation optimization.
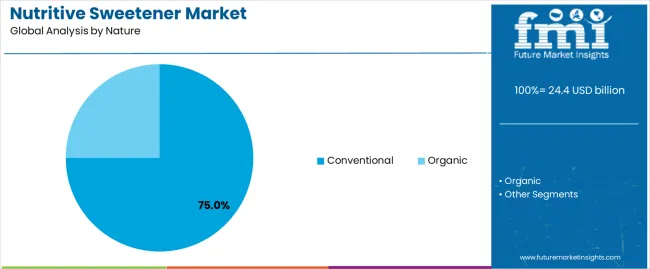
Nature segmentation divides the market into organic and conventional products, reflecting growing consumer demand for certified organic ingredients and sustainable agricultural practices versus traditional commodity sweetener supply chains.
End-use segmentation covers household/retail, food processing, bakery, confectionery, beverages, and pharmaceuticals, while distribution channels span direct sales, indirect sales, store-based retailing (hypermarkets/supermarkets, convenience stores, discount stores), and online platforms.
Geographic distribution covers Asia Pacific (China, India, Japan), North America (United States, Canada), Europe (Germany, United Kingdom, France), Latin America (Brazil, Mexico), and Middle East & Africa, with developed markets showing steady growth while emerging economies demonstrate accelerated consumption patterns.
The segmentation structure reveals sweetener progression from commodity sugar products toward specialized ingredient systems with enhanced functionality and clean-label credentials, while application diversity spans from household table use to sophisticated pharmaceutical formulation requiring precise sweetness and solubility specifications.
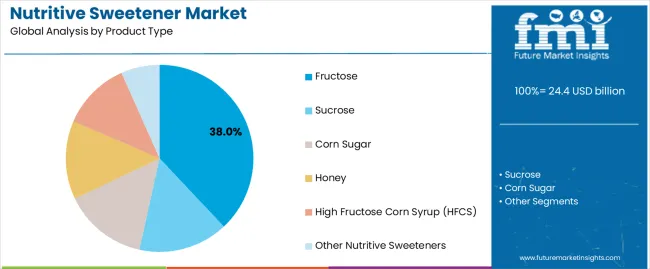
Market Position: Fructose commands the leading position in the nutritive sweetener market with 38% market share through superior sweetness intensity (1.2-1.8x sucrose), lower glycemic index profile, and versatile application characteristics that enable food manufacturers to achieve optimal sweetness levels while reducing total sugar content across beverage, bakery, and processed food applications.
Value Drivers: The segment benefits from health-conscious product development emphasizing reduced sugar content without compromising taste perception, where fructose's higher sweetness per gram enables sugar reduction claims and calorie optimization. Crystalline fructose and liquid fructose solutions provide formulation flexibility for diverse processing requirements, while enhanced browning reactions in baked goods create desirable color and flavor development.
Competitive Advantages: Fructose differentiates through proven metabolic characteristics including insulin-independent cellular uptake, superior moisture retention in baked products, and synergistic sweetness enhancement when blended with other sweeteners that improve product quality while addressing consumer health concerns about traditional sugar consumption.
Key market characteristics:
Sucrose captures 25% market share through established market presence, cost-effective sweetening, and universal consumer acceptance across household and food processing applications. Despite competition from alternative sweeteners, sucrose maintains strong demand in traditional baking, confectionery, and preserving applications where functional properties and familiar taste profile remain irreplaceable.
Market Intelligence Brief:
Corn Sugar accounts for 15% market share through competitive pricing, consistent supply availability, and suitable functionality for industrial food processing applications requiring economical sweetening without premium taste requirements. The segment serves cost-sensitive manufacturers in developing markets and bulk industrial applications.
Growth Characteristics:
Honey captures 12% market share through premium positioning, natural health associations, and clean-label credentials appealing to consumers seeking minimally processed sweetener alternatives with perceived nutritional benefits and unique flavor profiles.
Value Drivers:
HFCS accounts for 11% market share through established beverage industry relationships, cost-effective sweetening in liquid applications, and functional advantages in carbonated soft drinks, fruit beverages, and processed foods requiring liquid sweetening systems.
Market Intelligence Brief:
Market Context: Organic nutritive sweeteners demonstrate highest growth rate at 6.8% CAGR driven by consumer demand for certified organic food products, clean-label ingredient preferences, and willingness to pay premium prices for sustainably-sourced sweeteners across all product categories.
Appeal Factors: Organic certification provides third-party verification of agricultural practices, environmental stewardship, and absence of synthetic pesticides that resonate with health-conscious consumers and environmentally-aware purchasers. The segment benefits from mainstream retailer organic category expansion and food manufacturer reformulation initiatives positioning products in premium market segments.
Growth Drivers: Organic food market expansion creates derived demand for organic ingredient supply including sweeteners. Regulatory support through organic standards harmonization and consumer education initiatives drive category awareness and purchase consideration across demographic segments.
Application dynamics include:
Conventional sweeteners capture approximately 75% market share through established supply chains, competitive pricing, and adequate quality standards for mainstream food processing applications where organic certification provides limited consumer value proposition or cost premium justification.
Market Intelligence Brief:
Market Context: Food Processing applications dominate market demand with steady growth reflecting fundamental role of nutritive sweeteners in manufactured food products spanning dairy, processed meats, sauces, dressings, ready meals, and countless other categories requiring taste optimization and preservation functions.
Business Model Advantages: Food manufacturers provide sustained high-volume demand through long-term supply contracts, predictable ordering patterns, and technical collaboration on product development that create stable business relationships and operational efficiency for sweetener suppliers.
Operational Benefits: Bulk supply logistics, technical service requirements, and application development support create value-added differentiation opportunities beyond commodity pricing competition in highly contested food ingredient markets.
Beverage applications capture approximately 28% end-use share through critical role in soft drinks, juice beverages, sports drinks, energy drinks, and functional beverage formulations where sweetener selection directly impacts taste perception, calorie content, and consumer purchase decisions.
Growth Characteristics:
Household/Retail consumption accounts for approximately 15% market share through direct consumer purchases of packaged sweeteners for home cooking, baking, and beverage sweetening applications providing brand visibility and premium pricing opportunities.
Bakery end-use captures market share through specialized functionality requirements including moisture retention, browning enhancement, texture optimization, and shelf-life extension where sweetener selection impacts product quality beyond simple taste sweetening.
Confectionery applications account for market share through specialized sweetening requirements for chocolate, hard candy, gummies, and premium confections where sweetener functionality impacts texture, snap, shelf-life, and consumer sensory experience.
Pharmaceutical formulations capture market share through requirements for syrup bases, tablet coatings, suspension vehicles, and taste masking applications where regulatory compliance, functional specifications, and quality consistency represent critical selection criteria.
Market Position: Store-Based Retailing including hypermarkets/supermarkets, convenience stores, and discount stores commands dominant position in consumer-facing distribution with approximately 55% channel share through convenient access, product visibility, and immediate purchase satisfaction for household consumption.
Value Drivers: Physical retail provides tactile product evaluation, price comparison convenience, and impulse purchase opportunities while established grocery shopping patterns drive sustained channel traffic and category visibility in high-footfall locations.
Growth Characteristics: Premium product positioning in natural food sections, organic category expansion, and specialty sweetener variety increasing within mainstream retail creating sustained channel growth despite e-commerce competition.
Direct Sales to food processors, beverage manufacturers, and industrial customers capture approximately 35% channel share through bulk supply relationships, technical service integration, and long-term supply agreements that characterize B2B ingredient commerce.
Indirect Sales through ingredient distributors and foodservice channels account for market share, providing market access to small-medium enterprises and regional food manufacturers requiring smaller volumes and flexible ordering systems.
E-Commerce and online platforms demonstrate fastest channel growth serving direct-to-consumer retail, subscription services, and small business ingredient sourcing with convenience, variety, and competitive pricing advantages.
Market Context: Asia Pacific dominates nutritive sweetener market growth with fastest CAGR driven by population growth, rising disposable incomes, expanding food processing industry, and increasing westernization of dietary patterns across China, India, Southeast Asia, and emerging economies.
Business Model Advantages: The region provides largest consumption volumes for both food processing applications and household use, driving sustained sweetener demand while supporting regional production capacity and agricultural development in sugarcane and corn cultivation regions.
Operational Benefits: Asia Pacific markets benefit from agricultural production advantages, growing middle-class consumption patterns, and government food security initiatives that create integrated sugar industry value chains and competitive market economics.
| Category | Factor | Impact | Why It Matters |
|---|---|---|---|
| Driver | Health consciousness & sugar reduction trends (diabetes prevalence, obesity concerns) | ★★★★★ | Consumer awareness drives reduced-sugar product demand; nutritive sweeteners with health positioning gain market share |
| Driver | Processed food consumption growth (urbanization, convenience trends) | ★★★★★ | Packaged food expansion in emerging markets creates derived demand for sweetener ingredients; food processing industrialization drives volume growth |
| Driver | Clean-label movement & organic food demand | ★★★★☆ | Natural ingredient preferences favor nutritive sweeteners over artificial alternatives; organic certification commands premium pricing |
| Restraint | Competition from non-nutritive sweeteners (artificial and natural alternatives) | ★★★★☆ | Zero-calorie sweeteners capture market share in diet products; sugar substitutes pressure nutritive sweetener volumes in specific segments |
| Restraint | Sugar taxation & regulatory restrictions | ★★★★☆ | Government sugar reduction policies impact consumption patterns; excise taxes on sugary beverages reduce sweetener demand in affected categories |
| Restraint | Commodity price volatility (agricultural inputs) | ★★★☆☆ | Raw material costs fluctuate with crop yields and weather; margin compression during high-price periods affects profitability |
| Trend | Functional sweeteners & ingredient combinations | ★★★★★ | Hybrid systems combining nutritive and non-nutritive sweeteners optimize taste and calories; functional ingredient positioning creates differentiation |
| Trend | Sustainable sourcing & traceability | ★★★★☆ | Supply chain transparency and environmental credentials increasingly important; blockchain traceability and regenerative agriculture differentiate suppliers |
| Trend | Customized sweetness profiles & regional preferences | ★★★★☆ | Localized taste optimization increases; suppliers offering application-specific blends and technical support gain competitive advantage |
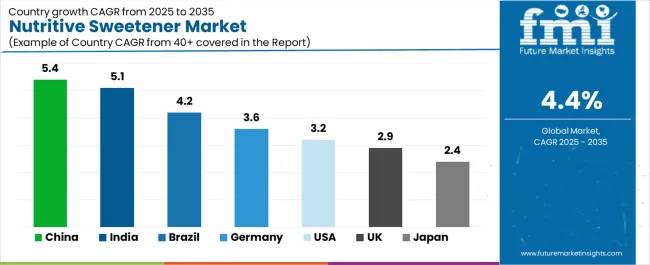
The nutritive sweetener market demonstrates varied regional dynamics with Growth Leaders including China (5.4% growth rate) and India (5.1% growth rate) driving expansion through beverage reformulation, confectionery scale-up, and integrated sugar–starch processing clusters. Steady Performers encompass Germany (3.6% growth rate) and Brazil (4.2% growth rate), benefiting from mature food industries, reliable retail programs, and export-linked capacity. Mature Markets feature the United States (3.2% growth rate), United Kingdom (2.9% growth rate), and Japan (2.4% growth rate), where line extensions, portion control, and clear label communication support consistent growth patterns. Regional synthesis reveals East Asian markets leading adoption through RTD beverages, dairy desserts, and bakery snacks, while North American countries maintain steady expansion supported by format variety and strong convenience channels. European markets show moderate growth driven by formulation precision, quality integration, and retailer scorecard discipline.
| Region/Country | 2025–2035 Growth | How to win | What to watch out |
|---|---|---|---|
| China | 5.4% | Localize syrup solids; rapid QC release; e-commerce pack sizes | Price compression; import paperwork; flavor drift in heat |
| India | 5.1% | Value SKUs; heat-stable syrups; mill partnerships | GST complexity; monsoon logistics; crystallization in transit |
| Germany | 3.6% | Precision specs; clean labels; retailer co-developed SKUs | Additive limits; long approvals; shelf-life audits |
| Brazil | 4.2% | Mid-tier syrups; distributor depth; festival-season bundling | FX swings; duty changes; crop variability |
| United States | 3.2% | Format variety; club share-bags; data-led resets | Promo fatigue; margin squeeze; state rule variance |
| United Kingdom | 2.9% | Portion control; shelf-ready cases; simple claims | HFSS rules; price caps; private label pressure |
| Japan | 2.4% | Texture-first candies; mini pouches; meticulous QC | Aging demographics; space limits; slow rotation risk |
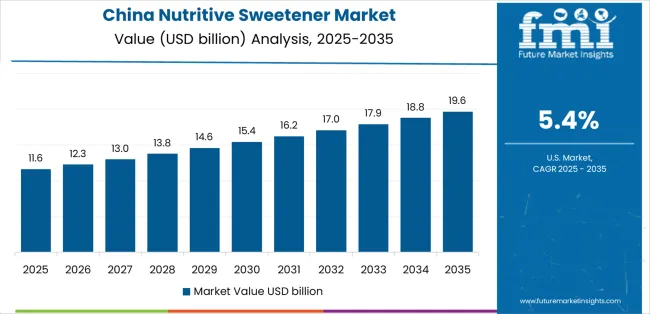
China establishes fastest market growth through large beverage bases, confectionery plants, and bakery corridors that rely on steady syrup solids and crystal grades tuned for regional climates. The country’s 5.4% growth rate reflects strong demand for RTD tea, fruit drinks, yogurt drinks, and filled bakery where sweetness curves must stay consistent across seasonal temperatures. Producers in Shanghai, Guangzhou, Shenzhen, and Chengdu favor partners who can issue Chinese COAs, run rapid QC release, and hold safety stock near flavor parks to match frequent lineup refreshes. Success rests on syrup clarity, low ash, and color control that prevent creeping bitterness or hue shift in light beverages. Candy makers want narrow moisture windows to protect bite and shelf stability, while e-commerce brands look for family pouches and single-serve sticks sized for courier convenience. Import channels reward suppliers who manage tariff codes, provide residue test summaries, and keep drum availability reliable during shopping festivals when limited flavors and collaboration packs launch.
Strategic Market Indicators:
India’s market expands at 5.1%, anchored by value beverages, mass biscuits, dairy desserts, and traditional sweets moving into modern retail. Growth centers on Delhi NCR, Mumbai, Pune, Ahmedabad, and Bengaluru, where mills and converters need heat-tolerant syrups that avoid caramel notes during long hauls and hot-fill. Wins come from SKUs that bridge kirana and modern trade: small pet jars, pillow packs, and food-service drums with clear dose charts for chain kitchens. Mithai and bakery producers request crystals that cut clean and keep moisture in check so products travel better during festivals. Syrup grades with predictable brix and low invert variability reduce flavor swings when water quality shifts. Distributor success improves with drum-split services, GST-clean billing, and depot playbooks for monsoon periods. Education for small plants on graining prevention and hygienic handling reduces returns, while co-branding on festival packs boosts visibility without heavy ad spend.
Market Intelligence Brief:
Germany’s 3.6% growth rate is supported by precise formulation across dairy, bakery, cereal coatings, and premium confectionery that require narrow particle distribution and verified purity. Buyers in Bavaria, North Rhine-Westphalia, and Baden-Württemberg emphasize clean labels, low color, and consistent sweetness curves that hold up through pasteurization and gentle baking. Retailers often pursue co-developed SKUs where sweetener matrices balance mouthfeel with portion control, so vendors that offer pilot trials and shelf-life analytics move faster through line reviews. Syrup clarity and filtration quality matter, as do traceable documents that align with EU lists. Private label programs seek predictable promo calendars and case weights that suit tight backrooms. Export-minded plants value partners who can guarantee lot matching for seasonal items, reducing sensory drift between holiday waves. Success increases when suppliers provide solvent-free statements, allergen grids, and micro counts that pass retailer audits on the first attempt.
Market Intelligence Brief:
Brazil advances at 4.2%, blending urban beverage innovation with regional confectionery and bakery known for bright flavors and generous texture. Hubs in São Paulo, Rio de Janeiro, and Belo Horizonte need mid-tier syrups that keep color stable and crystals sized for tropical handling. Distributors want credit flexibility and local safety stock to ride currency noise without losing facings. Refrigerated desserts and bakery fillings benefit from syrups that resist phase separation during transport over mixed roads. Seasonal peaks around school returns and festivals favor secondary displays and bundle pricing, so case configurations that stack easily gain floor space. Producers look for specs that tolerate modest line variability while protecting taste and shelf life. Partnerships with co-packers open regional limited editions, building loyalty among neighborhood retailers who prioritize quick replenishment and tidy outer cases.
Strategic Market Considerations:
The United States grows at 3.2%, driven by format variety across club, grocery, convenience, and food service. Beverage concentrates, RTD coffees, frozen novelties, bakery mixes, and candy all require sweetness profiles that pair with texture goals and storage realities. Retailers ask for clear ladders—value, core, and premium—with packaging that supports quick restocks and minimizes damage in high-throughput DCs. Brands succeed when syrups avoid viscosity creep in cold-fill, crystals resist caking in humidity, and spec-matched alternates are available for contingency. Data-led resets reward suppliers who present velocity protection plans for top base SKUs while testing two or three new flavors per cycle. Club pouches and family jars benefit from closure integrity and pour-control spouts that limit mess. Co-manufacturers prefer sweetener matrices that reduce clean-downs and maintain mouthfeel across private-label runs.
Market Intelligence Brief:
The United Kingdom advances at 2.9%, with portion control and tidy pack formats central to retailer plans. Supermarkets and discounters want shelf-ready outers, simple front-of-pack cues, and predictable case weights. Growth leans on biscuits, breakfast items, chilled desserts, and flavored drinks where taste integrity and texture carry repeat purchase. Syrups that remain clear in tea and light beverages, crystal grades that bake evenly without mottling, and pouches sized for lunchbox baking support category health. Private label ranges request matched sweetness across flavor rotations, so small pilot runs and clear sensory notes reduce rework. Logistics favor compact packs for narrow backrooms and rapid scans at checkout. Wins accrue to suppliers who maintain consistent micro counts, deliver on time through UK DCs, and provide concise documentation for retailer audits.
Market Intelligence Brief:
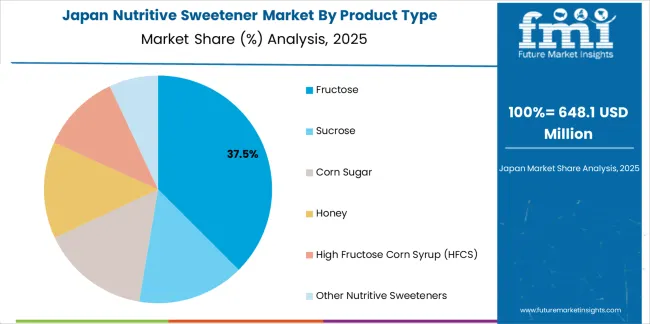
Japan posts 2.4% growth, defined by refined taste profiles, compact packaging, and careful pacing across convenience channels. Confectionery, jellies, chilled desserts, and bakery mini-packs rely on sweeteners that deliver clean flavor without lingering notes. Buyers in Tokyo, Osaka, and Nagoya value near-colorless syrups, fine crystals, and documentation that supports meticulous QC. Convenience stores prefer mini pouches and tidy jars that fit limited facings, while gift-oriented packs need flawless seals and scuff-resistant labels. Success increases when dissolution is fast in cold liquids and texture remains stable through humid summers. Limited regional flavors require small-lot runs with tight lot matching so repeat purchases feel identical month to month. Vendors that provide JP-language COAs, storage guidance, and year-over-year sensory anchors earn stable placement.
Strategic Market Considerations:
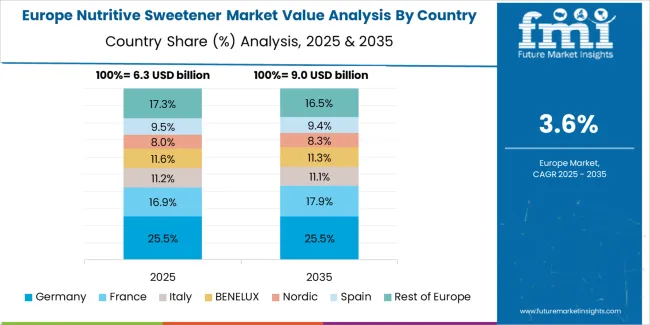
The European nutritive sweetener market is projected to grow from USD 7.6 billion in 2025 to USD 9.8 billion by 2035, registering a CAGR of 2.5%. Germany is expected to maintain leadership with a 31% share in 2025, supported by precise formulation and retailer collaboration. The United Kingdom follows with 21% through portion-controlled formats and private label programs. France holds 18% via bakery and confectionery strongholds; Italy accounts for 15% tied to dessert and beverage usage; Spain carries 10%, with the rest of Europe rising from 5% to 5.5% by 2035 as Central and Nordic retailers expand shelf-ready cases and disciplined quality checks.
| Stakeholder | What they actually control | Typical strengths | Typical blind spots |
|---|---|---|---|
| Integrated agri-processors | Crop production, processing capacity, global distribution | Supply security, cost position, scale economics | Innovation speed; specialty products |
| Specialty ingredient suppliers | Application expertise, custom formulations, technical service | Differentiation, premium pricing, customer intimacy | Production scale; commodity competition |
| Organic sweetener producers | Organic certification, sustainable sourcing, niche positioning | Premium segments, brand loyalty, clean-label credentials | Volume constraints; price sensitivity |
| Regional processors | Local market access, cultural understanding, responsive service | Geographic proximity, relationship focus, flexibility | Technology gaps; international reach |
| Traders and distributors | Market access, logistics networks, credit facilitation | Geographic coverage, product variety, risk management | Margin pressure; supplier dependency |
| Item | Value |
|---|---|
| Quantitative Units | USD 24.4 billion |
| Product Type | Fructose, Sucrose, Corn Sugar, Honey, High Fructose Corn Syrup (HFCS), Other Nutritive Sweeteners |
| Nature | Organic, Conventional |
| End Use | Household/Retail, Food Processing, Bakery, Confectionery, Beverages, Pharmaceuticals |
| Distribution Channel | Direct Sales, Indirect Sales, Store-Based Retailing (Hypermarket/Supermarket, Convenience Store, Discount Store), Online/E-Commerce |
| Regions Covered | Asia Pacific, North America, Europe, Latin America, Middle East & Africa |
| Countries Covered | China, India, United States, Germany, United Kingdom, Japan, France, Brazil, Canada, Australia, Mexico, Italy, Spain, South Korea, Thailand, and 25+ additional countries |
| Key Companies Profiled | Tate & Lyle, Cargill Inc., Showa Sangyo, Japan Corn Starch Co., COFCO International, ADM, Ingredion, Südzucker, Tereos, Associated British Foods |
| Additional Attributes | Revenue analysis by product type and end-use categories, regional consumption patterns across Asia Pacific, North America, and Europe, competitive landscape with integrated processors and specialty suppliers, consumer preferences for organic certification and clean-label ingredients, distribution channel dynamics across retail and food processing sectors, innovations in functional sweetener blends and sustainable sourcing, development of application-specific solutions with technical service and formulation support capabilities |
The global nutritive sweetener market is estimated to be valued at USD 24.4 billion in 2025.
The market size for the nutritive sweetener market is projected to reach USD 37.5 billion by 2035.
The nutritive sweetener market is expected to grow at a 4.4% CAGR between 2025 and 2035.
The key product types in nutritive sweetener market are fructose, sucrose, corn sugar, honey, high fructose corn syrup (hfcs) and other nutritive sweeteners.
In terms of nature, conventional segment to command 75.0% share in the nutritive sweetener market in 2025.


Full Research Suite comprises of:
Market outlook & trends analysis
Interviews & case studies
Strategic recommendations
Vendor profiles & capabilities analysis
5-year forecasts
8 regions and 60+ country-level data splits
Market segment data splits
12 months of continuous data updates
DELIVERED AS:
PDF EXCEL ONLINE
Sweetener Market Analysis – Size, Share, and Forecast Outlook 2025 to 2035
Assessing Sweetener Market Share & Industry Dynamics
United Kingdom Sweetener Market Trends – Size, Demand & Forecast 2025–2035
USA Sweetener Market Report – Trends, Demand & Industry Forecast 2025–2035
Analysis and Growth Projections for Dry Sweeteners Market
Corn Sweeteners Market Outlook - Growth, Demand & Forecast 2025 to 2035
ASEAN Sweetener Market Growth – Trends, Demand & Innovations 2025–2035
Novel Sweeteners Market Analysis by Product Type, End Use, Application and Region from 2025 to 2035
Polyol Sweeteners Market Analysis - Size, Share, & Forecast Outlook 2025 to 2035
Europe Sweetener Market Outlook – Share, Growth & Forecast 2025–2035
Australia Sweetener Market Analysis – Size, Share & Forecast 2025–2035
Intensive Sweeteners Market Analysis by Nature, Type, Application, Sales Channel and Region through 2035
Fermented Sweeteners Market
Analysis and Growth Projections for Artificial Sweetener Business
Low-calorie Sweeteners Market Analysis - Size, Share, and Forecast Outlook 2025 to 2035
Animal Feed Sweetener Market – Growth, Innovations & Market Demand
Natural Malt Sweeteners Market
Peptide-based Sweetener Size and Share Forecast Outlook 2025 to 2035
Low Intensity Sweeteners Market Size and Share Forecast Outlook 2025 to 2035
Latin America Sweetener Market Trends – Growth, Demand & Forecast 2025–2035

Thank you!
You will receive an email from our Business Development Manager. Please be sure to check your SPAM/JUNK folder too.
Chat With
MaRIA