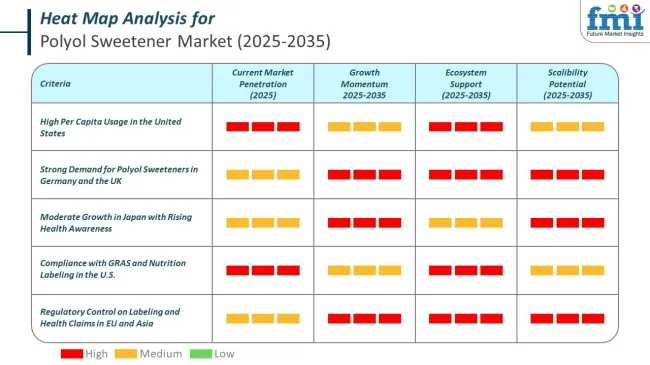
Polyol Sweetener Market Size, Share, and Forecast Outlook 2025 to 2035

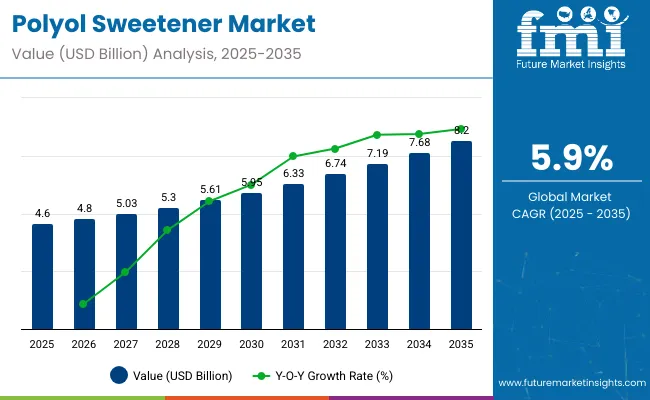
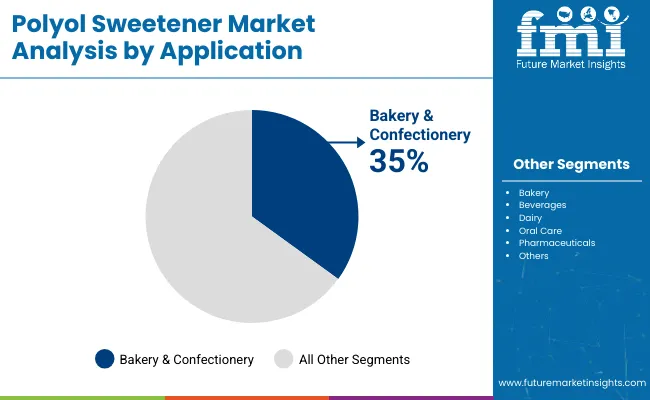
The Polyol Sweeteners market is expected to grow from USD 4.6 Billion in 2025 to USD 8.2 Billion by 2035. The Polyol Sweeteners Market CAGR is expected to be around 7.19% during the forecast period 2025 to 2035. Growth is being underpinned by sorbitol’s sustained dominance, with the ingredient projected to command roughly 25% of global revenue, while confectionery applications are forecast to absorb close to 35% of overall demand as brands reformulate candy, gum, and chocolate for calorie-conscious consumers.

Regulatory support for sugar reduction, combined with steady capacity expansions and process innovations, is anticipated to keep competition active and broaden uptake in pharmaceuticals and personal-care products.
Quick Stats of Polyol Sweetener Market

  • Market Value (2025): USD 4.6 billion
  • Forecast Value (2035): USD 8.2 billion
  • Forecast CAGR (2025 to 2035): 5.9%
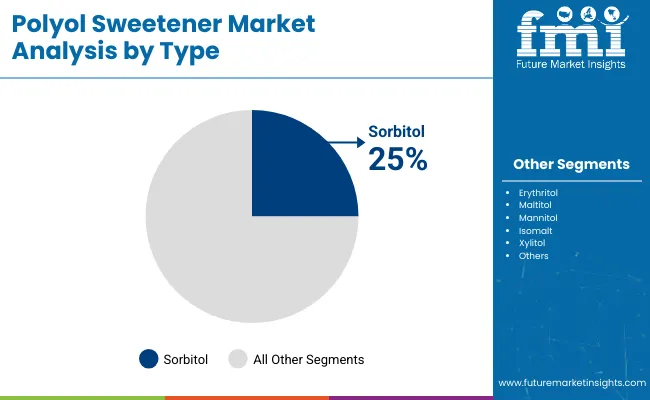
  • Segment Leader by Type (2025): Sorbitol (25% share)
  • Top Segment by Application: Bakery & Confectionary (35% share)
  • Key Growth Region: United States (29% share)

Polyol Sweetener Market Industry Value Analysis

Attributes Key Statistics
Base Year Value (2025) USD 4.6 billion
Expected Forecast Value (2035) USD 8.2 billion
Estimated Growth (2025 to 2035) 5.9%

The United States is projected to retain roughly 29% of global polyol sweetener revenue through 2035, so it is viewed as the largest single market, while China is expected to log the quickest absolute gains at about 5.4% CAGR as sugar-reduction mandates are adopted nationwide.

Japan is anticipated to expand steadily on the back of an ageing, diabetic-prone population, and Australia, despite holding just over 2% share, is forecast to post the sharpest relative growth. Across these leading countries, sorbitol is predicted to remain the primary product, and confectionery applications are likely to keep their position as the top demand centre, prompting suppliers to scale capacity and release cleaner-label formulations that match evolving calorie-conscious preferences.

Analysis of Polyol Sweeteners Market by Top Investment Segments

The global polyol sweeteners market is experiencing significant growth, driven by consumer demand for low-calorie options. Sorbitol, with a 25% market share, is a key driver, valued for its ability to enhance freshness and retain moisture. Its use is expanding across pharmaceuticals and cosmetics. The confectionery industry, holding a 35% share, also heavily adopts polyols for their low-calorie and bulking benefits, addressing the rising preference for healthier treats.
Sorbitol Drives Demand for Intensive Sweeteners Worldwide

Polyol Sweetener Market Analysis By Type

The global polyol sweeteners market is experiencing robust growth, primarily fueled by a surging consumer demand for low-calorie and sugar-free alternatives in various food and beverage products. Sorbitol, a key player in this market with an estimated 25% share, is at the forefront of this expansion. Its versatility stems from its ability to extend product freshness, prevent decay, and maintain moisture content, particularly crucial in bakery items. For instance, sorbitol is commonly used in cakes and pastries to keep them soft and fresh for longer periods.

Derived from the catalytic hydrogenation of d-glucose, sorbitol serves as a multifaceted ingredient, functioning as a bulking agent, sequestrant, thickener, sweetener, and humectant. Beyond food applications, sorbitol's demand is escalating in the pharmaceutical sector, where it acts as a vital stabilizer and excipient in drug formulation and the synthesis of synthetic vitamin C.
Confectionery Industry Favors Low Calorie Sweeteners Significantly

Polyol Sweetener Market Analysis By Application

The confectionery industry represents a significant segment within the polyol sweeteners market, holding a substantial 35% market share. This dominance is driven by a global shift towards healthier, low-calorie confectionery items. Polyol sweeteners offer a competitive advantage over traditional sugar, as they can be used in comparable amounts while providing fewer calories.

For example, in sugar-free chocolates, polyols replace sugar directly, maintaining the texture and sweetness without the added calories. Unlike high-intensity sweeteners, which are used sparingly due to their extreme sweetness, polyols also act as effective bulking agents, contributing to the desired texture and mouthfeel of candies and beverages.

Sugar-free chewing gum often utilizes polyols like sorbitol to provide bulk and a sustained sweet taste without contributing to tooth decay, which is a major benefit for consumers. This functional duality makes them highly appealing to manufacturers striving to create appealing and health-conscious products.

Key Market Highlights

Sugar Alcohols Chugs the Global Polyol Industry

  • The global polyol sweeteners market is anticipated to be driven by rising consumer awareness of general health and well-being and rising demand for sugar replacements in the food and beverage industry.
  • Polyol sweeteners, which come from saccharide derivatives derived from bio-wastes like birch bark, maize cobs, and pulp and paper waste, are produced by fermentation or hydro-generation carbohydrates.
  • The essence, or sugar alcohol, is a beneficial ‘natural’ element in various applications, including food, pharmaceutical, cosmetics, and other technical and chemical sectors.
  • Furthermore, the substance finds application in the tobacco, textile, and paper industries as a humectant, bulking agent, binder, and chemical reactant.

Healthy Sweeteners Satisfy the Sweet Tooth Worldwide

  • The rising demand of healthy alternatives, particularly the ones of sucrose which is high in calories and is related to many diseases like diabetes and obesity, is the major reason behind the growth of worldwide artificial sweeteners industry.
  • Polyols are sugarless sweeteners frequently used as sugar alternatives in baked goods, fruit juices, chewing gum, gelatines, dairy products, carbonated drinks, jams, and jellies.
  • For instance, the American Heart Association, a charity, states that added sugars Americans ingest come from sugary drinks.
  • The global market for polyol sweeteners is expanding due to consumers' growing desire for sugar-free drinks.

Historical Analysis of the Polyol Sweeteners Market

The global market for polyol sweeteners witnessed a substantial growth rate of 6.90% between 2020 and 2024, resulting in a valuation of USD 4,100 million. The market is expected to maintain its growth momentum in the upcoming years and is anticipated to register a CAGR of 7.19% between 2025 and 2035.

Attributes Key Statistics
Market Value (2024) USD 4,317.3 million
Market Share (2025) USD 4.6 billion
Estimated Growth (2020 to 2024) 6.90%
  • The market for raw sugar alternatives is driven by consumers' shifting preferences for clean-label products, such as natural, fresh, sustainable, and non-GMO.
  • Natural sugar replacements are a secure and healthful addition to plant-based foods.
  • The growing inclination towards natural sweeteners like stevia as a sugar substitute is anticipated to pose a significant obstacle for the worldwide polyol sweeteners industry.

Consumption Analysis of the Polyol Sweeteners Market

  • Polyols are carbohydrates that are challenging to digest. Despite having a similar structure to sugar, they have distinct biological benefits. Polyols have several health benefits in addition to their sweetness and being multipurpose. Polyols do not affect blood sugar or tooth decay. The demand for sugar-free diets will increase because polyol is expected to rise in the following decade.
  • Sweeteners are necessary for many distinct items, such as syrups, pills, liquids, lotions, emulsion balms, and capsules. They can be substituted with polyol sweeteners, which have a high spreading potential and lower dental decay in over-the-counter drugs. The market for polyol sweeteners may be split into two segments: fluid and powder. Powder-state polyol sweeteners are anticipated to remain dominant in the market and be in high demand.
  • The market for polyol sweeteners is driven worldwide by the rising use of sugar substitutes in food preparation, healthy diets, organic foods, reduced calorie intake, and natural ingredients in nutritional supplements, medications, and cosmetics. Significant opportunities are also presented by healthcare trends, health education, changing lifestyles, and an increase in the incidence of diseases.
  • Owing to the widespread use of sugar substitutes in several beverages, the beverage industry is predicted to have favorable development. The producers are creating functional drinks using polyol sugar alternatives to satisfy consumers' increasing need for low-calorie beverages.
  • Governments and consumers prioritize reducing sugar intake since diabetes incidence and obesity rates are rising globally. Since sweeteners reduce calorie and sugar intake, they are essential for addressing these health concerns.
  • To lower the amount of sugar in food and drink, governments everywhere have implemented sugar levies and controls. The sector has grown due to food and beverage manufacturers being forced to utilize sweeteners to minimize the amount of sugar to comply with regulations and avoid paying extra taxes.

Country-wise Insights

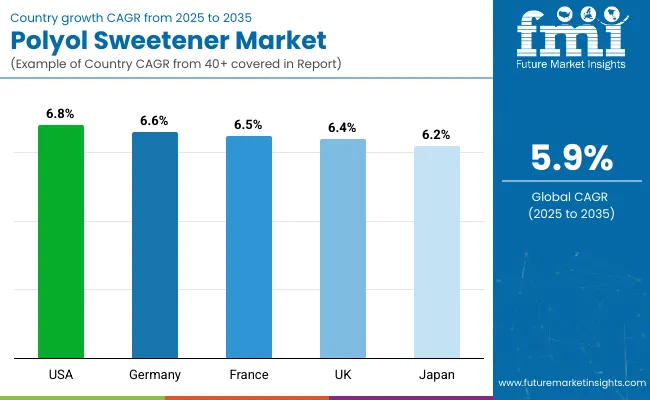
Polyol Sweetener Market Cagr Analysis By Country

United States - Polyol Sweeteners Market Outlook

The United States market is projected to advance at a 6.8% CAGR between 2025 and 2035. Expansion is being propelled by stringent “added-sugar” labelling rules, soda-tax schemes in several states, and the country’s growing diabetic population.

Although sucrose prices remain favourable, brand owners have been compelled to reformulate flagship lines and adopt polyols that offer bulk without spiking glycaemic response. Reliable sorbitol and maltitol supply is ensured by large Midwestern corn-wet-milling complexes, while new fermentation facilities in the Gulf region are scaling up zero-calorie erythritol. Market concentration remains high, yet regional confectioners continue to sign long-term offtake contracts with ingredient majors.

  • FDA nutrition-facts disclosure has pressed beverage, bakery, and snack producers to cut sucrose, encouraging polyol substitution for texture and sweetness.
  • State-level calorie levies on soft drinks are steering bottlers toward erythritol-stevia blends that allow tax-free positioning.
  • Xylitol toothpaste and mouthwash ranges have been broadened, supporting steady oral-care demand.
  • Corn supply resilience shields producers from raw-material volatility, keeping sorbitol pricing comparatively stable.
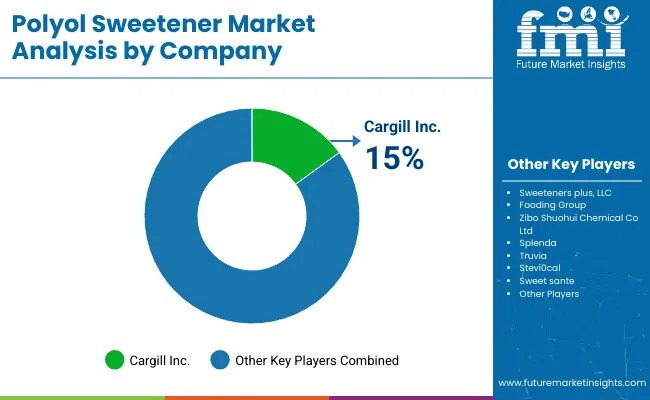
  • Capital expenditure by Cargill and Ingredion on spray-drying lines is expected to lift crystalline-grade output after 2027.

United Kingdom - Polyol Sweeteners Market Outlook

Sales of polyol sweeteners in United Kingdom are expected to grow at a 6.4% CAGR from 2025 to 2035. Momentum is being provided by the Soft Drinks Industry Levy, Public Health England’s sugar-reduction targets, and heightened consumer awareness of glycaemic control.

Beverage manufacturers have been reformulating with erythritol and monk-fruit combinations to remain below taxable thresholds, while confectioners are releasing “no added sugar” chocolate using maltitol or isomalt. Domestic start-ups are piloting fermentation-based production in Teesside and Norfolk, which will widen local supply. Despite inflationary pressure on raw materials, retailer commitment to healthier store-brand lines is maintaining volume growth across grocery and e-commerce channels.

  • The levy has driven leading bottlers to pivot toward polyol-based sweetening systems that avoid the highest tax band.
  • British Nutrition Foundation guidance is encouraging public acceptance of low-glycaemic bulk sweeteners in children’s snacks.
  • Online retailers report double-digit growth for diabetic bakery mixes formulated with xylitol and sorbitol.
  • Regional confectioners in York and Birmingham are trialling isomalt coatings to extend shelf life without sugar bloom.
  • Teesside fermentation projects promise domestic erythritol, reducing reliance on continental imports after 2027.

France - Polyol Sweeteners Market Outlook

Demand for polyol sweeteners in France is forecast to register a 6.5% CAGR during 2025 to 2035, underpinned by the Nutri-Score labelling scheme and the country’s sophisticated functional-foods sector. Food manufacturers have been urged to improve Nutri-Score grades, so sucrose is being replaced with maltitol, lactitol, and erythritol to lower calorie density.

Dairy-dessert producers employ lactitol to preserve mouthfeel, while gummy-candy makers use isomalt to combat moisture migration. The French Syndicate for Oral Health continues to endorse xylitol chewing gum, reinforcing consumer confidence. Roquette’s Lestrem complex is undergoing expansion that will raise crystalline maltitol capacity by 20 %, ensuring secure regional supply through the next decade.

  • Nutri-Score pressure has accelerated polyol uptake across chocolate spreads, breakfast cereals, and chilled desserts.
  • Lactitol enables reduced-sugar flans and yoghurts while maintaining viscosity, supporting premium positioning.
  • Xylitol-based dental-health claims attract adult consumers seeking caries prevention, boosting gum sales.
  • Isomalt adoption in wine gummies mitigates stickiness and extends ambient shelf life.
  • The Roquette capacity upgrade is expected to stabilise domestic maltitol pricing and shorten lead times

Germany - Polyol Sweeteners Market Outlook

Germany’s polyol sweeteners market is anticipated to expand at a 6.6% CAGR to 2035, driven by federal sugar-reduction targets and a strong nutraceutical culture. Large confectionery houses in Cologne and Aachen are accelerating trials that blend maltitol with high-intensity sweeteners for calorie-efficient chocolate.

Pharmaceutical demand for sorbitol and xylitol in chewable tablets and syrups remains firm, aided by stringent excipient quality standards. The German Confectionery Association has published technical dossiers demonstrating polyol processing advantages, facilitating wider adoption. New high-purity erythritol plants in Saxony-Anhalt will enhance EU supply security and reduce freight emissions tied to Asian imports.

  • Government targets to cut sugar 20% by 2028 have motivated cereal and biscuit reformulations using sorbitol syrup.
  • Xylitol demand in sugar-free lozenges and throat pastilles remains buoyant, lifting speciality-grade imports.
  • Confectionery guidelines outline cooling-effect management when substituting sucrose with erythritol, easing R&D hurdles.
  • Keto snack brands leverage isomalt and maltitol to market net-carb reductions without compromising crunch.
  • Planned erythritol facilities aim to meet FSSC 22000 pharma-grade standards, positioning Germany as a regional supply hub.

Japan - Polyol Sweeteners Market Outlook

Japan is projected to grow at a 6.2% CAGR through 2035, supported by the country’s healthy-ageing agenda and the well-established FOSHU framework. Xylitol chewing gum, carrying dental-health claims approved by consumer-affairs authorities, continues to dominate the functional-confectionery aisle.

Beverage formulators are blending stevia with maltitol syrups to achieve authentic sweetness while qualifying for reduced-calorie labelling. Ageing demographics have heightened interest in low-glycaemic snacks featuring erythritol, and vending-machine operators are adding such products nationwide. Domestic corn-starch suppliers cooperate with universities on enzymatic efficiency upgrades to lower production costs and secure long-term competitiveness against imported polyols.
  • FOSHU approvals grant xylitol products a trusted health halo, sustaining premium price points in convenience stores.
  • Elderly consumers prefer erythritol-based baked goods that avoid sudden blood-sugar spikes yet deliver familiar flavours.
  • Beverage giants are reformulating canned coffee with maltitol-stevia combinations to meet calorie caps without altering taste.
  • Government metabolic-syndrome guidelines recommend lower-sugar diets, indirectly stimulating polyol adoption.
  • Joint industry-academic research seeks process tweaks that raise sorbitol yield, improving domestic supply resilience and price stability.

Competitive Landscape in the Polyol Sweeteners Market

The polyol sweeteners industry is characterised by a clear two-tier structure. Tier 1 suppliers comprise integrated agribusiness and ingredient firms with global footprints, extensive corn-wet-milling or cane-processing assets, and in-house application laboratories. Cargill, Archer Daniels Midland, Ingredion, Roquette, and Tereos fall into this category.

Their broad portfolios cover sorbitol, maltitol, erythritol, and xylitol, and their distribution is handled through long-term agreements with logistics specialists such as Brenntag and IMCD. These leading companies are investing in new crystallisation towers, enzymatic conversion routes, and fermentation reactors to shorten lead times and improve cost positions. Advisory teams are being deployed to co-develop reduced-sugar recipes with multinational confectioners and beverage bottlers, locking in multi-year supply contracts.

Tier 2 producers operate regionally or focus on high-purity niches. Firms such as Matsutani Chemical (Japan), Jungbunzlauer (Austria), HYET Sweet (Netherlands), Sukhjit Starch (India), and Shandong Biete (China) specialise in single-polyol lines or pharmaceutical grades. Their competitive edge is maintained through flexible batch sizes, rapid customisation, and strict compliance with pharmacopeial standards.

Many are adopting membrane-filtration upgrades and energy-efficient evaporators to meet tightening cost targets. Collaboration with contract manufacturers in Southeast Asia is widening geographic reach without heavy capital expenditure.

The overall supplier landscape remains partnership-driven. Formulation support centres are being opened near cluster hubs in Illinois, Picardy, and Shandong so that customers can trial polyol blends under real-plant conditions. Raw-material hedging strategies are being expanded to shield downstream clients from corn-price swings. Certification against FSSC 22000 and IPEC-PQG guidelines is viewed as a passport to premium excipient tenders in Europe and North America.

Recent Industry Developments

  • Archer Daniels Midland Company (ADM) made significant investments in research and innovation in 2024 to enhance its polyol sweetener production processes and expand its product offerings, responding to growing demand for healthier, low-calorie food ingredients
  • Ingredion continued to expand its ERYSTA® erythritol line in 2024, supporting manufacturers in reducing or replacing sugar in a wide range of applications, including baked goods, beverages, and confectionery, to meet nutrition-related claims and consumer demand for healthier options.
  • Cargill launched a new polyol sweetener called Zerose in 2024, designed to deliver a clean taste and improved texture, making it suitable for a wide range of reduced-sugar and sugar-free products

Key Companies in the Polyol Sweeteners Market

  • Cargill, Inc.
  • Sweeteners plus, LLC
  • Fooding Group
  • Zibo Shuohui Chemical Co Ltd
  • Splenda
  • Truvia
  • Stevi0cal
  • Sweet sante
  • B Food Science Co., Ltd.
  • Gulshan Polyols Ltd.
  • Ingredion Inc.
  • Roquette Frères
  • PT. Ecogreen Oleochemicals
  • Mitsubishi Corporation Life Sciences Ltd.
  • Tereos
  • SPI Pharma
  • HYET Sweet
  • Jungbunzlauer Suisse AG
  • DFI Corp.
  • Sukhjit Starch & Chemicals Ltd.
  • Zhejiang Huakang Pharmaceutical Co., Ltd.
  • Shandong Futaste Co.
  • Dancheng Caixin Sugar Industry Co. Ltd.
  • Shijiazhuang Huaxu Pharmaceutical Co., Ltd.
  • DuPont Nutrition & Health (Danisco)
  • zuChem
  • Zibo Shunda Biotech Co., Ltd.
  • Hylen Co., Ltd.
  • BENEO GmbH
  • Foodchem International Corp.

Report Scope - Polyol Sweeteners Market

Report Attribute Details
Market Size (2025) USD 4.6 billion
Projected Market Size (2035) USD 8.2 billion
CAGR (2025 to 2035) 5.9%
Base Year for Estimation 2024
Historical Period 2019 to 2024
Projection Period 2025 to 2035
Quantitative Units USD billion (value) and kilotons (volume)
Product Types Analysed Sorbitol, Xylitol, Maltitol, Erythritol, Mannitol, Isomalt, Lactitol
Form Types Analysed Powder / Crystal, Liquid Syrup
Application Segments Analysed Confectionery, Bakery, Dairy, Beverages, Pharmaceuticals, Personal Care
Feed-stock Sources Analysed Corn-derived, Sugar-beet / Sugar-cane based
End-use Channels Covered B2B Ingredient Supply, Contract Manufacturing, Private-label Brands
Distribution Channels Covered Direct Sales, Specialty Distributors, E-commerce Ingredient Portals
Regions Covered North America, Europe, Asia Pacific, Latin America, Middle East & Africa
Countries Covered United States, Canada, United Kingdom, France, Germany, Italy, Spain, Japan, China, South Korea, India, Brazil, Mexico, Australia, GCC
Key Players Influencing the Market Cargill, Archer Daniels Midland, Ingredion, Roquette, Tereos, Matsutani Chemical, Jungbunzlauer, HYET Sweet, Sukhjit Starch, Shandong Biete
Additional Attributes Dollar-sales growth by product type, regional demand trends, price-trend analysis, cost-structure breakdown, supply–demand balance, regulatory landscape review, formulation benchmarking, competitive intensity mapping

Key Segmentation

By Type:

  • Sorbitol
  • Erythritol
  • Maltitol
  • Mannitol
  • Isomalt
  • Xylitol
  • Others

By Form:

  • Powder
  • Crystal
  • Liquid
  • Syrup

By Application:

  • Bakery
  • Confectionery
  • Beverages
  • Dairy
  • Oral Care
  • Pharmaceuticals
  • Others

By Region:

  • North America
  • Europe
  • Asia Pacific
  • Latin America
  • The Middle East & Africa

Table of Content

  • 1. Executive Summary
  • 2. Market Overview
  • 3. Market Background
  • 4. Global Market Analysis 2020 to 2024 and Forecast, 2025 to 2035
  • 5. Global Market Analysis 2020 to 2024 and Forecast 2025 to 2035, By Type
    • 5.1. Sorbitol
    • 5.2. Erythritol
    • 5.3. Maltitol
    • 5.4. Isomalt
    • 5.5. Xylitol
  • 6. Global Market Analysis 2020 to 2024 and Forecast 2025 to 2035, By Form
    • 6.1. Powder/Crystal
    • 6.2. Liquid/Syrup
  • 7. Global Market Analysis 2020 to 2024 and Forecast 2025 to 2035, By Application
    • 7.1. Bakery & Confectionery
    • 7.2. Beverages
    • 7.3. Dairy
    • 7.4. Oral Care
    • 7.5. Pharmaceuticals
    • 7.6. Others
  • 8. Global Market Analysis 2020 to 2024 and Forecast 2025 to 2035, By Region
    • 8.1. North America
    • 8.2. Latin America
    • 8.3. Western Europe
    • 8.4. Eastern Europe
    • 8.5. South Asia and Pacific
    • 8.6. East Asia
    • 8.7. Middle East and Africa
  • 9. North America Market Analysis 2020 to 2024 and Forecast 2025 to 2035, By Country
  • 10. Latin America Market Analysis 2020 to 2024 and Forecast 2025 to 2035, By Country
  • 11. Western Europe Market Analysis 2020 to 2024 and Forecast 2025 to 2035, By Country
  • 12. Eastern Europe Market Analysis 2020 to 2024 and Forecast 2025 to 2035, By Country
  • 13. South Asia and Pacific Market Analysis 2020 to 2024 and Forecast 2025 to 2035, By Country
  • 14. East Asia Market Analysis 2020 to 2024 and Forecast 2025 to 2035, By Country
  • 15. Middle East and Africa Market Analysis 2020 to 2024 and Forecast 2025 to 2035, By Country
  • 16. Key Countries Market Analysis
  • 17. Market Structure Analysis
  • 18. Competition Analysis
    • 18.1. Cargill
    • 18.2. Sweeteners plus
    • 18.3. Fooding Group
    • 18.4. Zibo Shuohui Chemical Co Ltd
    • 18.5. Splenda
    • 18.6. Now Real Food
    • 18.7. Truvia
    • 18.8. Stevi0cal
    • 18.9. Sweet sante
  • 19. Assumptions & Acronyms Used
  • 20. Research Methodology

List of Tables

  • Table 1: Global Market Value (USD Million) Forecast by Region, 2020 to 2035
  • Table 2: Global Market Volume (Tons) Forecast by Region, 2020 to 2035
  • Table 3: Global Market Value (USD Million) Forecast by Type, 2020 to 2035
  • Table 4: Global Market Volume (Tons) Forecast by Type, 2020 to 2035
  • Table 5: Global Market Value (USD Million) Forecast by Form, 2020 to 2035
  • Table 6: Global Market Volume (Tons) Forecast by Form, 2020 to 2035
  • Table 7: Global Market Value (USD Million) Forecast by Application, 2020 to 2035
  • Table 8: Global Market Volume (Tons) Forecast by Application, 2020 to 2035
  • Table 9: North America Market Value (USD Million) Forecast by Country, 2020 to 2035
  • Table 10: North America Market Volume (Tons) Forecast by Country, 2020 to 2035
  • Table 11: North America Market Value (USD Million) Forecast by Type, 2020 to 2035
  • Table 12: North America Market Volume (Tons) Forecast by Type, 2020 to 2035
  • Table 13: North America Market Value (USD Million) Forecast by Form, 2020 to 2035
  • Table 14: North America Market Volume (Tons) Forecast by Form, 2020 to 2035
  • Table 15: North America Market Value (USD Million) Forecast by Application, 2020 to 2035
  • Table 16: North America Market Volume (Tons) Forecast by Application, 2020 to 2035
  • Table 17: Latin America Market Value (USD Million) Forecast by Country, 2020 to 2035
  • Table 18: Latin America Market Volume (Tons) Forecast by Country, 2020 to 2035
  • Table 19: Latin America Market Value (USD Million) Forecast by Type, 2020 to 2035
  • Table 20: Latin America Market Volume (Tons) Forecast by Type, 2020 to 2035
  • Table 21: Latin America Market Value (USD Million) Forecast by Form, 2020 to 2035
  • Table 22: Latin America Market Volume (Tons) Forecast by Form, 2020 to 2035
  • Table 23: Latin America Market Value (USD Million) Forecast by Application, 2020 to 2035
  • Table 24: Latin America Market Volume (Tons) Forecast by Application, 2020 to 2035
  • Table 25: Western Europe Market Value (USD Million) Forecast by Country, 2020 to 2035
  • Table 26: Western Europe Market Volume (Tons) Forecast by Country, 2020 to 2035
  • Table 27: Western Europe Market Value (USD Million) Forecast by Type, 2020 to 2035
  • Table 28: Western Europe Market Volume (Tons) Forecast by Type, 2020 to 2035
  • Table 29: Western Europe Market Value (USD Million) Forecast by Form, 2020 to 2035
  • Table 30: Western Europe Market Volume (Tons) Forecast by Form, 2020 to 2035
  • Table 31: Western Europe Market Value (USD Million) Forecast by Application, 2020 to 2035
  • Table 32: Western Europe Market Volume (Tons) Forecast by Application, 2020 to 2035
  • Table 33: Eastern Europe Market Value (USD Million) Forecast by Country, 2020 to 2035
  • Table 34: Eastern Europe Market Volume (Tons) Forecast by Country, 2020 to 2035
  • Table 35: Eastern Europe Market Value (USD Million) Forecast by Type, 2020 to 2035
  • Table 36: Eastern Europe Market Volume (Tons) Forecast by Type, 2020 to 2035
  • Table 37: Eastern Europe Market Value (USD Million) Forecast by Form, 2020 to 2035
  • Table 38: Eastern Europe Market Volume (Tons) Forecast by Form, 2020 to 2035
  • Table 39: Eastern Europe Market Value (USD Million) Forecast by Application, 2020 to 2035
  • Table 40: Eastern Europe Market Volume (Tons) Forecast by Application, 2020 to 2035
  • Table 41: South Asia and Pacific Market Value (USD Million) Forecast by Country, 2020 to 2035
  • Table 42: South Asia and Pacific Market Volume (Tons) Forecast by Country, 2020 to 2035
  • Table 43: South Asia and Pacific Market Value (USD Million) Forecast by Type, 2020 to 2035
  • Table 44: South Asia and Pacific Market Volume (Tons) Forecast by Type, 2020 to 2035
  • Table 45: South Asia and Pacific Market Value (USD Million) Forecast by Form, 2020 to 2035
  • Table 46: South Asia and Pacific Market Volume (Tons) Forecast by Form, 2020 to 2035
  • Table 47: South Asia and Pacific Market Value (USD Million) Forecast by Application, 2020 to 2035
  • Table 48: South Asia and Pacific Market Volume (Tons) Forecast by Application, 2020 to 2035
  • Table 49: East Asia Market Value (USD Million) Forecast by Country, 2020 to 2035
  • Table 50: East Asia Market Volume (Tons) Forecast by Country, 2020 to 2035
  • Table 51: East Asia Market Value (USD Million) Forecast by Type, 2020 to 2035
  • Table 52: East Asia Market Volume (Tons) Forecast by Type, 2020 to 2035
  • Table 53: East Asia Market Value (USD Million) Forecast by Form, 2020 to 2035
  • Table 54: East Asia Market Volume (Tons) Forecast by Form, 2020 to 2035
  • Table 55: East Asia Market Value (USD Million) Forecast by Application, 2020 to 2035
  • Table 56: East Asia Market Volume (Tons) Forecast by Application, 2020 to 2035
  • Table 57: Middle East and Africa Market Value (USD Million) Forecast by Country, 2020 to 2035
  • Table 58: Middle East and Africa Market Volume (Tons) Forecast by Country, 2020 to 2035
  • Table 59: Middle East and Africa Market Value (USD Million) Forecast by Type, 2020 to 2035
  • Table 60: Middle East and Africa Market Volume (Tons) Forecast by Type, 2020 to 2035
  • Table 61: Middle East and Africa Market Value (USD Million) Forecast by Form, 2020 to 2035
  • Table 62: Middle East and Africa Market Volume (Tons) Forecast by Form, 2020 to 2035
  • Table 63: Middle East and Africa Market Value (USD Million) Forecast by Application, 2020 to 2035
  • Table 64: Middle East and Africa Market Volume (Tons) Forecast by Application, 2020 to 2035

List of Figures

  • Figure 1: Global Market Value (USD Million) by Type, 2025 to 2035
  • Figure 2: Global Market Value (USD Million) by Form, 2025 to 2035
  • Figure 3: Global Market Value (USD Million) by Application, 2025 to 2035
  • Figure 4: Global Market Value (USD Million) by Region, 2025 to 2035
  • Figure 5: Global Market Value (USD Million) Analysis by Region, 2020 to 2035
  • Figure 6: Global Market Volume (Tons) Analysis by Region, 2020 to 2035
  • Figure 7: Global Market Value Share (%) and BPS Analysis by Region, 2025 to 2035
  • Figure 8: Global Market Y-o-Y Growth (%) Projections by Region, 2025 to 2035
  • Figure 9: Global Market Value (USD Million) Analysis by Type, 2020 to 2035
  • Figure 10: Global Market Volume (Tons) Analysis by Type, 2020 to 2035
  • Figure 11: Global Market Value Share (%) and BPS Analysis by Type, 2025 to 2035
  • Figure 12: Global Market Y-o-Y Growth (%) Projections by Type, 2025 to 2035
  • Figure 13: Global Market Value (USD Million) Analysis by Form, 2020 to 2035
  • Figure 14: Global Market Volume (Tons) Analysis by Form, 2020 to 2035
  • Figure 15: Global Market Value Share (%) and BPS Analysis by Form, 2025 to 2035
  • Figure 16: Global Market Y-o-Y Growth (%) Projections by Form, 2025 to 2035
  • Figure 17: Global Market Value (USD Million) Analysis by Application, 2020 to 2035
  • Figure 18: Global Market Volume (Tons) Analysis by Application, 2020 to 2035
  • Figure 19: Global Market Value Share (%) and BPS Analysis by Application, 2025 to 2035
  • Figure 20: Global Market Y-o-Y Growth (%) Projections by Application, 2025 to 2035
  • Figure 21: Global Market Attractiveness by Type, 2025 to 2035
  • Figure 22: Global Market Attractiveness by Form, 2025 to 2035
  • Figure 23: Global Market Attractiveness by Application, 2025 to 2035
  • Figure 24: Global Market Attractiveness by Region, 2025 to 2035
  • Figure 25: North America Market Value (USD Million) by Type, 2025 to 2035
  • Figure 26: North America Market Value (USD Million) by Form, 2025 to 2035
  • Figure 27: North America Market Value (USD Million) by Application, 2025 to 2035
  • Figure 28: North America Market Value (USD Million) by Country, 2025 to 2035
  • Figure 29: North America Market Value (USD Million) Analysis by Country, 2020 to 2035
  • Figure 30: North America Market Volume (Tons) Analysis by Country, 2020 to 2035
  • Figure 31: North America Market Value Share (%) and BPS Analysis by Country, 2025 to 2035
  • Figure 32: North America Market Y-o-Y Growth (%) Projections by Country, 2025 to 2035
  • Figure 33: North America Market Value (USD Million) Analysis by Type, 2020 to 2035
  • Figure 34: North America Market Volume (Tons) Analysis by Type, 2020 to 2035
  • Figure 35: North America Market Value Share (%) and BPS Analysis by Type, 2025 to 2035
  • Figure 36: North America Market Y-o-Y Growth (%) Projections by Type, 2025 to 2035
  • Figure 37: North America Market Value (USD Million) Analysis by Form, 2020 to 2035
  • Figure 38: North America Market Volume (Tons) Analysis by Form, 2020 to 2035
  • Figure 39: North America Market Value Share (%) and BPS Analysis by Form, 2025 to 2035
  • Figure 40: North America Market Y-o-Y Growth (%) Projections by Form, 2025 to 2035
  • Figure 41: North America Market Value (USD Million) Analysis by Application, 2020 to 2035
  • Figure 42: North America Market Volume (Tons) Analysis by Application, 2020 to 2035
  • Figure 43: North America Market Value Share (%) and BPS Analysis by Application, 2025 to 2035
  • Figure 44: North America Market Y-o-Y Growth (%) Projections by Application, 2025 to 2035
  • Figure 45: North America Market Attractiveness by Type, 2025 to 2035
  • Figure 46: North America Market Attractiveness by Form, 2025 to 2035
  • Figure 47: North America Market Attractiveness by Application, 2025 to 2035
  • Figure 48: North America Market Attractiveness by Country, 2025 to 2035
  • Figure 49: Latin America Market Value (USD Million) by Type, 2025 to 2035
  • Figure 50: Latin America Market Value (USD Million) by Form, 2025 to 2035
  • Figure 51: Latin America Market Value (USD Million) by Application, 2025 to 2035
  • Figure 52: Latin America Market Value (USD Million) by Country, 2025 to 2035
  • Figure 53: Latin America Market Value (USD Million) Analysis by Country, 2020 to 2035
  • Figure 54: Latin America Market Volume (Tons) Analysis by Country, 2020 to 2035
  • Figure 55: Latin America Market Value Share (%) and BPS Analysis by Country, 2025 to 2035
  • Figure 56: Latin America Market Y-o-Y Growth (%) Projections by Country, 2025 to 2035
  • Figure 57: Latin America Market Value (USD Million) Analysis by Type, 2020 to 2035
  • Figure 58: Latin America Market Volume (Tons) Analysis by Type, 2020 to 2035
  • Figure 59: Latin America Market Value Share (%) and BPS Analysis by Type, 2025 to 2035
  • Figure 60: Latin America Market Y-o-Y Growth (%) Projections by Type, 2025 to 2035
  • Figure 61: Latin America Market Value (USD Million) Analysis by Form, 2020 to 2035
  • Figure 62: Latin America Market Volume (Tons) Analysis by Form, 2020 to 2035
  • Figure 63: Latin America Market Value Share (%) and BPS Analysis by Form, 2025 to 2035
  • Figure 64: Latin America Market Y-o-Y Growth (%) Projections by Form, 2025 to 2035
  • Figure 65: Latin America Market Value (USD Million) Analysis by Application, 2020 to 2035
  • Figure 66: Latin America Market Volume (Tons) Analysis by Application, 2020 to 2035
  • Figure 67: Latin America Market Value Share (%) and BPS Analysis by Application, 2025 to 2035
  • Figure 68: Latin America Market Y-o-Y Growth (%) Projections by Application, 2025 to 2035
  • Figure 69: Latin America Market Attractiveness by Type, 2025 to 2035
  • Figure 70: Latin America Market Attractiveness by Form, 2025 to 2035
  • Figure 71: Latin America Market Attractiveness by Application, 2025 to 2035
  • Figure 72: Latin America Market Attractiveness by Country, 2025 to 2035
  • Figure 73: Western Europe Market Value (USD Million) by Type, 2025 to 2035
  • Figure 74: Western Europe Market Value (USD Million) by Form, 2025 to 2035
  • Figure 75: Western Europe Market Value (USD Million) by Application, 2025 to 2035
  • Figure 76: Western Europe Market Value (USD Million) by Country, 2025 to 2035
  • Figure 77: Western Europe Market Value (USD Million) Analysis by Country, 2020 to 2035
  • Figure 78: Western Europe Market Volume (Tons) Analysis by Country, 2020 to 2035
  • Figure 79: Western Europe Market Value Share (%) and BPS Analysis by Country, 2025 to 2035
  • Figure 80: Western Europe Market Y-o-Y Growth (%) Projections by Country, 2025 to 2035
  • Figure 81: Western Europe Market Value (USD Million) Analysis by Type, 2020 to 2035
  • Figure 82: Western Europe Market Volume (Tons) Analysis by Type, 2020 to 2035
  • Figure 83: Western Europe Market Value Share (%) and BPS Analysis by Type, 2025 to 2035
  • Figure 84: Western Europe Market Y-o-Y Growth (%) Projections by Type, 2025 to 2035
  • Figure 85: Western Europe Market Value (USD Million) Analysis by Form, 2020 to 2035
  • Figure 86: Western Europe Market Volume (Tons) Analysis by Form, 2020 to 2035
  • Figure 87: Western Europe Market Value Share (%) and BPS Analysis by Form, 2025 to 2035
  • Figure 88: Western Europe Market Y-o-Y Growth (%) Projections by Form, 2025 to 2035
  • Figure 89: Western Europe Market Value (USD Million) Analysis by Application, 2020 to 2035
  • Figure 90: Western Europe Market Volume (Tons) Analysis by Application, 2020 to 2035
  • Figure 91: Western Europe Market Value Share (%) and BPS Analysis by Application, 2025 to 2035
  • Figure 92: Western Europe Market Y-o-Y Growth (%) Projections by Application, 2025 to 2035
  • Figure 93: Western Europe Market Attractiveness by Type, 2025 to 2035
  • Figure 94: Western Europe Market Attractiveness by Form, 2025 to 2035
  • Figure 95: Western Europe Market Attractiveness by Application, 2025 to 2035
  • Figure 96: Western Europe Market Attractiveness by Country, 2025 to 2035
  • Figure 97: Eastern Europe Market Value (USD Million) by Type, 2025 to 2035
  • Figure 98: Eastern Europe Market Value (USD Million) by Form, 2025 to 2035
  • Figure 99: Eastern Europe Market Value (USD Million) by Application, 2025 to 2035
  • Figure 100: Eastern Europe Market Value (USD Million) by Country, 2025 to 2035
  • Figure 101: Eastern Europe Market Value (USD Million) Analysis by Country, 2020 to 2035
  • Figure 102: Eastern Europe Market Volume (Tons) Analysis by Country, 2020 to 2035
  • Figure 103: Eastern Europe Market Value Share (%) and BPS Analysis by Country, 2025 to 2035
  • Figure 104: Eastern Europe Market Y-o-Y Growth (%) Projections by Country, 2025 to 2035
  • Figure 105: Eastern Europe Market Value (USD Million) Analysis by Type, 2020 to 2035
  • Figure 106: Eastern Europe Market Volume (Tons) Analysis by Type, 2020 to 2035
  • Figure 107: Eastern Europe Market Value Share (%) and BPS Analysis by Type, 2025 to 2035
  • Figure 108: Eastern Europe Market Y-o-Y Growth (%) Projections by Type, 2025 to 2035
  • Figure 109: Eastern Europe Market Value (USD Million) Analysis by Form, 2020 to 2035
  • Figure 110: Eastern Europe Market Volume (Tons) Analysis by Form, 2020 to 2035
  • Figure 111: Eastern Europe Market Value Share (%) and BPS Analysis by Form, 2025 to 2035
  • Figure 112: Eastern Europe Market Y-o-Y Growth (%) Projections by Form, 2025 to 2035
  • Figure 113: Eastern Europe Market Value (USD Million) Analysis by Application, 2020 to 2035
  • Figure 114: Eastern Europe Market Volume (Tons) Analysis by Application, 2020 to 2035
  • Figure 115: Eastern Europe Market Value Share (%) and BPS Analysis by Application, 2025 to 2035
  • Figure 116: Eastern Europe Market Y-o-Y Growth (%) Projections by Application, 2025 to 2035
  • Figure 117: Eastern Europe Market Attractiveness by Type, 2025 to 2035
  • Figure 118: Eastern Europe Market Attractiveness by Form, 2025 to 2035
  • Figure 119: Eastern Europe Market Attractiveness by Application, 2025 to 2035
  • Figure 120: Eastern Europe Market Attractiveness by Country, 2025 to 2035
  • Figure 121: South Asia and Pacific Market Value (USD Million) by Type, 2025 to 2035
  • Figure 122: South Asia and Pacific Market Value (USD Million) by Form, 2025 to 2035
  • Figure 123: South Asia and Pacific Market Value (USD Million) by Application, 2025 to 2035
  • Figure 124: South Asia and Pacific Market Value (USD Million) by Country, 2025 to 2035
  • Figure 125: South Asia and Pacific Market Value (USD Million) Analysis by Country, 2020 to 2035
  • Figure 126: South Asia and Pacific Market Volume (Tons) Analysis by Country, 2020 to 2035
  • Figure 127: South Asia and Pacific Market Value Share (%) and BPS Analysis by Country, 2025 to 2035
  • Figure 128: South Asia and Pacific Market Y-o-Y Growth (%) Projections by Country, 2025 to 2035
  • Figure 129: South Asia and Pacific Market Value (USD Million) Analysis by Type, 2020 to 2035
  • Figure 130: South Asia and Pacific Market Volume (Tons) Analysis by Type, 2020 to 2035
  • Figure 131: South Asia and Pacific Market Value Share (%) and BPS Analysis by Type, 2025 to 2035
  • Figure 132: South Asia and Pacific Market Y-o-Y Growth (%) Projections by Type, 2025 to 2035
  • Figure 133: South Asia and Pacific Market Value (USD Million) Analysis by Form, 2020 to 2035
  • Figure 134: South Asia and Pacific Market Volume (Tons) Analysis by Form, 2020 to 2035
  • Figure 135: South Asia and Pacific Market Value Share (%) and BPS Analysis by Form, 2025 to 2035
  • Figure 136: South Asia and Pacific Market Y-o-Y Growth (%) Projections by Form, 2025 to 2035
  • Figure 137: South Asia and Pacific Market Value (USD Million) Analysis by Application, 2020 to 2035
  • Figure 138: South Asia and Pacific Market Volume (Tons) Analysis by Application, 2020 to 2035
  • Figure 139: South Asia and Pacific Market Value Share (%) and BPS Analysis by Application, 2025 to 2035
  • Figure 140: South Asia and Pacific Market Y-o-Y Growth (%) Projections by Application, 2025 to 2035
  • Figure 141: South Asia and Pacific Market Attractiveness by Type, 2025 to 2035
  • Figure 142: South Asia and Pacific Market Attractiveness by Form, 2025 to 2035
  • Figure 143: South Asia and Pacific Market Attractiveness by Application, 2025 to 2035
  • Figure 144: South Asia and Pacific Market Attractiveness by Country, 2025 to 2035
  • Figure 145: East Asia Market Value (USD Million) by Type, 2025 to 2035
  • Figure 146: East Asia Market Value (USD Million) by Form, 2025 to 2035
  • Figure 147: East Asia Market Value (USD Million) by Application, 2025 to 2035
  • Figure 148: East Asia Market Value (USD Million) by Country, 2025 to 2035
  • Figure 149: East Asia Market Value (USD Million) Analysis by Country, 2020 to 2035
  • Figure 150: East Asia Market Volume (Tons) Analysis by Country, 2020 to 2035
  • Figure 151: East Asia Market Value Share (%) and BPS Analysis by Country, 2025 to 2035
  • Figure 152: East Asia Market Y-o-Y Growth (%) Projections by Country, 2025 to 2035
  • Figure 153: East Asia Market Value (USD Million) Analysis by Type, 2020 to 2035
  • Figure 154: East Asia Market Volume (Tons) Analysis by Type, 2020 to 2035
  • Figure 155: East Asia Market Value Share (%) and BPS Analysis by Type, 2025 to 2035
  • Figure 156: East Asia Market Y-o-Y Growth (%) Projections by Type, 2025 to 2035
  • Figure 157: East Asia Market Value (USD Million) Analysis by Form, 2020 to 2035
  • Figure 158: East Asia Market Volume (Tons) Analysis by Form, 2020 to 2035
  • Figure 159: East Asia Market Value Share (%) and BPS Analysis by Form, 2025 to 2035
  • Figure 160: East Asia Market Y-o-Y Growth (%) Projections by Form, 2025 to 2035
  • Figure 161: East Asia Market Value (USD Million) Analysis by Application, 2020 to 2035
  • Figure 162: East Asia Market Volume (Tons) Analysis by Application, 2020 to 2035
  • Figure 163: East Asia Market Value Share (%) and BPS Analysis by Application, 2025 to 2035
  • Figure 164: East Asia Market Y-o-Y Growth (%) Projections by Application, 2025 to 2035
  • Figure 165: East Asia Market Attractiveness by Type, 2025 to 2035
  • Figure 166: East Asia Market Attractiveness by Form, 2025 to 2035
  • Figure 167: East Asia Market Attractiveness by Application, 2025 to 2035
  • Figure 168: East Asia Market Attractiveness by Country, 2025 to 2035
  • Figure 169: Middle East and Africa Market Value (USD Million) by Type, 2025 to 2035
  • Figure 170: Middle East and Africa Market Value (USD Million) by Form, 2025 to 2035
  • Figure 171: Middle East and Africa Market Value (USD Million) by Application, 2025 to 2035
  • Figure 172: Middle East and Africa Market Value (USD Million) by Country, 2025 to 2035
  • Figure 173: Middle East and Africa Market Value (USD Million) Analysis by Country, 2020 to 2035
  • Figure 174: Middle East and Africa Market Volume (Tons) Analysis by Country, 2020 to 2035
  • Figure 175: Middle East and Africa Market Value Share (%) and BPS Analysis by Country, 2025 to 2035
  • Figure 176: Middle East and Africa Market Y-o-Y Growth (%) Projections by Country, 2025 to 2035
  • Figure 177: Middle East and Africa Market Value (USD Million) Analysis by Type, 2020 to 2035
  • Figure 178: Middle East and Africa Market Volume (Tons) Analysis by Type, 2020 to 2035
  • Figure 179: Middle East and Africa Market Value Share (%) and BPS Analysis by Type, 2025 to 2035
  • Figure 180: Middle East and Africa Market Y-o-Y Growth (%) Projections by Type, 2025 to 2035
  • Figure 181: Middle East and Africa Market Value (USD Million) Analysis by Form, 2020 to 2035
  • Figure 182: Middle East and Africa Market Volume (Tons) Analysis by Form, 2020 to 2035
  • Figure 183: Middle East and Africa Market Value Share (%) and BPS Analysis by Form, 2025 to 2035
  • Figure 184: Middle East and Africa Market Y-o-Y Growth (%) Projections by Form, 2025 to 2035
  • Figure 185: Middle East and Africa Market Value (USD Million) Analysis by Application, 2020 to 2035
  • Figure 186: Middle East and Africa Market Volume (Tons) Analysis by Application, 2020 to 2035
  • Figure 187: Middle East and Africa Market Value Share (%) and BPS Analysis by Application, 2025 to 2035
  • Figure 188: Middle East and Africa Market Y-o-Y Growth (%) Projections by Application, 2025 to 2035
  • Figure 189: Middle East and Africa Market Attractiveness by Type, 2025 to 2035
  • Figure 190: Middle East and Africa Market Attractiveness by Form, 2025 to 2035
  • Figure 191: Middle East and Africa Market Attractiveness by Application, 2025 to 2035
  • Figure 192: Middle East and Africa Market Attractiveness by Country, 2025 to 2035

Frequently Asked Questions

What was the overall size of the polyol sweeteners market in 2025?

The polyol sweeteners market was valued at USD 4.6 billion in 2025.

How large is the polyol sweeteners market expected to be by 2035?

The market is projected to reach USD 8.2 billion by 2035.

Which product type is projected to lead the polyol sweeteners market?

Sorbitol is expected to remain the leading product type, holding roughly 25% share.

What CAGR is the polyol sweeteners market anticipated to record from 2025 to 2035?

A CAGR of about 5.95% is anticipated for the 2025 to 2035 period.

Explore Similar Insights

Future Market Insights

Polyol Sweetener Market