The global polyolefin pipe market is projected to grow from USD 23.6 billion in 2025 to approximately USD 41.9 billion by 2035, recording an absolute increase of USD 18.27 billion over the forecast period. This translates into a total growth of 77.4%, with the market forecast to expand at a compound annual growth rate (CAGR) of 5.9% between 2025 and 2035. As per Future Market Insights, the winner of Stevie Awards for research and analytics, the market size is expected to grow by nearly 1.77X during the same period, supported by increasing urbanization, infrastructure development, and growing demand for corrosion-resistant and lightweight piping systems across various industrial and municipal applications.
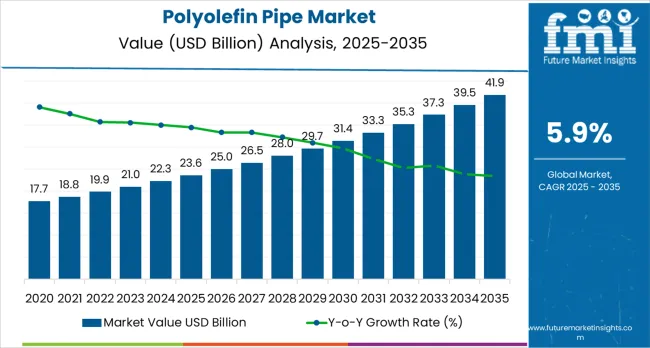
Between 2025 and 2030, the polyolefin pipe market is projected to expand from USD 23.6 billion to USD 31.48 billion, resulting in a value increase of USD 7.86 billion, which represents 43.0% of the total forecast growth for the decade. This phase of growth will be shaped by rapid urbanization across developing economies, increasing investments in water infrastructure projects, and growing adoption of advanced piping technologies in oil and gas applications. Infrastructure developers are investing in high-performance polyolefin piping systems to improve operational reliability, reduce installation costs, and extend service life in demanding environments.
From 2030 to 2035, the market is forecast to grow from USD 31.48 billion to USD 41.9 billion, adding another USD 10.41 billion, which constitutes 57.0% of the ten-year expansion. This period is expected to be characterized by expansion of smart city initiatives in developed nations, integration of advanced materials for enhanced chemical resistance, and development of specialized pipe configurations for telecommunications and power transmission applications. The growing focus on sustainable infrastructure will drive demand for recyclable and energy-efficient polyolefin piping solutions across multiple sectors including agriculture, industrial, and municipal utilities.
Between 2020 and 2025, the polyolefin pipe market experienced robust expansion, driven by accelerating infrastructure modernization in emerging markets and growing awareness of the advantages of plastic piping over traditional metal alternatives. The market developed as construction and utility sectors recognized the superior cost-effectiveness, corrosion resistance, and ease of installation offered by polyolefin pipes. Environmental regulations and durability requirements began influencing procurement decisions toward advanced polyolefin piping technologies.
| Metric | Value |
|---|---|
| Market Value (2025) | USD 23.6 billion |
| Market Forecast Value (2035) | USD 41.9 billion |
| Forecast CAGR (2025–2035) | 5.9% |
Market expansion is being supported by the rapid infrastructure development across emerging economies and the corresponding need for durable and cost-effective piping solutions in water distribution, sewage systems, and industrial applications. Modern infrastructure projects require materials that offer long service life, resistance to corrosion and chemical degradation, and ease of installation to reduce project timelines and costs. The superior performance characteristics and economic advantages of polyolefin pipes make them essential components in contemporary infrastructure development where reliability and longevity are critical.
The growing emphasis on sustainable construction practices and water conservation is driving demand for advanced piping technologies from certified manufacturers with proven track records of product quality and environmental compliance. Infrastructure operators are increasingly investing in polyolefin piping systems that offer lower lifetime costs, reduced maintenance requirements, and enhanced resistance to harsh environmental conditions over extended service periods. Regulatory requirements and industry standards are establishing performance benchmarks that favor engineered polyolefin piping solutions with advanced jointing technologies and quality assurance capabilities.
The shift from traditional metal pipes to polyolefin alternatives is accelerating due to advantages such as lighter weight for easier transportation and installation, superior flexibility for challenging terrain, excellent chemical resistance for industrial applications, and significantly reduced risk of corrosion-related failures. The polyolefin pipes require no cathodic protection or expensive coating systems, resulting in substantial cost savings throughout the product lifecycle.
The market is segmented by product type, application, end-user, and region. By product type, the market is divided into polypropylene (PP) pipes, polyethylene (PE) pipes, and plastomer configurations. Based on application, the market is categorized into power and communication, wastewater drainage, irrigation, and others. By end-user, the market includes agriculture, industrial, and others. Regionally, the market is divided into North America, Europe, East Asia, South Asia &Pacific, Latin America, Oceania, and Middle East &Africa.
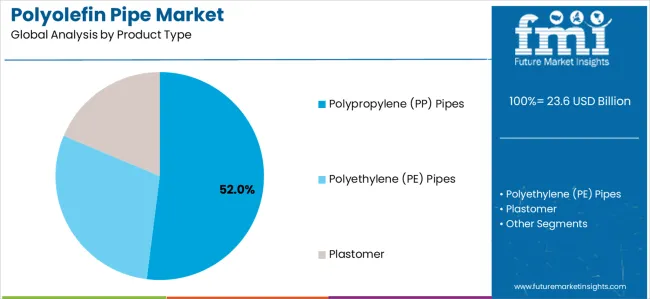
Polypropylene (PP) pipe configurations are projected to represent the dominant product segment in the polyolefin pipe market in 2025, with a market share of 52%. This leading position is supported by the increasing demand for high-temperature resistant piping solutions in industrial applications and growing adoption in chemical processing facilities. PP pipes provide superior chemical resistance, excellent thermal stability, and enhanced mechanical strength, making them the preferred choice for hot and cold water distribution, chemical transport, and industrial fluid handling applications. The segment benefits from technological advancements that have improved the impact resistance and long-term performance of PP piping systems while maintaining cost competitiveness.
Modern polypropylene pipes incorporate advanced copolymer formulations, enhanced jointing technologies, and sophisticated manufacturing processes that deliver superior performance characteristics compared to traditional materials. These innovations have significantly improved installation efficiency, reduced system maintenance requirements, and extended service life in demanding applications. The chemical and petrochemical sectors particularly drive demand for PP pipe solutions, as these industries require materials capable of handling aggressive chemicals, elevated temperatures, and high-pressure conditions while maintaining system integrity and operational safety.
The building construction industry increasingly adopts PP pipes for plumbing and HVAC applications due to their lightweight properties, ease of installation, and long-term reliability. Environmental consciousness and sustainability initiatives further accelerate market adoption, as PP pipes are fully recyclable and contribute to reduced carbon footprint in construction projects.
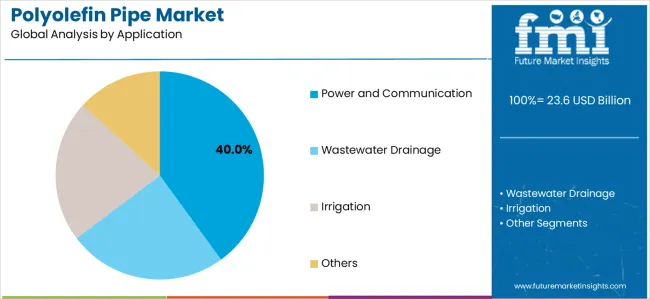
Power and communication applications are expected to represent a significant portion of polyolefin pipe demand in 2025, with a market share of 40%. This strong performance reflects the critical role of protective conduit systems in telecommunications infrastructure and the need for durable piping solutions capable of protecting sensitive cables in underground installations. Utility companies and telecommunications providers require reliable and cost-effective conduit systems for fiber optic cables, electrical wiring, and communication networks. The segment benefits from ongoing expansion of broadband infrastructure in developing countries and increasing investments in smart grid technologies requiring advanced cable protection systems.
Telecommunications infrastructure development demands exceptional piping performance to ensure long-term protection of high-value fiber optic and copper cable networks. These applications require pipes capable of withstanding soil pressures, resisting moisture ingress, and providing impact protection during installation and throughout the service life. The growing emphasis on rural connectivity programs, particularly in emerging markets across Asia-Pacific, Africa, and Latin America, drives consistent demand for cost-effective polyolefin conduit solutions. Urban infrastructure modernization projects in developed nations contribute significantly to market growth as cities upgrade aging cable networks and expand telecommunications capacity.
The trend toward renewable energy integration and smart city development creates opportunities for polyolefin pipes in electrical conduit applications. The segment also benefits from increasing deployment of underground power distribution networks, driven by aesthetic considerations and improved system reliability compared to overhead installations.
The polyolefin pipe market is advancing steadily due to increasing infrastructure investment and growing recognition of the advantages offered by plastic piping systems over traditional materials. The market faces challenges including competition from alternative materials, price volatility of raw materials, and varying regulatory standards across different regions. Innovation in material formulations and manufacturing technologies continues to influence product performance and market development patterns.
The rapid growth of urban populations worldwide is driving massive investments in water supply infrastructure, sewage systems, and drainage networks that require extensive piping installations. Municipal authorities and utility companies are prioritizing polyolefin pipes due to their long service life, reduced maintenance costs, and superior resistance to corrosion compared to metal alternatives. Smart city initiatives and sustainable urban planning programs are creating significant opportunities for advanced polyolefin piping solutions that support efficient resource management and environmental protection objectives.
The agricultural sector is increasingly adopting polyolefin pipes for irrigation systems due to their cost-effectiveness, durability, and ease of installation in diverse terrain conditions. Modern farming practices emphasize water conservation and efficient irrigation delivery, creating demand for reliable piping systems that minimize water loss and provide consistent performance across growing seasons. The expansion of precision agriculture and drip irrigation technologies particularly drives adoption of specialized polyolefin pipe configurations designed for optimal water distribution and fertilizer delivery.
Manufacturers are developing enhanced polyolefin formulations that incorporate advanced additives, improved molecular structures, and specialized coatings to expand application possibilities and improve performance characteristics. Integration of antimicrobial properties, enhanced UV resistance, and superior impact strength enables polyolefin pipes to serve increasingly demanding applications. Advanced extrusion technologies and automated quality control systems support production of consistent, high-quality pipes that meet stringent industry standards and customer specifications.
| Country | CAGR (2025–2035) |
|---|---|
| South Korea | 7.9% |
| Japan | 7.1% |
| United Kingdom | 7.0% |
| China | 6.5% |
| India | 6.5% |
| United States | 6.1% |
| Australia | 6.0% |
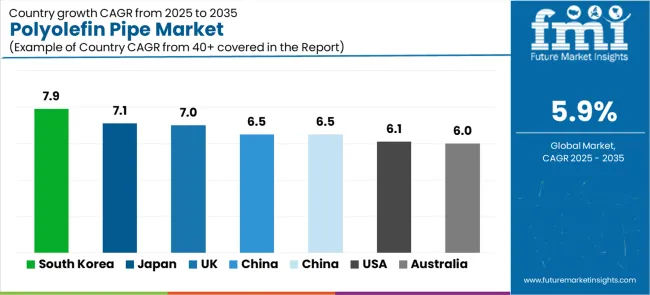
The polyolefin pipe market is growing rapidly, with South Korea leading at a 7.9% CAGR through 2035, driven by advanced infrastructure modernization programs, smart city initiatives, and expansion of telecommunications networks. The United Kingdom follows at 7.0%, supported by significant investments in water infrastructure upgrades and replacement of aging pipe networks. Japan records strong growth at 7.1%, emphasizing technological innovation, quality standards, and earthquake-resistant piping solutions. China demonstrates robust expansion at 6.5%, integrating polyolefin pipes into massive urbanization projects and agricultural development programs. The United States shows solid growth at 6.1%, focusing on infrastructure renewal and oil and gas sector applications. India maintains strong growth at 6.5%, driven by government-led water supply projects and agricultural modernization. Australia demonstrates steady expansion at 6.0%, supported by mining sector demand and residential construction activity.
The report covers an in-depth analysis of 40+ countries, Top-performing countries are highlighted below.
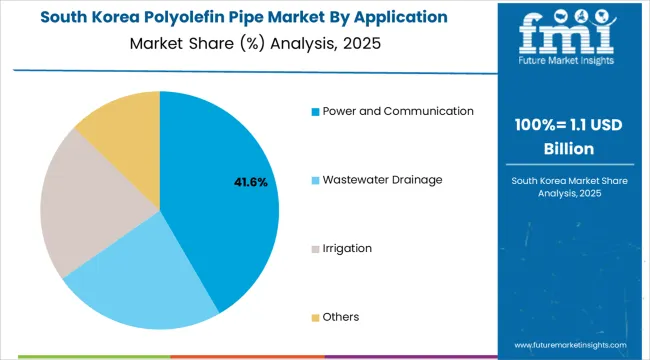
The polyolefin pipe industry in South Korea is projected to exhibit the highest growth rate with a CAGR of 7.9% through 2035, driven by comprehensive infrastructure modernization initiatives and extensive smart city development projects across major metropolitan areas. The country's advanced telecommunications infrastructure and expanding utility networks are creating substantial demand for high-performance piping solutions. Major construction companies are implementing sophisticated polyolefin pipe installations to support next-generation communication systems and sustainable urban development objectives.
The polyolefin pipe industry in the United Kingdom is expanding at a CAGR of 7.0%, supported by substantial investments in water infrastructure replacement and wastewater system upgrades across aging utility networks. The country's commitment to modernizing Victorian-era water mains and improving system efficiency is driving demand for durable polyolefin piping solutions. Water companies are prioritizing advanced pipe materials that offer extended service life and reduced leakage rates to meet regulatory performance targets.
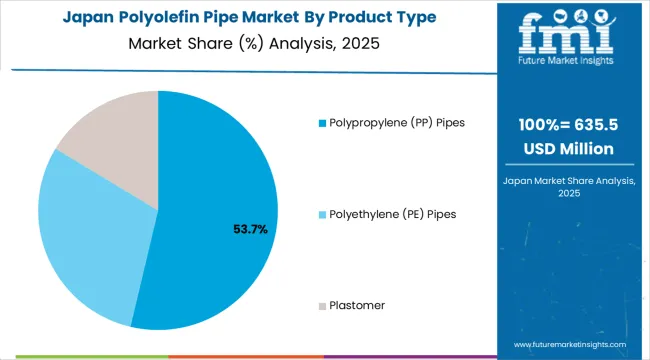
Demand for polyolefin pipe systems in Japan is projected to grow at a CAGR of 7.1%, supported by the country's emphasis on technological innovation and earthquake-resistant infrastructure solutions. Japanese construction practices incorporate advanced piping systems designed to withstand seismic activity while maintaining system integrity. The market is characterized by focus on quality, precision engineering, and compliance with stringent construction standards and safety regulations.
The polyolefin pipe industry in China is growing at a CAGR of 6.5%, driven by massive urbanization programs and extensive agricultural modernization initiatives across rural regions. The country's ambitious infrastructure development plans are creating enormous demand for cost-effective and reliable piping solutions. Municipal authorities are implementing large-scale water supply and drainage projects that require extensive polyolefin pipe installations across expanding urban centers and developing rural areas.
Demand for polyolefin pipe systems in the United States is expanding at a CAGR of 6.1%, driven by ongoing infrastructure renewal programs and significant applications in the oil and gas sector. Utility companies are replacing aging metal pipes with corrosion-resistant polyolefin alternatives that offer superior longevity and reduced maintenance requirements. The market benefits from federal infrastructure funding and growing recognition of lifecycle cost advantages offered by advanced plastic piping systems.
Demand for polyolefin pipe systems in India is projected to grow at a CAGR of 6.5%, supported by government-led initiatives to improve water access and agricultural productivity across rural regions. Major programs focused on universal water supply and irrigation infrastructure development are creating substantial demand for affordable and reliable piping solutions. The market is characterized by emphasis on cost-effectiveness, durability, and suitability for diverse installation conditions across varied terrain and climate zones.
Demand for polyolefin pipe systems in Australia is expanding at a CAGR of 6.0%, driven by mining sector applications and residential construction activity across major urban centers. The country's established mining industry requires robust piping solutions for water supply, slurry transport, and ventilation applications in remote locations. Urban development projects and infrastructure upgrades contribute to consistent market demand for residential and commercial piping installations.
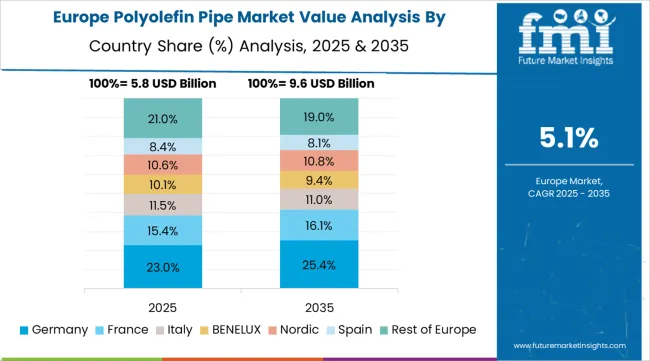
The polyolefin pipe market in Europe is likely to grow from USD 6.85 billion in 2025 to USD 10.52 billion by 2035, registering a CAGR of 4.4% over the forecast period. Germany is expected to maintain significant market presence with approximately 22% share in 2025, supported by its strong manufacturing base and advanced industrial infrastructure. The United Kingdom follows with strong growth potential, driven by extensive water infrastructure renewal programs. France holds substantial European market share, benefiting from agricultural development and municipal infrastructure investments. Italy and Spain collectively represent significant regional demand, with growing focus on irrigation and water management applications. The Rest of Europe region accounts for notable market share, supported by infrastructure development in Eastern European countries and Nordic construction sectors.
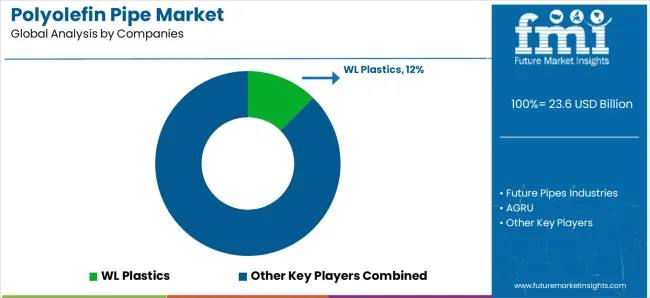
The polyolefin pipe market is defined by competition among established plastic pipe manufacturers, integrated petrochemical companies, and regional pipe producers. Companies are investing in advanced manufacturing technologies, product innovation, expanded production capacity, and technical support capabilities to deliver reliable, cost-effective, and high-performance piping solutions. Strategic partnerships, geographic expansion, and vertical integration are central to strengthening product portfolios and market presence.
WL Plastics, operating globally, offers comprehensive polyethylene pipe solutions with focus on quality manufacturing, technical support, and diverse product range serving multiple applications. Future Pipes Industries, multinational, provides advanced pipe systems with emphasis on innovation and engineered solutions for infrastructure projects. AGRU, internationally recognized, delivers specialized piping products with focus on chemical resistance and industrial applications. GF Piping Systems offers comprehensive plastic piping technologies with global manufacturing capabilities and extensive distribution networks.
Advanced Drainage System provides specialized pipe solutions for drainage and water management applications with focus on sustainable products. Chevron Phillips Chemical delivers polyethylene materials and integrated pipe solutions with emphasis on material quality and technical expertise. Borealis offers advanced polyolefin materials and pipe technologies with focus on innovation and sustainability. Pipelife provides comprehensive piping systems across multiple applications with European manufacturing presence.
Wavin, Aliaxis, JM Eagle, China Lesso Group, Sekisui Chemical, Mexichem, Georg Fischer, Tessenderlo Group, Radius Systems, NormaGroup, Supreme Industries, Ashirvad Pipes, and Prince Pipes offer specialized piping expertise, regional manufacturing capabilities, and technical support across global and regional markets.
The polyolefin pipe market underpins water security, telecommunications connectivity, agricultural productivity, and sustainable infrastructure development. With urbanization pressures, water scarcity challenges, and demand for resilient infrastructure, the sector must balance cost competitiveness, performance reliability, and environmental sustainability. Coordinated contributions from governments, industry bodies, manufacturers, suppliers, and investors will accelerate the transition toward durable, efficient, and environmentally responsible piping systems.
| Item | Details |
|---|---|
| Quantitative Units (2025) | USD 23.62 billion |
| Product Type | Polypropylene (PP) Pipes, Polyethylene (PE) Pipes, Plastomer |
| Application | Power and Communication, Wastewater Drainage, Irrigation, Others |
| End-User | Agriculture, Industrial, Others |
| Regions Covered | North America, Europe, East Asia, South Asia &Pacific, Latin America, Oceania, Middle East &Africa |
| Countries Covered | United States, Germany, United Kingdom, France, China, Japan, South Korea, India, Australia, Brazil, and 40+ additional countries |
| Key Companies Profiled | WL Plastics, Future Pipes Industries, AGRU, GF Piping Systems, Advanced Drainage System, Chevron Phillips Chemical, Borealis, Pipelife, Wavin, Aliaxis, JM Eagle, China Lesso Group, Sekisui Chemical, Mexichem, Georg Fischer, Tessenderlo Group, Radius Systems, NormaGroup, Supreme Industries, Ashirvad Pipes, Prince Pipes |
| Additional Attributes | Dollar sales by product type and application;regional demand trends across North America, Europe, and Asia-Pacific;competitive landscape with established manufacturers and emerging suppliers;buyer preferences for corrosion-resistant vs conventional systems;integration with smart monitoring technologies;innovations in material formulations and manufacturing processes for enhanced durability and performance;adoption of sustainable piping solutions with recycled content and reduced environmental impact supporting infrastructure resilience |
Product Type
The global polyolefin pipe market is estimated to be valued at USD 23.6 billion in 2025.
The market size for the polyolefin pipe market is projected to reach USD 41.9 billion by 2035.
The polyolefin pipe market is expected to grow at a 5.9% CAGR between 2025 and 2035.
The key product types in polyolefin pipe market are polypropylene (pp) pipes, polyethylene (pe) pipes and plastomer.
In terms of application, power and communication segment to command 40.0% share in the polyolefin pipe market in 2025.


Full Research Suite comprises of:
Market outlook & trends analysis
Interviews & case studies
Strategic recommendations
Vendor profiles & capabilities analysis
5-year forecasts
8 regions and 60+ country-level data splits
Market segment data splits
12 months of continuous data updates
DELIVERED AS:
PDF EXCEL ONLINE
Polyolefin Catalyst Market Size and Share Forecast Outlook 2025 to 2035
Polyolefin Powder Market
Polyolefin Films Market
Polyolefin Resin Paints Market
Pipeline Integrity Market Size and Share Forecast Outlook 2025 to 2035
Pipe Market Size and Share Forecast Outlook 2025 to 2035
Pipe Insulation Films Market Size and Share Forecast Outlook 2025 to 2035
Pipetting Robots Market Size and Share Forecast Outlook 2025 to 2035
Pipeline Monitoring System Market Size and Share Forecast Outlook 2025 to 2035
Pipeline Safety Market Size and Share Forecast Outlook 2025 to 2035
Pipe Insulation Market Size and Share Forecast Outlook 2025 to 2035
Pipe Wrenches Market Size and Share Forecast Outlook 2025 to 2035
Pipe Insulation Products Market Size and Share Forecast Outlook 2025 to 2035
Pipe Coatings Market Size and Share Forecast Outlook 2025 to 2035
Pipette Tips Market Size and Share Forecast Outlook 2025 to 2035
Pipe Screw Extruder Market Analysis - Size, Share, and Forecast Outlook 2025 to 2035
Pipette Controller Market – Trends & Forecast 2025 to 2035
Pipe Inspection Robot Market Growth – Trends & Forecast 2025 to 2035
Pipe Flange Market Analysis by Material Type, Facing, End-Use Industry, and Region through 2035
Market Leaders & Share in the Pipe Insulation Products Industry

Thank you!
You will receive an email from our Business Development Manager. Please be sure to check your SPAM/JUNK folder too.
Chat With
MaRIA