Global Fitness Recovery Services Market Size and Share Forecast Outlook 2025 to 2035

The Global Fitness Recovery Services Market is expected to record a valuation of USD 8,219.7 million in 2025 and USD 24,528.9 million in 2035, with an increase of USD 16,309.2 million, which equals a growth of ~198% over the decade. The overall expansion represents a CAGR of 11.6% and a 3X increase in market size.
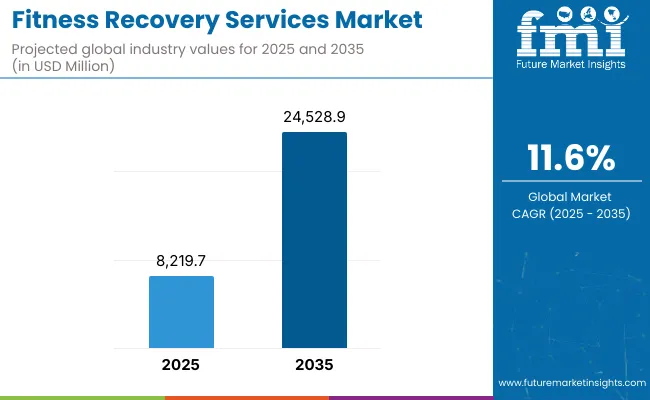
Quick Stats for Global Fitness Recovery Services Market

  • Global Fitness Recovery Services Market Value (2025): USD 8,219.7 million
  • Global Fitness Recovery Services Market Forecast Value (2035): USD 24,528.9 million
  • Global Fitness Recovery Services Market Forecast CAGR: 11.6%
  • Leading Segment in 2025: Massage therapy & assisted stretch (34.2% | USD 2,811.1 million)
  • Key Growth Regions in the Global Fitness Recovery Services Market: India (13.8% CAGR), China (12.5% CAGR), Japan (9.5% CAGR)
  • Top Key Players in Global Fitness Recovery Services Market: Restore Hyper Wellness, StretchLab, Therabody Reset, Hyperice Recovery, iCRYO, The Covery Wellness Spa, Upgrade Labs, Pause Studio, The Cryo Bar, ReCOVER

Fitness Recovery Services Market

Global Fitness Recovery Services Market Key Takeaways

Metric Value
Market Estimated Value in (2025E) USD 8,219.7 million
Market Forecast Value in (2035F) USD 24,528.9 million
Forecast CAGR (2025 to 2035) 11.6%

During the first five-year period from 2025 to 2030, the market increases from USD 8,219.7 million to USD 14,199.3 million, adding USD 5,979.6 million, which accounts for 37% of the total decade growth. This phase records steady adoption in wellness spas, fitness clubs, and sports clinics, driven by the need for general wellness recovery. Massage therapy & assisted stretch dominates this period as it caters to over one-third of global demand in 2025.

The second half from 2030 to 2035 contributes USD 10,329.6 million, equal to 63% of total growth, as the market jumps from USD 14,199.3 million to USD 24,528.9 million. This acceleration is powered by widespread adoption in India (13.8% CAGR), China (12.5% CAGR), and Japan (9.5% CAGR), alongside corporate wellness programs, in-home/on-demand recovery, and digital-first booking platforms. Membership and subscription models increase recurring revenue, expanding their share in total value.

From 2020 to 2024, the Global Fitness Recovery Services Market grew from smaller adoption levels to early mainstreaming, driven by wellness studios and recovery spas. During this period, the competitive landscape was dominated by service-based operators controlling nearly 70% of revenue, with leaders such as Restore Hyper Wellness and StretchLab focusing on premium memberships and assisted stretch modalities. Competitive differentiation relied on location density, practitioner expertise, and recovery program variety, while corporate wellness and mobile recovery services had minimal traction, contributing less than 15% of the total market value.

Demand for fitness recovery services will expand to USD 8,219.7 million in 2025, and the revenue mix will shift as app/web booking platforms (63.2% | USD 5,194.8 million) and subscription-based recovery programs rise. Traditional players face competition from digital-first recovery startups offering AI-enabled wellness tracking, cryotherapy pods, and bundled recovery memberships. Major service providers are pivoting to hybrid models, integrating in-home sessions and corporate tie-ups to retain relevance. Emerging entrants specializing in infrared therapy, percussive recovery, and compression therapy equipment are gaining share. The competitive advantage is moving away from location-only strategies toward ecosystem strength, digital integration, and recurring memberships.

Why the Global Fitness Recovery Services Market is growing?

Advances in recovery modalities such as cryotherapy, infrared therapy, and percussive therapy have improved efficiency and broadened adoption across consumer groups. Massage therapy & assisted stretch remains the most widely accepted, accounting for 34.2% share in 2025 (USD 2,811.1 million), due to its suitability for both general wellness and athlete recovery. The rise of digital booking platforms has further accelerated adoption, as app/web bookings account for 63.2% of market value in 2025 (USD 5,194.8 million). Expansion of corporate wellness programs, boutique studios, and on-demand recovery is fueling long-term growth. New offerings such as infrared saunas, compression therapy boots, and AI-based coaching apps are opening additional use cases. Segment growth is expected to be led by massage therapy & assisted stretch, app-based booking channels, and subscription pricing models, ensuring strong scalability and recurring revenue streams.

Segmental Analysis

The market is segmented by service type (modality), end user, booking channel, delivery setting, session type, and pricing model. Service types include massage therapy & assisted stretch, cryotherapy/cold plunge & contrast therapy, compression therapy, infrared sauna & red-light therapy, myofascial/percussive & mobility sessions, and other recovery methods (PEMF, float, breathwork). End users encompass general wellness consumers, recreational athletes, professional & elite athletes/teams, and corporate wellness participants.

Booking channels include app/web booking and walk-in/phone, reflecting evolving consumer preferences. Delivery settings span boutique recovery studios/wellness spas, fitness clubs & premium gyms, sports medicine/physiotherapy clinics, and in-home/on-demand mobile recovery. Session types cover self-serve equipment sessions and therapist-guided/practitioner-led formats. Pricing models include membership/subscription, packs (multi-session), and pay-per-session. Regionally, the scope spans North America, Europe, East Asia, South Asia & Pacific, Latin America, and the Middle East & Africa.
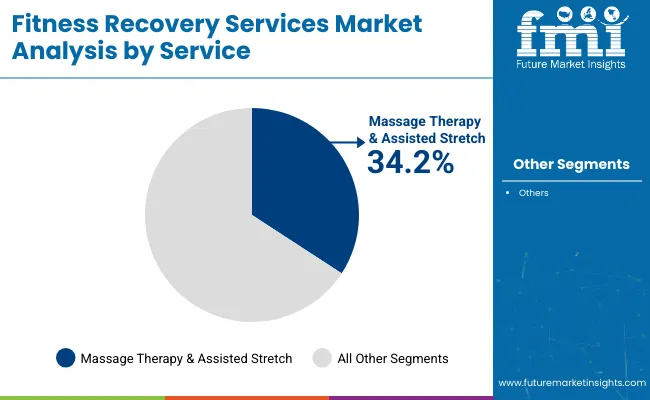
Insights into the Service Type Segment with Massage Therapy & Assisted Stretch Leading in Market Share

Fitness Recovery Services Market By Service

Service Type Segment Market Value Share, 2025
Massage Therapy & Assisted Stretch 34.2%
Others 65.8%

The massage therapy & assisted stretch segment is projected to contribute 34.2% of the Global Fitness Recovery Services Market revenue in 2025, valued at USD 2,811.1 million, making it the leading modality. Its dominance is driven by strong consumer demand across both wellness enthusiasts and athletes, who seek personalized recovery programs that combine relaxation with mobility improvement. The segment benefits from scalability within boutique studios, fitness clubs, and dedicated recovery franchises, enabling consistent revenue growth. This segment is expected to retain leadership as recovery services become more mainstream, with operators bundling massage and stretch sessions into subscription packages. Assisted stretching, in particular, has gained momentum due to its accessibility and proven benefits in injury prevention and flexibility improvement, ensuring its position as the backbone of recovery modalities.
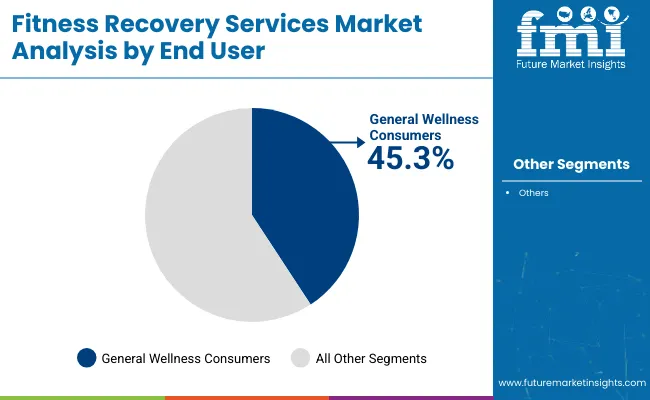
Insights into the End User Segment with General Wellness Consumers Driving Demand

Fitness Recovery Services Market By End User

End User Segment Market Value Share, 2025
General Wellness Consumers 45.3%
Others 65.8%

The general wellness consumer segment is forecasted to hold 45.3% of market share in 2025, valued at USD 3,723.5 million, making it the single largest user group. Rising health awareness, increased stress management needs, and the pursuit of holistic well-being are fueling participation from everyday consumers beyond professional athletes. This broad demographic ensures recurring demand through both memberships and on-demand sessions.The segment’s growth is reinforced by its accessibility via app-based booking platforms, as consumers are drawn to flexible and affordable service packs. With more people adopting fitness and recovery as part of preventive healthcare, this segment is expected to remain the largest driver of global market value throughout the forecast period.
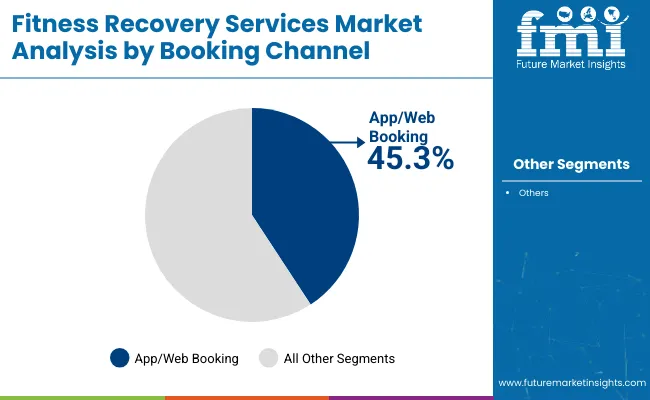
Insights into the Booking Channel Segment with App/Web Booking Dominating the Market

Fitness Recovery Services Market By Booking

Booking Channel Segment Market Value Share, 2025
App/Web Booking 45.3%
Others 65.8%

The app/web booking channel is projected to capture 63.2% of market share in 2025, valued at USD 5,194.8 million, making it the dominant booking method. This trend reflects the industry’s shift toward digital-first engagement, with recovery service providers adopting platforms that simplify scheduling, payments, and subscription management. The segment’s rise is fueled by consumer preference for convenience and operators’ push for operational efficiency through digital channels. Integration with loyalty programs, AI-driven personalization, and seamless subscription billing further enhances adoption. As on-demand wellness services continue to scale globally, app/web booking is expected to strengthen its dominance, displacing traditional walk-in and phone-based scheduling.

What are the Drivers, Restraints, and Key Trends of the Global Fitness Recovery ServicesMarket?

Drivers

Rising Health & Wellness Awareness Among Consumers

The single largest driver for the Global Fitness Recovery Services Market is the rising awareness of preventive health and holistic wellness among consumers. Over the last decade, fitness and wellness trends have evolved beyond traditional gym workouts and sports performance, shifting toward recovery, mobility, and stress management as integral aspects of an active lifestyle. This shift is evident in the fact that general wellness consumers already contribute 45.3% of the market in 2025, equivalent to USD 3,723.5 million, making them the dominant end-user group ahead of recreational or professional athletes. What makes this driver particularly strong is the broad demographic base fueling demand.

Unlike niche services that appeal only to elite athletes, recovery modalities such as massage therapy, assisted stretching, and mobility sessions are increasingly being adopted by everyday consumers seeking stress relief, better sleep, and injury prevention. Post-pandemic wellness behaviors have also intensified demand for recovery services, with consumers actively investing in personal health as part of preventive care. This driver is reinforced by the accessibility of recovery services across delivery settings from boutique wellness spas and fitness clubs to in-home mobile services.

Operators are capitalizing on this trend by offering flexible programs through subscription packs, memberships, and on-demand digital bookings, which reduce barriers to entry for new users. As recovery services continue to be positioned as “essential wellness” rather than “luxury treatments,” the mass-market appeal of these offerings ensures strong, sustained growth over the forecast period.

Digital Transformation Through App/Web Platforms

The adoption of digital-first booking and service delivery is another major driver of market growth. In 2025, app/web bookings already account for 63.2% of global market revenue, valued at USD 5,194.8 million, highlighting how technology has become the default interface for consumers. This shift is not merely about convenience it is structurally reshaping how recovery services are accessed, consumed, and monetized. Digital platforms simplify scheduling, payments, and subscription management, while also allowing for seamless integration with wellness apps, wearable data, and personalized programs.

For operators, app/web systems reduce operational inefficiencies, increase customer retention, and open the door to recurring revenue models that replace one-time transactional sales. Memberships and packs are increasingly managed through digital platforms, enabling operators to offer loyalty-based discounts and AI-driven recommendations. The digital transformation is also breaking geographical barriers, allowing recovery providers to scale quickly into new markets.

For example, boutique studios in the USA are leveraging digital platforms to expand into Asia-Pacific through franchising models supported by centralized booking systems. The growth of digital-first recovery startups some offering exclusively app-based mobility and breathwork sessions demonstrates how this driver extends beyond physical service delivery into hybrid and virtual wellness ecosystems. With the majority of consumers now expecting app-based convenience, this driver is likely to remain one of the most powerful enablers of market expansion through 2035.

Restraints

High Cost of Specialized Recovery Modalities

One of the biggest challenges restraining wider adoption is the cost associated with specialized recovery services. While massage therapy and assisted stretching remain relatively accessible, modalities such as cryotherapy chambers, infrared saunas, and PEMF treatments require heavy capital investments in equipment and infrastructure. This cost burden limits affordability for end consumers and creates barriers for small or independent operators, particularly in emerging economies. Even when available, advanced recovery services are often priced at a premium under pay-per-session or boutique membership models.

This creates a perception of recovery as a luxury rather than a necessity, restricting its penetration among middle-income consumers who represent the largest growth opportunity. Although subscription packs reduce the upfront cost, many advanced modalities remain out of reach for price-sensitive markets. The high cost also hampers geographic expansion, as recovery brands struggle to justify investments in countries where disposable incomes are lower. Without scalable low-cost models or financing options for operators, the diffusion of advanced recovery technologies may remain limited to North America, parts of Europe, and select Asian cities with affluent populations. This restraint risks slowing down the otherwise rapid adoption trajectory predicted for the sector.

Fragmented Market with Limited Standardization

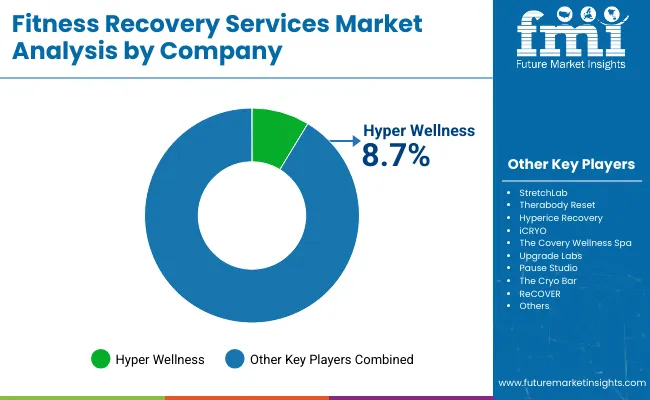
Another major restraint is the highly fragmented nature of the Global Fitness Recovery Services Market. Unlike the fitness club industry, which has consolidated under a few global brands, recovery services remain dominated by small boutique studios, wellness spas, and localized operators. Even leading players such as Restore Hyper Wellness, which holds an 8.7% global market share in 2025, account for only a small fraction of the overall market. This fragmentation results in a lack of standardization in pricing, practitioner training, and service quality. Consumers may experience significant variations in service outcomes depending on location and operator, which can undermine trust in recovery services as a consistent wellness solution.

Safety standards for modalities such as cryotherapy or infrared saunas also vary widely, increasing risks for both consumers and operators. The lack of standardization is particularly challenging for corporate wellness programs, which require reliable, uniform service delivery across multiple geographies. Without industry-wide certifications or global operating standards, many corporates hesitate to integrate recovery services at scale, restricting one of the most promising growth opportunities for the sector. This restraint will need to be addressed through regulation, franchise consolidation, or the emergence of strong global brands that can enforce service quality consistency.

Key Trends

Shift Toward Hybrid and Subscription-Based Models

A defining trend in the market is the rapid transition toward subscription and hybrid pricing models. In contrast to pay-per-session recovery services, subscription models provide predictable recurring revenue for operators and more affordable access for consumers. Bundled packs that combine multiple modalities such as massage, compression therapy, and cryotherapy are increasingly marketed as holistic recovery programs, encouraging repeat visits and long-term customer engagement. Hybrid models that combine physical recovery services with digital coaching or app-based mobility sessions are also gaining traction. Consumers value the flexibility of being able to access certain recovery tools at home while visiting studios for higher-end modalities.

This trend is particularly strong in urban markets where digital convenience complements premium in-person experiences. The expansion of subscription models not only boosts customer retention but also aligns recovery services with broader consumer trends in wellness and fitness, where subscriptions for gyms, yoga apps, and meditation platforms have already become mainstream. As recovery integrates further into preventive healthcare, the hybrid subscription trend is expected to define the future business model of the industry.

Asia-Pacific Emergence as a Growth Hub

A second defining trend is the rise of Asia-Pacific as the fastest-growing hub for recovery services. Countries like India (13.8% CAGR) and China (12.5% CAGR) are outpacing traditional markets such as the USA (5.3% CAGR) and Germany (6.8% CAGR). With growing disposable incomes, urbanization, and lifestyle shifts toward fitness and wellness, demand for recovery modalities is accelerating across the region. Operators are increasingly prioritizing Asia-Pacific for expansion, leveraging franchising models supported by digital booking platforms to reduce setup costs. Mobile and on-demand recovery services are also proving popular in Asia, where consumers value affordability and convenience.

Unlike Western markets where recovery is often positioned as a premium offering, in Asia-Pacific it is being localized into mainstream wellness routines, ensuring broader adoption. This trend signals a geographic rebalancing of the industry. While the USA will remain the largest single market by absolute value, its global share is projected to decline from 27.8% in 2025 to 23.4% in 2035, as Asia-Pacific strengthens its contribution. By the end of the decade, Asia-Pacific is expected to emerge not only as a demand hub but also as a key center for innovation, with localized adaptations of recovery services designed for price-sensitive yet health-conscious consumers.
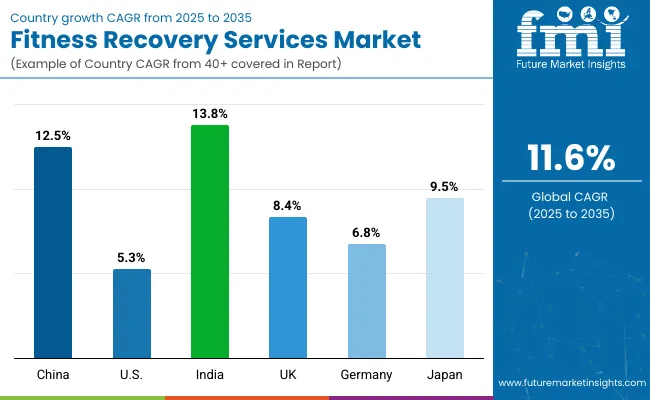
Analysis of Global Fitness Recovery Services Market By Key Countries

Fitness Recovery Services Market Country

Countries Estimated CAGR (2025 to 2035)
China 12.5%
USA 5.3%
India 13.8%
UK 8.4%
Germany 6.8%
Japan 9.5%

The global Fitness Recovery Services Market shows a pronounced regional disparity in adoption speed, strongly influenced by wellness penetration, digital booking usage, and the maturity of premium studio ecosystems. Asia-Pacific emerges as the fastest-growing region, anchored by China at 12.5% CAGR and India at 13.8%. This acceleration is driven by rapid urban wellness adoption, franchised recovery studio rollouts, and app-led memberships that lower access friction.

China’s growth is further supported by large fitness club networks adding cryotherapy, infrared, and compression zones, while India’s trajectory reflects rising participation from general wellness consumers and corporate wellness tie-ups. Europe maintains a strong growth profile, led by Germany (6.8%) and the UK (8.4%), supported by premium boutique studios, physiotherapy integration, and employer-backed wellness benefits. High digital booking penetration and packaged memberships keep Europe ahead of North America in subscription mix and hybrid (in-studio + at-home) models. North America shows moderate expansion, with the USA at 5.3% CAGR, reflecting a more mature landscape and increasing emphasis on recurring memberships, therapist-assisted stretch formats, and app/web bookings (already dominant globally at 63.2% in 2025). Growth in North America is increasingly service- and subscription-driven, with stronger adoption of bundled modalities and therapist-guided programs rather than pure pay-per-session models.

Sales Outlook for Fitness Recovery Services in the United States

Year USA Fitness Recovery Services Market
2025 2285.06
2026 2505.52
2027 2747.24
2028 3012.29
2029 3302.91
2030 3621.56
2031 3970.96
2032 4354.07
2033 4774.14
2034 5234.73
2035 5739.76

The Fitness Recovery Services Market in the United States is projected to grow at a 5.3% CAGR. Growth is led by expanded assisted stretch and massage programs (the leading global modality at 34.2% share in 2025), deepening subscription/membership adoption, and the dominance of app/web booking channels aligned with consumer preference for flexible scheduling and packs. Assisted stretch & massage remain core draws for recurring memberships and upsell bundles. Corporate wellness partnerships expand access, especially for general wellness employees seeking preventive recovery. Digital-first experiences (app/web booking, loyalty, and personalization) increase retention and raise spend per member.

Growth and Expansion Outlook for Fitness Recovery Services in the United Kingdom

The Fitness Recovery Services Market in the United Kingdom is expected to grow at a CAGR of 8.4%, supported by premium recovery studios, physiotherapy-linked clinics, and fitness club add-ons. Operators are widening packs-based and subscription pricing, pairing compression, infrared, and cryo with therapist-led stretch to lift ARPU and visit frequency. Digital bookings continue to streamline discovery and scheduling, with bundled memberships gaining traction in metropolitan areas. Fitness clubs and boutique studios integrate recovery zones to boost member lifetime value. Physio and sports clinics cross-sell recovery protocols for injury prevention and return-to-activity plans. Subscription and packs drive predictable revenue while enabling multi-modality experimentation by consumers.

Growth and Expansion Outlook for Fitness Recovery Services in India

India is witnessing rapid growth in the Fitness Recovery Services Market, forecast to expand at a CAGR of 13.8% through 2035. Penetration is rising beyond Tier-1 cities as app/web booking normalizes access and price-tiered packs improve affordability. General wellness consumers are the largest base, while recreational athletes add volume through event-season peaks. Franchised studios and physiotherapy clinics increasingly offer infrared, compression, and mobility alongside massage and assisted stretch. Tier-2 city expansion accelerates via franchising and lower-CAPEX fit-outs focused on high-turnover modalities. General wellness adoption fuels recurring memberships; seasonal athletes supplement demand. Corporate wellness pilots broaden access and awareness among urban professionals.

Sales Outlook for Fitness Recovery Services in China

Countries 2025 Share (%)
USA 27.8%
China 8.6%
Japan 6.5%
Germany 11.4%
UK 7.8%
India 3.9%
Countries 2035 Share (%)
USA 23.4%
China 9.5%
Japan 6.6%
Germany 10.0%
UK 7.1%
India 5.5%

The Fitness Recovery Services Market in China is expected to grow at a CAGR of 12.5%, the highest among leading economies listed. Momentum is driven by fitness club recovery add-ons, boutique recovery chains, and strong consumer uptake of app/web booking. General wellness consumers form the demand backbone, with rapid growth in compression, infrared, and mobility/percussive sessions complementing massage and assisted stretch. Large club ecosystems add cryo/infrared/compression corners to standard memberships. Boutique franchises scale across Tier-1/2 cities using digital subscriptions and packs. App-centric engagement boosts utilization, personalization, and cross-modality bundling.

The Global Fitness Recovery Services Market demonstrates clear regional contrasts, with developed markets like the USA and Germany showing maturity, while emerging economies such as India and China are rapidly expanding. In 2025, the USA leads with 27.8% share (USD 2,285.1 million) but is set to decline to 23.4% by 2035 as growth stabilizes at a moderate CAGR of 5.3%. Similarly, Germany and the U.K. retain strong positions in Europe, though their shares will fall slightly to 10.0% and 7.1%, respectively, as other regions outpace them. These declines reflect the saturation of premium recovery ecosystems and steady but slower adoption of advanced modalities compared to Asia-Pacific.

On the other hand, Asia-Pacific markets are emerging as global growth hubs. India’s share is projected to rise from 3.9% in 2025 to 5.5% in 2035, supported by the fastest CAGR of 13.8%, driven by digital-first booking adoption and urban middle-class wellness demand. China is also expanding from 8.6% to 9.5% share, with recovery integration into fitness clubs and strong general wellness participation fueling growth at 12.5% CAGR. Japan’s steady rise to 6.6% share reflects demand from aging demographics and preventive healthcare trends. Overall, the market is shifting toward Asia-Pacific dominance, with India and China capturing global share from the USA and Europe over the decade.

Opportunity Analysis of United States Fitness Recovery Services Market

Service Type Segment Market Value Share, 2025
Mas sage therapy & assisted stretch 33.5%
Others 66.5%

The Fitness Recovery Services Market in the United States is valued at USD 2,285.06 million in 2025, with massage therapy & assisted stretch leading at 33.5% of service mix. The USA accounts for ~27.8% of global market value in 2025, reflecting a mature ecosystem of assisted-stretch franchises, wellness studios, and recovery add-ons in premium gyms. Leadership of massage/assisted stretch stems from wide consumer acceptance, clear outcomes in flexibility and pain relief, and scalable staffing/training models for multi-location operators. Subscription and packs are deepening recurring revenue, while app/web booking is the dominant access channel, streamlining scheduling, payments, and loyalty.

  • Market size for USA in 2025: USD 2,285.06 million
  • Global market share (2025): ~27.8%
  • Leading modality: Massage therapy & assisted stretch (33.5%) driven by memberships and therapist-led programs

Opportunity Analysis of China Fitness Recovery Services Market

End User Segment Market Value Share, 2025
General wellness consumers 43.6%
Others 56.4%

The Fitness Recovery Services Market in China is valued at ~USD 706.89 million in 2025 (based on 8.6% global share), with general wellness consumers leading at 43.6%. Growth is propelled by rapid urban adoption, fitness club chains adding recovery corners (cryotherapy, infrared, compression), and app-centric memberships that lower access friction. General wellness demand reflects stress management, preventive health, and lifestyle-led recovery routines, with multi-modality packs encouraging experimentation and upsell.
  • Market size for China in 2025: ~USD 706.89 million
  • Global market share (2025): 8.6%
  • Leading end user: General wellness consumers (43.6%) via digital subscriptions and bundled packs

Competitive Landscape of Global Fitness Recovery Services Market

Fitness Recovery Services Market Company

The Global Fitness Recovery Services Market is moderately fragmented, with leading franchise operators, mid-sized innovators, and boutique specialists competing across diverse service modalities. Global leaders such as Restore Hyper Wellness hold a notable share, driven by large franchise networks, multi-modality offerings (massage/stretch, cryotherapy, compression, infrared), and strong integration with digital booking platforms. Their strategies increasingly emphasize subscription memberships, app-based scheduling, and corporate wellness partnerships to deepen recurring revenue streams and scale across geographies. Established mid-sized players, including StretchLab, Therabody Reset, and Hyperice Recovery, cater to the demand for targeted recovery experiences through assisted stretching, percussive therapy, and mobility sessions.

These companies accelerate adoption by combining therapist-led programs with self-serve equipment solutions, making them relevant to both wellness consumers and recreational athletes. Their hybrid approach allows for scalable expansion in fitness clubs and premium wellness studios. Specialized providers such as iCRYO, The Covery Wellness Spa, Upgrade Labs, Pause Studio, The Cryo Bar, and ReCOVER focus on niche experiences like cryotherapy, infrared therapy, and float/breathwork modalities. Their strength lies in tailoring experiences for local markets, leveraging strong brand identities, and offering customizable packs and memberships rather than global scale. Competitive differentiation is shifting away from location-based presence alone toward ecosystem strength that blends multi-modality recovery menus, digital-first engagement, and subscription-based service models. Players that successfully integrate therapist expertise with app/web booking platforms, loyalty programs, and flexible memberships are expected to gain market share through 2035.

Key Developments in Global Fitness Recovery Services Market

  • On January 23, 2025, Restore Hyper Wellness appointed Matt Vonderahe as its new Chief Executive Officer, effective February 10. Vonderahe brings substantial experience in franchising and multi-unit expansion, previously leading Alamo Drafthouse through its pandemic-era growth and acquisition by Sony signaling Restore’s intent to scale aggressively across markets.
  • On June 21, 2024, Nike and Hyperice unveiled the Nike × Hyperice wearable recovery suite, including high-tech boots that deliver on-demand heat and dynamic air-compression massage to the feet and ankles, and a body vest capable of precise heating and cooling all in a wearable “pre-covery” format for athletes.

Scope of the Report

Item Value
Quantitative Units USD 8,219.7 Million
Service Type (Modality) Massage therapy & assisted stretch, Cryotherapy / cold plunge & contrast therapy, Compression therapy (boots/sleeves), Infrared sauna & red-light therapy, Myofascial/percussive & mobility sessions, Other recovery (PEMF, float, breathwork)
Delivery Setting Boutique recovery studios / wellness spas, Fitness clubs & premium gyms, Sports medicine / physiotherapy clinics, In-home / on-demand mobile
Technology General wellness consumers, Recreational athletes, Professional & elite athletes / teams, Corporate wellness participants
End User Laser scanners, Handheld, Stationary, Mobile, Structured light scanners, Optical scanners, Contact scanners, and Non-contact scanners
Session Type Self-serve equipment session, Therapist-guided / practitioner-led
Pricing Model Membership / subscription, Packs (multi-session), Pay-per-session (à la carte)
Booking Channel App / web booking, Walk-in / phone
Regions Covered North America, Europe, Asia-Pacific, Latin America, Middle East & Africa
Country Covered United States, Canada, Germany, France, United Kingdom, China, Japan, India, Brazil, South Africa
Key Companies Profiled Restore Hyper Wellness, StretchLab, Therabody Reset, Hyperice Recovery, iCRYO, The Covery Wellness Spa, Upgrade Labs, Pause Studio, The Cryo Bar, ReCOVER
Additional Attributes Dollar sales by service type, end user, and booking channel; subscription vs pay-per-session adoption trends; growth of app/web booking channels; demand shifts between wellness consumers and athletes; corporate wellness program integration; regional shifts led by Asia-Pacific growth (India and China); innovations in cryotherapy, infrared, and compression modalities.

Key Segments

By Service Type:

  • Massage therapy & assisted stretch
  • Cryotherapy / cold plunge & contrast therapy
  • Compression therapy (boots/sleeves)
  • Infrared sauna & red-light therapy
  • Myofascial/percussive & mobility sessions
  • Other recovery (PEMF, float, breathwork)

By Delivery Setting:

  • Boutique recovery studios / wellness spas
  • Fitness clubs & premium gyms
  • Sports medicine / physiotherapy clinics
  • In-home / on-demand mobile

By End User:

  • General wellness consumers
  • Recreational athletes
  • Professional & elite athletes / teams
  • Corporate wellness participants

By Session Type:

  • Self-serve equipment session
  • Therapist-guided / practitioner-led
  • Corporate wellness participants

By Pricing Model:

  • Membership / subscription
  • Packs (multi-session)
  • Pay-per-session (à la carte)

By Booking Channel:

  • App / web booking
  • Walk-in / phone

By Region:

  • North America
  • Latin America
  • Europe
  • East Asia
  • South Asia & Pacific
  • Middle East and Africa

Table of Content

  1. Executive Summary
    • Global Market Outlook
    • Demand-side Trends
    • Supply-side Trends
    • Technology Roadmap Analysis
    • Analysis and Recommendations
  2. Market Overview
    • Market Coverage / Taxonomy
    • Market Definition / Scope / Limitations
  3. Market Background
    • Market Dynamics
      • Drivers
      • Restraints
      • Opportunity
      • Trends
    • Scenario Forecast
      • Demand in Optimistic Scenario
      • Demand in Likely Scenario
      • Demand in Conservative Scenario
    • Opportunity Map Analysis
    • Product Life Cycle Analysis
    • Supply Chain Analysis
      • Supply Side Participants and their Roles
        • Producers
        • Mid-Level Participants (Traders/ Agents/ Brokers)
        • Wholesalers and Distributors
      • Value Added and Value Created at Node in the Supply Chain
      • List of Raw Material Suppliers
      • List of Existing and Potential Buyer’s
    • Investment Feasibility Matrix
    • Value Chain Analysis
      • Profit Margin Analysis
      • Wholesalers and Distributors
      • Retailers
    • PESTLE and Porter’s Analysis
    • Regulatory Landscape
      • By Key Regions
      • By Key Countries
    • Regional Parent Market Outlook
    • Production and Consumption Statistics
    • Import and Export Statistics
  4. Global Market Analysis 2020 to 2024 and Forecast, 2025 to 2035
    • Historical Market Size Value (USD Million) & Volume (Units) Analysis, 2020 to 2024
    • Current and Future Market Size Value (USD Million) & Volume (Units) Projections, 2025 to 2035
      • Y-o-Y Growth Trend Analysis
      • Absolute $ Opportunity Analysis
  5. Global Market Analysis 2020 to 2024 and Forecast 2025 to 2035, By Service Type
    • Introduction / Key Findings
    • Historical Market Size Value (USD Million) & Volume (Units) Analysis By Service Type, 2020 to 2024
    • Current and Future Market Size Value (USD Million) & Volume (Units) Analysis and Forecast By Service Type, 2025 to 2035
      • Massage therapy & assisted stretch
      • Cryotherapy / cold plunge & contrast therapy
      • Compression therapy (boots/sleeves)
      • Infrared sauna & red-light therapy
      • Myofascial/percussive & mobility sessions
      • Other recovery (PEMF, float, breathwork)
    • Y-o-Y Growth Trend Analysis By Service Type, 2020 to 2024
    • Absolute $ Opportunity Analysis By Service Type, 2025 to 2035
  6. Global Market Analysis 2020 to 2024 and Forecast 2025 to 2035, By Delivery Setting
    • Introduction / Key Findings
    • Historical Market Size Value (USD Million) & Volume (Units) Analysis By Delivery Setting, 2020 to 2024
    • Current and Future Market Size Value (USD Million) & Volume (Units) Analysis and Forecast By Delivery Setting, 2025 to 2035
      • Boutique recovery studios / wellness spas
      • Fitness clubs & premium gyms
      • Sports medicine / physiotherapy clinics
      • In-home / on-demand mobile
    • Y-o-Y Growth Trend Analysis By Delivery Setting, 2020 to 2024
    • Absolute $ Opportunity Analysis By Delivery Setting, 2025 to 2035
  7. Global Market Analysis 2020 to 2024 and Forecast 2025 to 2035, By End User
    • Introduction / Key Findings
    • Historical Market Size Value (USD Million) & Volume (Units) Analysis By End User, 2020 to 2024
    • Current and Future Market Size Value (USD Million) & Volume (Units) Analysis and Forecast By End User, 2025 to 2035
      • General wellness consumers
      • Recreational athletes
      • Professional & elite athletes / teams
      • Corporate wellness participants
    • Y-o-Y Growth Trend Analysis By End User, 2020 to 2024
    • Absolute $ Opportunity Analysis By End User, 2025 to 2035
  8. Global Market Analysis 2020 to 2024 and Forecast 2025 to 2035, By Session Type
    • Introduction / Key Findings
    • Historical Market Size Value (USD Million) & Volume (Units) Analysis By Session Type, 2020 to 2024
    • Current and Future Market Size Value (USD Million) & Volume (Units) Analysis and Forecast By Session Type, 2025 to 2035
      • Self-serve equipment session
      • Therapist-guided / practitioner-led
      • Corporate wellness participants
    • Y-o-Y Growth Trend Analysis By Session Type, 2020 to 2024
    • Absolute $ Opportunity Analysis By Session Type, 2025 to 2035
  9. Global Market Analysis 2020 to 2024 and Forecast 2025 to 2035, By Pricing Model
    • Introduction / Key Findings
    • Historical Market Size Value (USD Million) & Volume (Units) Analysis By Pricing Model, 2020 to 2024
    • Current and Future Market Size Value (USD Million) & Volume (Units) Analysis and Forecast By Pricing Model, 2025 to 2035
      • Membership / subscription
      • Packs (multi-session)
      • Pay-per-session (à la carte)
    • Y-o-Y Growth Trend Analysis By Pricing Model, 2020 to 2024
    • Absolute $ Opportunity Analysis By Pricing Model, 2025 to 2035
  10. Global Market Analysis 2020 to 2024 and Forecast 2025 to 2035, By Booking Channel
    • Introduction / Key Findings
    • Historical Market Size Value (USD Million) & Volume (Units) Analysis By Booking Channel, 2020 to 2024
    • Current and Future Market Size Value (USD Million) & Volume (Units) Analysis and Forecast By Booking Channel, 2025 to 2035
      • App / web booking
      • Walk-in / phone
    • Y-o-Y Growth Trend Analysis By Booking Channel, 2020 to 2024
    • Absolute $ Opportunity Analysis By Booking Channel, 2025 to 2035
  11. Global Market Analysis 2020 to 2024 and Forecast 2025 to 2035, By Region
    • Introduction
    • Historical Market Size Value (USD Million) & Volume (Units) Analysis By Region, 2020 to 2024
    • Current Market Size Value (USD Million) & Volume (Units) Analysis and Forecast By Region, 2025 to 2035
      • North America
      • Latin America
      • Europe
      • East Asia
      • South Asia & Pacific
      • Middle East and Africa
    • Market Attractiveness Analysis By Region
  12. North America Market Analysis 2020 to 2024 and Forecast 2025 to 2035, By Country
    • Historical Market Size Value (USD Million) & Volume (Units) Trend Analysis By Market Taxonomy, 2020 to 2024
    • Market Size Value (USD Million) & Volume (Units) Forecast By Market Taxonomy, 2025 to 2035
      • By Country
        • U.S.
        • Canada
      • By Service Type
      • By Delivery Setting
      • By End User
      • By Session Type
      • By Pricing Model
      • By Booking Channel
    • Market Attractiveness Analysis
      • By Country
      • By Service Type
      • By Delivery Setting
      • By End User
      • By Session Type
      • By Pricing Model
      • By Booking Channel
    • Key Takeaways
  13. Latin America Market Analysis 2020 to 2024 and Forecast 2025 to 2035, By Country
    • Historical Market Size Value (USD Million) & Volume (Units) Trend Analysis By Market Taxonomy, 2020 to 2024
    • Market Size Value (USD Million) & Volume (Units) Forecast By Market Taxonomy, 2025 to 2035
      • By Country
        • Brazil
        • Mexico
        • Colombia
        • Rest of Latin America
      • By Service Type
      • By Delivery Setting
      • By End User
      • By Session Type
      • By Pricing Model
      • By Booking Channel
    • Market Attractiveness Analysis
      • By Country
      • By Service Type
      • By Delivery Setting
      • By End User
      • By Session Type
      • By Pricing Model
      • By Booking Channel
    • Key Takeaways
  14. Europe Market Analysis 2020 to 2024 and Forecast 2025 to 2035, By Country
    • Historical Market Size Value (USD Million) & Volume (Units) Trend Analysis By Market Taxonomy, 2020 to 2024
    • Market Size Value (USD Million) & Volume (Units) Forecast By Market Taxonomy, 2025 to 2035
      • By Country
        • Germany
        • U.K.
        • France
        • Italy
        • Spain
        • Belgium
        • Netherlands
        • Nordic
        • Switzerland
        • Russia
        • Poland
        • Rest of Europe
      • By Service Type
      • By Delivery Setting
      • By End User
      • By Session Type
      • By Pricing Model
      • By Booking Channel
    • Market Attractiveness Analysis
      • By Country
      • By Service Type
      • By Delivery Setting
      • By End User
      • By Session Type
      • By Pricing Model
      • By Booking Channel
    • Key Takeaways
  15. East Asia Market Analysis 2020 to 2024 and Forecast 2025 to 2035, By Country
    • Historical Market Size Value (USD Million) & Volume (Units) Trend Analysis By Market Taxonomy, 2020 to 2024
    • Market Size Value (USD Million) & Volume (Units) Forecast By Market Taxonomy, 2025 to 2035
      • By Country
        • China
        • Japan
        • South Korea
      • By Service Type
      • By Delivery Setting
      • By End User
      • By Session Type
      • By Pricing Model
      • By Booking Channel
    • Market Attractiveness Analysis
      • By Country
      • By Service Type
      • By Delivery Setting
      • By End User
      • By Session Type
      • By Pricing Model
      • By Booking Channel
    • Key Takeaways
  16. South Asia & Pacific Market Analysis 2020 to 2024 and Forecast 2025 to 2035, By Country
    • Historical Market Size Value (USD Million) & Volume (Units) Trend Analysis By Market Taxonomy, 2020 to 2024
    • Market Size Value (USD Million) & Volume (Units) Forecast By Market Taxonomy, 2025 to 2035
      • By Country
        • India
        • Thailand
        • Malaysia
        • Indonesia
        • Singapore
        • Vietnam
        • Australia
        • New Zealand
        • Rest of South Asia
      • By Service Type
      • By Delivery Setting
      • By End User
      • By Session Type
      • By Pricing Model
      • By Booking Channel
    • Market Attractiveness Analysis
      • By Country
      • By Service Type
      • By Delivery Setting
      • By End User
      • By Session Type
      • By Pricing Model
      • By Booking Channel
    • Key Takeaways
  17. Middle East and Africa Market Analysis 2020 to 2024 and Forecast 2025 to 2035, By Country
    • Historical Market Size Value (USD Million) & Volume (Units) Trend Analysis By Market Taxonomy, 2020 to 2024
    • Market Size Value (USD Million) & Volume (Units) Forecast By Market Taxonomy, 2025 to 2035
      • By Country
        • Turkey
        • UAE
        • Saudi Arabia
        • Israel
        • Other GCC Countries
        • North Africa
        • South Africa
      • By Service Type
      • By Delivery Setting
      • By End User
      • By Session Type
      • By Pricing Model
      • By Booking Channel
    • Market Attractiveness Analysis
      • By Country
      • By Service Type
      • By Delivery Setting
      • By End User
      • By Session Type
      • By Pricing Model
      • By Booking Channel
    • Key Takeaways
  18. Key Countries Market Analysis
    • U.S.
      • Pricing Analysis
      • Market Share Analysis, 2024
        • By Service Type
        • By Delivery Setting
        • By End User
        • By Session Type
        • By Pricing Model
        • By Booking Channel
    • Canada
      • Pricing Analysis
      • Market Share Analysis, 2024
        • By Service Type
        • By Delivery Setting
        • By End User
        • By Session Type
        • By Pricing Model
        • By Booking Channel
    • Brazil
      • Pricing Analysis
      • Market Share Analysis, 2024
        • By Service Type
        • By Delivery Setting
        • By End User
        • By Session Type
        • By Pricing Model
        • By Booking Channel
    • Mexico
      • Pricing Analysis
      • Market Share Analysis, 2024
        • By Service Type
        • By Delivery Setting
        • By End User
        • By Session Type
        • By Pricing Model
        • By Booking Channel
    • Colombia
      • Pricing Analysis
      • Market Share Analysis, 2024
        • By Service Type
        • By Delivery Setting
        • By End User
        • By Session Type
        • By Pricing Model
        • By Booking Channel
    • Germany
      • Pricing Analysis
      • Market Share Analysis, 2024
        • By Service Type
        • By Delivery Setting
        • By End User
        • By Session Type
        • By Pricing Model
        • By Booking Channel
    • U.K.
      • Pricing Analysis
      • Market Share Analysis, 2024
        • By Service Type
        • By Delivery Setting
        • By End User
        • By Session Type
        • By Pricing Model
        • By Booking Channel
    • France
      • Pricing Analysis
      • Market Share Analysis, 2024
        • By Service Type
        • By Delivery Setting
        • By End User
        • By Session Type
        • By Pricing Model
        • By Booking Channel
    • Italy
      • Pricing Analysis
      • Market Share Analysis, 2024
        • By Service Type
        • By Delivery Setting
        • By End User
        • By Session Type
        • By Pricing Model
        • By Booking Channel
    • Spain
      • Pricing Analysis
      • Market Share Analysis, 2024
        • By Service Type
        • By Delivery Setting
        • By End User
        • By Session Type
        • By Pricing Model
        • By Booking Channel
    • Belgium
      • Pricing Analysis
      • Market Share Analysis, 2024
        • By Service Type
        • By Delivery Setting
        • By End User
        • By Session Type
        • By Pricing Model
        • By Booking Channel
    • Netherlands
      • Pricing Analysis
      • Market Share Analysis, 2024
        • By Service Type
        • By Delivery Setting
        • By End User
        • By Session Type
        • By Pricing Model
        • By Booking Channel
    • Nordic
      • Pricing Analysis
      • Market Share Analysis, 2024
        • By Service Type
        • By Delivery Setting
        • By End User
        • By Session Type
        • By Pricing Model
        • By Booking Channel
    • Switzerland
      • Pricing Analysis
      • Market Share Analysis, 2024
        • By Service Type
        • By Delivery Setting
        • By End User
        • By Session Type
        • By Pricing Model
        • By Booking Channel
    • Russia
      • Pricing Analysis
      • Market Share Analysis, 2024
        • By Service Type
        • By Delivery Setting
        • By End User
        • By Session Type
        • By Pricing Model
        • By Booking Channel
    • Poland
      • Pricing Analysis
      • Market Share Analysis, 2024
        • By Service Type
        • By Delivery Setting
        • By End User
        • By Session Type
        • By Pricing Model
        • By Booking Channel
    • China
      • Pricing Analysis
      • Market Share Analysis, 2024
        • By Service Type
        • By Delivery Setting
        • By End User
        • By Session Type
        • By Pricing Model
        • By Booking Channel
    • Japan
      • Pricing Analysis
      • Market Share Analysis, 2024
        • By Service Type
        • By Delivery Setting
        • By End User
        • By Session Type
        • By Pricing Model
        • By Booking Channel
    • South Korea
      • Pricing Analysis
      • Market Share Analysis, 2024
        • By Service Type
        • By Delivery Setting
        • By End User
        • By Session Type
        • By Pricing Model
        • By Booking Channel
    • India
      • Pricing Analysis
      • Market Share Analysis, 2024
        • By Service Type
        • By Delivery Setting
        • By End User
        • By Session Type
        • By Pricing Model
        • By Booking Channel
    • Thailand
      • Pricing Analysis
      • Market Share Analysis, 2024
        • By Service Type
        • By Delivery Setting
        • By End User
        • By Session Type
        • By Pricing Model
        • By Booking Channel
    • Indonesia
      • Pricing Analysis
      • Market Share Analysis, 2024
        • By Service Type
        • By Delivery Setting
        • By End User
        • By Session Type
        • By Pricing Model
        • By Booking Channel
    • Australia
      • Pricing Analysis
      • Market Share Analysis, 2024
        • By Service Type
        • By Delivery Setting
        • By End User
        • By Session Type
        • By Pricing Model
        • By Booking Channel
    • New Zealand
      • Pricing Analysis
      • Market Share Analysis, 2024
        • By Service Type
        • By Delivery Setting
        • By End User
        • By Session Type
        • By Pricing Model
        • By Booking Channel
    • Turkey
      • Pricing Analysis
      • Market Share Analysis, 2024
        • By Service Type
        • By Delivery Setting
        • By End User
        • By Session Type
        • By Pricing Model
        • By Booking Channel
    • UAE
      • Pricing Analysis
      • Market Share Analysis, 2024
        • By Service Type
        • By Delivery Setting
        • By End User
        • By Session Type
        • By Pricing Model
        • By Booking Channel
    • Saudi Arabia
      • Pricing Analysis
      • Market Share Analysis, 2024
        • By Service Type
        • By Delivery Setting
        • By End User
        • By Session Type
        • By Pricing Model
        • By Booking Channel
    • Israel
      • Pricing Analysis
      • Market Share Analysis, 2024
        • By Service Type
        • By Delivery Setting
        • By End User
        • By Session Type
        • By Pricing Model
        • By Booking Channel
    • North Africa
      • Pricing Analysis
      • Market Share Analysis, 2024
        • By Service Type
        • By Delivery Setting
        • By End User
        • By Session Type
        • By Pricing Model
        • By Booking Channel
    • South Africa
      • Pricing Analysis
      • Market Share Analysis, 2024
        • By Service Type
        • By Delivery Setting
        • By End User
        • By Session Type
        • By Pricing Model
        • By Booking Channel
  19. Market Structure Analysis
    • Competition Dashboard
    • Competition Benchmarking
    • Market Share Analysis of Top Players
      • By Regional
      • By Service Type
      • By Delivery Setting
      • By End User
      • By Session Type
      • By Pricing Model
      • By Booking Channel
  20. Competition Analysis
    • Competition Deep Dive
      • Restore Hyper Wellness
        • Overview
        • Product Portfolio
        • Profitability by Market Segments (Product/Age /Sales Channel/Region)
        • Sales Footprint
        • Strategy Overview
          • Marketing Strategy
          • Product Strategy
          • Channel Strategy
      • StretchLab
        • Overview
        • Product Portfolio
        • Profitability by Market Segments (Product/Age /Sales Channel/Region)
        • Sales Footprint
        • Strategy Overview
          • Marketing Strategy
          • Product Strategy
          • Channel Strategy
      • Therabody Reset
        • Overview
        • Product Portfolio
        • Profitability by Market Segments (Product/Age /Sales Channel/Region)
        • Sales Footprint
        • Strategy Overview
          • Marketing Strategy
          • Product Strategy
          • Channel Strategy
      • Hyperice Recovery
        • Overview
        • Product Portfolio
        • Profitability by Market Segments (Product/Age /Sales Channel/Region)
        • Sales Footprint
        • Strategy Overview
          • Marketing Strategy
          • Product Strategy
          • Channel Strategy
      • iCRYO
        • Overview
        • Product Portfolio
        • Profitability by Market Segments (Product/Age /Sales Channel/Region)
        • Sales Footprint
        • Strategy Overview
          • Marketing Strategy
          • Product Strategy
          • Channel Strategy
      • The Covery Wellness Spa
        • Overview
        • Product Portfolio
        • Profitability by Market Segments (Product/Age /Sales Channel/Region)
        • Sales Footprint
        • Strategy Overview
          • Marketing Strategy
          • Product Strategy
          • Channel Strategy
      • Upgrade Labs
        • Overview
        • Product Portfolio
        • Profitability by Market Segments (Product/Age /Sales Channel/Region)
        • Sales Footprint
        • Strategy Overview
          • Marketing Strategy
          • Product Strategy
          • Channel Strategy
      • Pause Studio
        • Overview
        • Product Portfolio
        • Profitability by Market Segments (Product/Age /Sales Channel/Region)
        • Sales Footprint
        • Strategy Overview
          • Marketing Strategy
          • Product Strategy
          • Channel Strategy
      • The Cryo Bar
        • Overview
        • Product Portfolio
        • Profitability by Market Segments (Product/Age /Sales Channel/Region)
        • Sales Footprint
        • Strategy Overview
          • Marketing Strategy
          • Product Strategy
          • Channel Strategy
      • ReCOVER
        • Overview
        • Product Portfolio
        • Profitability by Market Segments (Product/Age /Sales Channel/Region)
        • Sales Footprint
        • Strategy Overview
          • Marketing Strategy
          • Product Strategy
          • Channel Strategy
  21. Assumptions & Acronyms Used
  22. Research Methodology

List of Tables

  • Table 1: Global Market Value (USD Million) Forecast by Region, 2020-2035
  • Table 2: Global Market Volume (Units) Forecast by Region, 2020-2035
  • Table 3: Global Market Value (USD Million) Forecast by Service Type, 2020-2035
  • Table 4: Global Market Volume (Units) Forecast by Service Type, 2020-2035
  • Table 5: Global Market Value (USD Million) Forecast by Delivery Setting, 2020-2035
  • Table 6: Global Market Volume (Units) Forecast by Delivery Setting, 2020-2035
  • Table 7: Global Market Value (USD Million) Forecast by End User, 2020-2035
  • Table 8: Global Market Volume (Units) Forecast by End User, 2020-2035
  • Table 9: Global Market Value (USD Million) Forecast by Session Type, 2020-2035
  • Table 10: Global Market Volume (Units) Forecast by Session Type, 2020-2035
  • Table 11: Global Market Value (USD Million) Forecast by Pricing Model, 2020-2035
  • Table 12: Global Market Volume (Units) Forecast by Pricing Model, 2020-2035
  • Table 13: Global Market Value (USD Million) Forecast by Booking Channel, 2020-2035
  • Table 14: Global Market Volume (Units) Forecast by Booking Channel, 2020-2035
  • Table 15: North America Market Value (USD Million) Forecast by Country, 2020-2035
  • Table 16: North America Market Volume (Units) Forecast by Country, 2020-2035
  • Table 17: North America Market Value (USD Million) Forecast by Service Type, 2020-2035
  • Table 18: North America Market Volume (Units) Forecast by Service Type, 2020-2035
  • Table 19: North America Market Value (USD Million) Forecast by Delivery Setting, 2020-2035
  • Table 20: North America Market Volume (Units) Forecast by Delivery Setting, 2020-2035
  • Table 21: North America Market Value (USD Million) Forecast by End User, 2020-2035
  • Table 22: North America Market Volume (Units) Forecast by End User, 2020-2035
  • Table 23: North America Market Value (USD Million) Forecast by Session Type, 2020-2035
  • Table 24: North America Market Volume (Units) Forecast by Session Type, 2020-2035
  • Table 25: North America Market Value (USD Million) Forecast by Pricing Model, 2020-2035
  • Table 26: North America Market Volume (Units) Forecast by Pricing Model, 2020-2035
  • Table 27: North America Market Value (USD Million) Forecast by Booking Channel, 2020-2035
  • Table 28: North America Market Volume (Units) Forecast by Booking Channel, 2020-2035
  • Table 29: Latin America Market Value (USD Million) Forecast by Country, 2020-2035
  • Table 30: Latin America Market Volume (Units) Forecast by Country, 2020-2035
  • Table 31: Latin America Market Value (USD Million) Forecast by Service Type, 2020-2035
  • Table 32: Latin America Market Volume (Units) Forecast by Service Type, 2020-2035
  • Table 33: Latin America Market Value (USD Million) Forecast by Delivery Setting, 2020-2035
  • Table 34: Latin America Market Volume (Units) Forecast by Delivery Setting, 2020-2035
  • Table 35: Latin America Market Value (USD Million) Forecast by End User, 2020-2035
  • Table 36: Latin America Market Volume (Units) Forecast by End User, 2020-2035
  • Table 37: Latin America Market Value (USD Million) Forecast by Session Type, 2020-2035
  • Table 38: Latin America Market Volume (Units) Forecast by Session Type, 2020-2035
  • Table 39: Latin America Market Value (USD Million) Forecast by Pricing Model, 2020-2035
  • Table 40: Latin America Market Volume (Units) Forecast by Pricing Model, 2020-2035
  • Table 41: Latin America Market Value (USD Million) Forecast by Booking Channel, 2020-2035
  • Table 42: Latin America Market Volume (Units) Forecast by Booking Channel, 2020-2035
  • Table 43: Europe Market Value (USD Million) Forecast by Country, 2020-2035
  • Table 44: Europe Market Volume (Units) Forecast by Country, 2020-2035
  • Table 45: Europe Market Value (USD Million) Forecast by Service Type, 2020-2035
  • Table 46: Europe Market Volume (Units) Forecast by Service Type, 2020-2035
  • Table 47: Europe Market Value (USD Million) Forecast by Delivery Setting, 2020-2035
  • Table 48: Europe Market Volume (Units) Forecast by Delivery Setting, 2020-2035
  • Table 49: Europe Market Value (USD Million) Forecast by End User, 2020-2035
  • Table 50: Europe Market Volume (Units) Forecast by End User, 2020-2035
  • Table 51: Europe Market Value (USD Million) Forecast by Session Type, 2020-2035
  • Table 52: Europe Market Volume (Units) Forecast by Session Type, 2020-2035
  • Table 53: Europe Market Value (USD Million) Forecast by Pricing Model, 2020-2035
  • Table 54: Europe Market Volume (Units) Forecast by Pricing Model, 2020-2035
  • Table 55: Europe Market Value (USD Million) Forecast by Booking Channel, 2020-2035
  • Table 56: Europe Market Volume (Units) Forecast by Booking Channel, 2020-2035
  • Table 57: East Asia Market Value (USD Million) Forecast by Country, 2020-2035
  • Table 58: East Asia Market Volume (Units) Forecast by Country, 2020-2035
  • Table 59: East Asia Market Value (USD Million) Forecast by Service Type, 2020-2035
  • Table 60: East Asia Market Volume (Units) Forecast by Service Type, 2020-2035
  • Table 61: East Asia Market Value (USD Million) Forecast by Delivery Setting, 2020-2035
  • Table 62: East Asia Market Volume (Units) Forecast by Delivery Setting, 2020-2035
  • Table 63: East Asia Market Value (USD Million) Forecast by End User, 2020-2035
  • Table 64: East Asia Market Volume (Units) Forecast by End User, 2020-2035
  • Table 65: East Asia Market Value (USD Million) Forecast by Session Type, 2020-2035
  • Table 66: East Asia Market Volume (Units) Forecast by Session Type, 2020-2035
  • Table 67: East Asia Market Value (USD Million) Forecast by Pricing Model, 2020-2035
  • Table 68: East Asia Market Volume (Units) Forecast by Pricing Model, 2020-2035
  • Table 69: East Asia Market Value (USD Million) Forecast by Booking Channel, 2020-2035
  • Table 70: East Asia Market Volume (Units) Forecast by Booking Channel, 2020-2035
  • Table 71: South Asia & Pacific Market Value (USD Million) Forecast by Country, 2020-2035
  • Table 72: South Asia & Pacific Market Volume (Units) Forecast by Country, 2020-2035
  • Table 73: South Asia & Pacific Market Value (USD Million) Forecast by Service Type, 2020-2035
  • Table 74: South Asia & Pacific Market Volume (Units) Forecast by Service Type, 2020-2035
  • Table 75: South Asia & Pacific Market Value (USD Million) Forecast by Delivery Setting, 2020-2035
  • Table 76: South Asia & Pacific Market Volume (Units) Forecast by Delivery Setting, 2020-2035
  • Table 77: South Asia & Pacific Market Value (USD Million) Forecast by End User, 2020-2035
  • Table 78: South Asia & Pacific Market Volume (Units) Forecast by End User, 2020-2035
  • Table 79: South Asia & Pacific Market Value (USD Million) Forecast by Session Type, 2020-2035
  • Table 80: South Asia & Pacific Market Volume (Units) Forecast by Session Type, 2020-2035
  • Table 81: South Asia & Pacific Market Value (USD Million) Forecast by Pricing Model, 2020-2035
  • Table 82: South Asia & Pacific Market Volume (Units) Forecast by Pricing Model, 2020-2035
  • Table 83: South Asia & Pacific Market Value (USD Million) Forecast by Booking Channel, 2020-2035
  • Table 84: South Asia & Pacific Market Volume (Units) Forecast by Booking Channel, 2020-2035
  • Table 85: Middle East and Africa Market Value (USD Million) Forecast by Country, 2020-2035
  • Table 86: Middle East and Africa Market Volume (Units) Forecast by Country, 2020-2035
  • Table 87: Middle East and Africa Market Value (USD Million) Forecast by Service Type, 2020-2035
  • Table 88: Middle East and Africa Market Volume (Units) Forecast by Service Type, 2020-2035
  • Table 89: Middle East and Africa Market Value (USD Million) Forecast by Delivery Setting, 2020-2035
  • Table 90: Middle East and Africa Market Volume (Units) Forecast by Delivery Setting, 2020-2035
  • Table 91: Middle East and Africa Market Value (USD Million) Forecast by End User, 2020-2035
  • Table 92: Middle East and Africa Market Volume (Units) Forecast by End User, 2020-2035
  • Table 93: Middle East and Africa Market Value (USD Million) Forecast by Session Type, 2020-2035
  • Table 94: Middle East and Africa Market Volume (Units) Forecast by Session Type, 2020-2035
  • Table 95: Middle East and Africa Market Value (USD Million) Forecast by Pricing Model, 2020-2035
  • Table 96: Middle East and Africa Market Volume (Units) Forecast by Pricing Model, 2020-2035
  • Table 97: Middle East and Africa Market Value (USD Million) Forecast by Booking Channel, 2020-2035
  • Table 98: Middle East and Africa Market Volume (Units) Forecast by Booking Channel, 2020-2035

List of Figures

  • Figure 1: Global Market Value (USD Million) by Service Type, 2025-2035
  • Figure 2: Global Market Value (USD Million) by Delivery Setting, 2025-2035
  • Figure 3: Global Market Value (USD Million) by End User, 2025-2035
  • Figure 4: Global Market Value (USD Million) by Session Type, 2025-2035
  • Figure 5: Global Market Value (USD Million) by Pricing Model, 2025-2035
  • Figure 6: Global Market Value (USD Million) by Booking Channel, 2025-2035
  • Figure 7: Global Market Value (USD Million) by Region, 2025-2035
  • Figure 8: Global Market Value (USD Million) Analysis by Region, 2020-2035
  • Figure 9: Global Market Volume (Units) Analysis by Region, 2020-2035
  • Figure 10: Global Market Value Share (%) and BPS Analysis by Region, 2025-2035
  • Figure 11: Global Market Y-o-Y Growth (%) Projections by Region, 2025-2035
  • Figure 12: Global Market Value (USD Million) Analysis by Service Type, 2020-2035
  • Figure 13: Global Market Volume (Units) Analysis by Service Type, 2020-2035
  • Figure 14: Global Market Value Share (%) and BPS Analysis by Service Type, 2025-2035
  • Figure 15: Global Market Y-o-Y Growth (%) Projections by Service Type, 2025-2035
  • Figure 16: Global Market Value (USD Million) Analysis by Delivery Setting, 2020-2035
  • Figure 17: Global Market Volume (Units) Analysis by Delivery Setting, 2020-2035
  • Figure 18: Global Market Value Share (%) and BPS Analysis by Delivery Setting, 2025-2035
  • Figure 19: Global Market Y-o-Y Growth (%) Projections by Delivery Setting, 2025-2035
  • Figure 20: Global Market Value (USD Million) Analysis by End User, 2020-2035
  • Figure 21: Global Market Volume (Units) Analysis by End User, 2020-2035
  • Figure 22: Global Market Value Share (%) and BPS Analysis by End User, 2025-2035
  • Figure 23: Global Market Y-o-Y Growth (%) Projections by End User, 2025-2035
  • Figure 24: Global Market Value (USD Million) Analysis by Session Type, 2020-2035
  • Figure 25: Global Market Volume (Units) Analysis by Session Type, 2020-2035
  • Figure 26: Global Market Value Share (%) and BPS Analysis by Session Type, 2025-2035
  • Figure 27: Global Market Y-o-Y Growth (%) Projections by Session Type, 2025-2035
  • Figure 28: Global Market Value (USD Million) Analysis by Pricing Model, 2020-2035
  • Figure 29: Global Market Volume (Units) Analysis by Pricing Model, 2020-2035
  • Figure 30: Global Market Value Share (%) and BPS Analysis by Pricing Model, 2025-2035
  • Figure 31: Global Market Y-o-Y Growth (%) Projections by Pricing Model, 2025-2035
  • Figure 32: Global Market Value (USD Million) Analysis by Booking Channel, 2020-2035
  • Figure 33: Global Market Volume (Units) Analysis by Booking Channel, 2020-2035
  • Figure 34: Global Market Value Share (%) and BPS Analysis by Booking Channel, 2025-2035
  • Figure 35: Global Market Y-o-Y Growth (%) Projections by Booking Channel, 2025-2035
  • Figure 36: Global Market Attractiveness by Service Type, 2025-2035
  • Figure 37: Global Market Attractiveness by Delivery Setting, 2025-2035
  • Figure 38: Global Market Attractiveness by End User, 2025-2035
  • Figure 39: Global Market Attractiveness by Session Type, 2025-2035
  • Figure 40: Global Market Attractiveness by Pricing Model, 2025-2035
  • Figure 41: Global Market Attractiveness by Booking Channel, 2025-2035
  • Figure 42: Global Market Attractiveness by Region, 2025-2035
  • Figure 43: North America Market Value (USD Million) by Service Type, 2025-2035
  • Figure 44: North America Market Value (USD Million) by Delivery Setting, 2025-2035
  • Figure 45: North America Market Value (USD Million) by End User, 2025-2035
  • Figure 46: North America Market Value (USD Million) by Session Type, 2025-2035
  • Figure 47: North America Market Value (USD Million) by Pricing Model, 2025-2035
  • Figure 48: North America Market Value (USD Million) by Booking Channel, 2025-2035
  • Figure 49: North America Market Value (USD Million) by Country, 2025-2035
  • Figure 50: North America Market Value (USD Million) Analysis by Country, 2020-2035
  • Figure 51: North America Market Volume (Units) Analysis by Country, 2020-2035
  • Figure 52: North America Market Value Share (%) and BPS Analysis by Country, 2025-2035
  • Figure 53: North America Market Y-o-Y Growth (%) Projections by Country, 2025-2035
  • Figure 54: North America Market Value (USD Million) Analysis by Service Type, 2020-2035
  • Figure 55: North America Market Volume (Units) Analysis by Service Type, 2020-2035
  • Figure 56: North America Market Value Share (%) and BPS Analysis by Service Type, 2025-2035
  • Figure 57: North America Market Y-o-Y Growth (%) Projections by Service Type, 2025-2035
  • Figure 58: North America Market Value (USD Million) Analysis by Delivery Setting, 2020-2035
  • Figure 59: North America Market Volume (Units) Analysis by Delivery Setting, 2020-2035
  • Figure 60: North America Market Value Share (%) and BPS Analysis by Delivery Setting, 2025-2035
  • Figure 61: North America Market Y-o-Y Growth (%) Projections by Delivery Setting, 2025-2035
  • Figure 62: North America Market Value (USD Million) Analysis by End User, 2020-2035
  • Figure 63: North America Market Volume (Units) Analysis by End User, 2020-2035
  • Figure 64: North America Market Value Share (%) and BPS Analysis by End User, 2025-2035
  • Figure 65: North America Market Y-o-Y Growth (%) Projections by End User, 2025-2035
  • Figure 66: North America Market Value (USD Million) Analysis by Session Type, 2020-2035
  • Figure 67: North America Market Volume (Units) Analysis by Session Type, 2020-2035
  • Figure 68: North America Market Value Share (%) and BPS Analysis by Session Type, 2025-2035
  • Figure 69: North America Market Y-o-Y Growth (%) Projections by Session Type, 2025-2035
  • Figure 70: North America Market Value (USD Million) Analysis by Pricing Model, 2020-2035
  • Figure 71: North America Market Volume (Units) Analysis by Pricing Model, 2020-2035
  • Figure 72: North America Market Value Share (%) and BPS Analysis by Pricing Model, 2025-2035
  • Figure 73: North America Market Y-o-Y Growth (%) Projections by Pricing Model, 2025-2035
  • Figure 74: North America Market Value (USD Million) Analysis by Booking Channel, 2020-2035
  • Figure 75: North America Market Volume (Units) Analysis by Booking Channel, 2020-2035
  • Figure 76: North America Market Value Share (%) and BPS Analysis by Booking Channel, 2025-2035
  • Figure 77: North America Market Y-o-Y Growth (%) Projections by Booking Channel, 2025-2035
  • Figure 78: North America Market Attractiveness by Service Type, 2025-2035
  • Figure 79: North America Market Attractiveness by Delivery Setting, 2025-2035
  • Figure 80: North America Market Attractiveness by End User, 2025-2035
  • Figure 81: North America Market Attractiveness by Session Type, 2025-2035
  • Figure 82: North America Market Attractiveness by Pricing Model, 2025-2035
  • Figure 83: North America Market Attractiveness by Booking Channel, 2025-2035
  • Figure 84: North America Market Attractiveness by Country, 2025-2035
  • Figure 85: Latin America Market Value (USD Million) by Service Type, 2025-2035
  • Figure 86: Latin America Market Value (USD Million) by Delivery Setting, 2025-2035
  • Figure 87: Latin America Market Value (USD Million) by End User, 2025-2035
  • Figure 88: Latin America Market Value (USD Million) by Session Type, 2025-2035
  • Figure 89: Latin America Market Value (USD Million) by Pricing Model, 2025-2035
  • Figure 90: Latin America Market Value (USD Million) by Booking Channel, 2025-2035
  • Figure 91: Latin America Market Value (USD Million) by Country, 2025-2035
  • Figure 92: Latin America Market Value (USD Million) Analysis by Country, 2020-2035
  • Figure 93: Latin America Market Volume (Units) Analysis by Country, 2020-2035
  • Figure 94: Latin America Market Value Share (%) and BPS Analysis by Country, 2025-2035
  • Figure 95: Latin America Market Y-o-Y Growth (%) Projections by Country, 2025-2035
  • Figure 96: Latin America Market Value (USD Million) Analysis by Service Type, 2020-2035
  • Figure 97: Latin America Market Volume (Units) Analysis by Service Type, 2020-2035
  • Figure 98: Latin America Market Value Share (%) and BPS Analysis by Service Type, 2025-2035
  • Figure 99: Latin America Market Y-o-Y Growth (%) Projections by Service Type, 2025-2035
  • Figure 100: Latin America Market Value (USD Million) Analysis by Delivery Setting, 2020-2035
  • Figure 101: Latin America Market Volume (Units) Analysis by Delivery Setting, 2020-2035
  • Figure 102: Latin America Market Value Share (%) and BPS Analysis by Delivery Setting, 2025-2035
  • Figure 103: Latin America Market Y-o-Y Growth (%) Projections by Delivery Setting, 2025-2035
  • Figure 104: Latin America Market Value (USD Million) Analysis by End User, 2020-2035
  • Figure 105: Latin America Market Volume (Units) Analysis by End User, 2020-2035
  • Figure 106: Latin America Market Value Share (%) and BPS Analysis by End User, 2025-2035
  • Figure 107: Latin America Market Y-o-Y Growth (%) Projections by End User, 2025-2035
  • Figure 108: Latin America Market Value (USD Million) Analysis by Session Type, 2020-2035
  • Figure 109: Latin America Market Volume (Units) Analysis by Session Type, 2020-2035
  • Figure 110: Latin America Market Value Share (%) and BPS Analysis by Session Type, 2025-2035
  • Figure 111: Latin America Market Y-o-Y Growth (%) Projections by Session Type, 2025-2035
  • Figure 112: Latin America Market Value (USD Million) Analysis by Pricing Model, 2020-2035
  • Figure 113: Latin America Market Volume (Units) Analysis by Pricing Model, 2020-2035
  • Figure 114: Latin America Market Value Share (%) and BPS Analysis by Pricing Model, 2025-2035
  • Figure 115: Latin America Market Y-o-Y Growth (%) Projections by Pricing Model, 2025-2035
  • Figure 116: Latin America Market Value (USD Million) Analysis by Booking Channel, 2020-2035
  • Figure 117: Latin America Market Volume (Units) Analysis by Booking Channel, 2020-2035
  • Figure 118: Latin America Market Value Share (%) and BPS Analysis by Booking Channel, 2025-2035
  • Figure 119: Latin America Market Y-o-Y Growth (%) Projections by Booking Channel, 2025-2035
  • Figure 120: Latin America Market Attractiveness by Service Type, 2025-2035
  • Figure 121: Latin America Market Attractiveness by Delivery Setting, 2025-2035
  • Figure 122: Latin America Market Attractiveness by End User, 2025-2035
  • Figure 123: Latin America Market Attractiveness by Session Type, 2025-2035
  • Figure 124: Latin America Market Attractiveness by Pricing Model, 2025-2035
  • Figure 125: Latin America Market Attractiveness by Booking Channel, 2025-2035
  • Figure 126: Latin America Market Attractiveness by Country, 2025-2035
  • Figure 127: Europe Market Value (USD Million) by Service Type, 2025-2035
  • Figure 128: Europe Market Value (USD Million) by Delivery Setting, 2025-2035
  • Figure 129: Europe Market Value (USD Million) by End User, 2025-2035
  • Figure 130: Europe Market Value (USD Million) by Session Type, 2025-2035
  • Figure 131: Europe Market Value (USD Million) by Pricing Model, 2025-2035
  • Figure 132: Europe Market Value (USD Million) by Booking Channel, 2025-2035
  • Figure 133: Europe Market Value (USD Million) by Country, 2025-2035
  • Figure 134: Europe Market Value (USD Million) Analysis by Country, 2020-2035
  • Figure 135: Europe Market Volume (Units) Analysis by Country, 2020-2035
  • Figure 136: Europe Market Value Share (%) and BPS Analysis by Country, 2025-2035
  • Figure 137: Europe Market Y-o-Y Growth (%) Projections by Country, 2025-2035
  • Figure 138: Europe Market Value (USD Million) Analysis by Service Type, 2020-2035
  • Figure 139: Europe Market Volume (Units) Analysis by Service Type, 2020-2035
  • Figure 140: Europe Market Value Share (%) and BPS Analysis by Service Type, 2025-2035
  • Figure 141: Europe Market Y-o-Y Growth (%) Projections by Service Type, 2025-2035
  • Figure 142: Europe Market Value (USD Million) Analysis by Delivery Setting, 2020-2035
  • Figure 143: Europe Market Volume (Units) Analysis by Delivery Setting, 2020-2035
  • Figure 144: Europe Market Value Share (%) and BPS Analysis by Delivery Setting, 2025-2035
  • Figure 145: Europe Market Y-o-Y Growth (%) Projections by Delivery Setting, 2025-2035
  • Figure 146: Europe Market Value (USD Million) Analysis by End User, 2020-2035
  • Figure 147: Europe Market Volume (Units) Analysis by End User, 2020-2035
  • Figure 148: Europe Market Value Share (%) and BPS Analysis by End User, 2025-2035
  • Figure 149: Europe Market Y-o-Y Growth (%) Projections by End User, 2025-2035
  • Figure 150: Europe Market Value (USD Million) Analysis by Session Type, 2020-2035
  • Figure 151: Europe Market Volume (Units) Analysis by Session Type, 2020-2035
  • Figure 152: Europe Market Value Share (%) and BPS Analysis by Session Type, 2025-2035
  • Figure 153: Europe Market Y-o-Y Growth (%) Projections by Session Type, 2025-2035
  • Figure 154: Europe Market Value (USD Million) Analysis by Pricing Model, 2020-2035
  • Figure 155: Europe Market Volume (Units) Analysis by Pricing Model, 2020-2035
  • Figure 156: Europe Market Value Share (%) and BPS Analysis by Pricing Model, 2025-2035
  • Figure 157: Europe Market Y-o-Y Growth (%) Projections by Pricing Model, 2025-2035
  • Figure 158: Europe Market Value (USD Million) Analysis by Booking Channel, 2020-2035
  • Figure 159: Europe Market Volume (Units) Analysis by Booking Channel, 2020-2035
  • Figure 160: Europe Market Value Share (%) and BPS Analysis by Booking Channel, 2025-2035
  • Figure 161: Europe Market Y-o-Y Growth (%) Projections by Booking Channel, 2025-2035
  • Figure 162: Europe Market Attractiveness by Service Type, 2025-2035
  • Figure 163: Europe Market Attractiveness by Delivery Setting, 2025-2035
  • Figure 164: Europe Market Attractiveness by End User, 2025-2035
  • Figure 165: Europe Market Attractiveness by Session Type, 2025-2035
  • Figure 166: Europe Market Attractiveness by Pricing Model, 2025-2035
  • Figure 167: Europe Market Attractiveness by Booking Channel, 2025-2035
  • Figure 168: Europe Market Attractiveness by Country, 2025-2035
  • Figure 169: East Asia Market Value (USD Million) by Service Type, 2025-2035
  • Figure 170: East Asia Market Value (USD Million) by Delivery Setting, 2025-2035
  • Figure 171: East Asia Market Value (USD Million) by End User, 2025-2035
  • Figure 172: East Asia Market Value (USD Million) by Session Type, 2025-2035
  • Figure 173: East Asia Market Value (USD Million) by Pricing Model, 2025-2035
  • Figure 174: East Asia Market Value (USD Million) by Booking Channel, 2025-2035
  • Figure 175: East Asia Market Value (USD Million) by Country, 2025-2035
  • Figure 176: East Asia Market Value (USD Million) Analysis by Country, 2020-2035
  • Figure 177: East Asia Market Volume (Units) Analysis by Country, 2020-2035
  • Figure 178: East Asia Market Value Share (%) and BPS Analysis by Country, 2025-2035
  • Figure 179: East Asia Market Y-o-Y Growth (%) Projections by Country, 2025-2035
  • Figure 180: East Asia Market Value (USD Million) Analysis by Service Type, 2020-2035
  • Figure 181: East Asia Market Volume (Units) Analysis by Service Type, 2020-2035
  • Figure 182: East Asia Market Value Share (%) and BPS Analysis by Service Type, 2025-2035
  • Figure 183: East Asia Market Y-o-Y Growth (%) Projections by Service Type, 2025-2035
  • Figure 184: East Asia Market Value (USD Million) Analysis by Delivery Setting, 2020-2035
  • Figure 185: East Asia Market Volume (Units) Analysis by Delivery Setting, 2020-2035
  • Figure 186: East Asia Market Value Share (%) and BPS Analysis by Delivery Setting, 2025-2035
  • Figure 187: East Asia Market Y-o-Y Growth (%) Projections by Delivery Setting, 2025-2035
  • Figure 188: East Asia Market Value (USD Million) Analysis by End User, 2020-2035
  • Figure 189: East Asia Market Volume (Units) Analysis by End User, 2020-2035
  • Figure 190: East Asia Market Value Share (%) and BPS Analysis by End User, 2025-2035
  • Figure 191: East Asia Market Y-o-Y Growth (%) Projections by End User, 2025-2035
  • Figure 192: East Asia Market Value (USD Million) Analysis by Session Type, 2020-2035
  • Figure 193: East Asia Market Volume (Units) Analysis by Session Type, 2020-2035
  • Figure 194: East Asia Market Value Share (%) and BPS Analysis by Session Type, 2025-2035
  • Figure 195: East Asia Market Y-o-Y Growth (%) Projections by Session Type, 2025-2035
  • Figure 196: East Asia Market Value (USD Million) Analysis by Pricing Model, 2020-2035
  • Figure 197: East Asia Market Volume (Units) Analysis by Pricing Model, 2020-2035
  • Figure 198: East Asia Market Value Share (%) and BPS Analysis by Pricing Model, 2025-2035
  • Figure 199: East Asia Market Y-o-Y Growth (%) Projections by Pricing Model, 2025-2035
  • Figure 200: East Asia Market Value (USD Million) Analysis by Booking Channel, 2020-2035
  • Figure 201: East Asia Market Volume (Units) Analysis by Booking Channel, 2020-2035
  • Figure 202: East Asia Market Value Share (%) and BPS Analysis by Booking Channel, 2025-2035
  • Figure 203: East Asia Market Y-o-Y Growth (%) Projections by Booking Channel, 2025-2035
  • Figure 204: East Asia Market Attractiveness by Service Type, 2025-2035
  • Figure 205: East Asia Market Attractiveness by Delivery Setting, 2025-2035
  • Figure 206: East Asia Market Attractiveness by End User, 2025-2035
  • Figure 207: East Asia Market Attractiveness by Session Type, 2025-2035
  • Figure 208: East Asia Market Attractiveness by Pricing Model, 2025-2035
  • Figure 209: East Asia Market Attractiveness by Booking Channel, 2025-2035
  • Figure 210: East Asia Market Attractiveness by Country, 2025-2035
  • Figure 211: South Asia & Pacific Market Value (USD Million) by Service Type, 2025-2035
  • Figure 212: South Asia & Pacific Market Value (USD Million) by Delivery Setting, 2025-2035
  • Figure 213: South Asia & Pacific Market Value (USD Million) by End User, 2025-2035
  • Figure 214: South Asia & Pacific Market Value (USD Million) by Session Type, 2025-2035
  • Figure 215: South Asia & Pacific Market Value (USD Million) by Pricing Model, 2025-2035
  • Figure 216: South Asia & Pacific Market Value (USD Million) by Booking Channel, 2025-2035
  • Figure 217: South Asia & Pacific Market Value (USD Million) by Country, 2025-2035
  • Figure 218: South Asia & Pacific Market Value (USD Million) Analysis by Country, 2020-2035
  • Figure 219: South Asia & Pacific Market Volume (Units) Analysis by Country, 2020-2035
  • Figure 220: South Asia & Pacific Market Value Share (%) and BPS Analysis by Country, 2025-2035
  • Figure 221: South Asia & Pacific Market Y-o-Y Growth (%) Projections by Country, 2025-2035
  • Figure 222: South Asia & Pacific Market Value (USD Million) Analysis by Service Type, 2020-2035
  • Figure 223: South Asia & Pacific Market Volume (Units) Analysis by Service Type, 2020-2035
  • Figure 224: South Asia & Pacific Market Value Share (%) and BPS Analysis by Service Type, 2025-2035
  • Figure 225: South Asia & Pacific Market Y-o-Y Growth (%) Projections by Service Type, 2025-2035
  • Figure 226: South Asia & Pacific Market Value (USD Million) Analysis by Delivery Setting, 2020-2035
  • Figure 227: South Asia & Pacific Market Volume (Units) Analysis by Delivery Setting, 2020-2035
  • Figure 228: South Asia & Pacific Market Value Share (%) and BPS Analysis by Delivery Setting, 2025-2035
  • Figure 229: South Asia & Pacific Market Y-o-Y Growth (%) Projections by Delivery Setting, 2025-2035
  • Figure 230: South Asia & Pacific Market Value (USD Million) Analysis by End User, 2020-2035
  • Figure 231: South Asia & Pacific Market Volume (Units) Analysis by End User, 2020-2035
  • Figure 232: South Asia & Pacific Market Value Share (%) and BPS Analysis by End User, 2025-2035
  • Figure 233: South Asia & Pacific Market Y-o-Y Growth (%) Projections by End User, 2025-2035
  • Figure 234: South Asia & Pacific Market Value (USD Million) Analysis by Session Type, 2020-2035
  • Figure 235: South Asia & Pacific Market Volume (Units) Analysis by Session Type, 2020-2035
  • Figure 236: South Asia & Pacific Market Value Share (%) and BPS Analysis by Session Type, 2025-2035
  • Figure 237: South Asia & Pacific Market Y-o-Y Growth (%) Projections by Session Type, 2025-2035
  • Figure 238: South Asia & Pacific Market Value (USD Million) Analysis by Pricing Model, 2020-2035
  • Figure 239: South Asia & Pacific Market Volume (Units) Analysis by Pricing Model, 2020-2035
  • Figure 240: South Asia & Pacific Market Value Share (%) and BPS Analysis by Pricing Model, 2025-2035
  • Figure 241: South Asia & Pacific Market Y-o-Y Growth (%) Projections by Pricing Model, 2025-2035
  • Figure 242: South Asia & Pacific Market Value (USD Million) Analysis by Booking Channel, 2020-2035
  • Figure 243: South Asia & Pacific Market Volume (Units) Analysis by Booking Channel, 2020-2035
  • Figure 244: South Asia & Pacific Market Value Share (%) and BPS Analysis by Booking Channel, 2025-2035
  • Figure 245: South Asia & Pacific Market Y-o-Y Growth (%) Projections by Booking Channel, 2025-2035
  • Figure 246: South Asia & Pacific Market Attractiveness by Service Type, 2025-2035
  • Figure 247: South Asia & Pacific Market Attractiveness by Delivery Setting, 2025-2035
  • Figure 248: South Asia & Pacific Market Attractiveness by End User, 2025-2035
  • Figure 249: South Asia & Pacific Market Attractiveness by Session Type, 2025-2035
  • Figure 250: South Asia & Pacific Market Attractiveness by Pricing Model, 2025-2035
  • Figure 251: South Asia & Pacific Market Attractiveness by Booking Channel, 2025-2035
  • Figure 252: South Asia & Pacific Market Attractiveness by Country, 2025-2035
  • Figure 253: Middle East and Africa Market Value (USD Million) by Service Type, 2025-2035
  • Figure 254: Middle East and Africa Market Value (USD Million) by Delivery Setting, 2025-2035
  • Figure 255: Middle East and Africa Market Value (USD Million) by End User, 2025-2035
  • Figure 256: Middle East and Africa Market Value (USD Million) by Session Type, 2025-2035
  • Figure 257: Middle East and Africa Market Value (USD Million) by Pricing Model, 2025-2035
  • Figure 258: Middle East and Africa Market Value (USD Million) by Booking Channel, 2025-2035
  • Figure 259: Middle East and Africa Market Value (USD Million) by Country, 2025-2035
  • Figure 260: Middle East and Africa Market Value (USD Million) Analysis by Country, 2020-2035
  • Figure 261: Middle East and Africa Market Volume (Units) Analysis by Country, 2020-2035
  • Figure 262: Middle East and Africa Market Value Share (%) and BPS Analysis by Country, 2025-2035
  • Figure 263: Middle East and Africa Market Y-o-Y Growth (%) Projections by Country, 2025-2035
  • Figure 264: Middle East and Africa Market Value (USD Million) Analysis by Service Type, 2020-2035
  • Figure 265: Middle East and Africa Market Volume (Units) Analysis by Service Type, 2020-2035
  • Figure 266: Middle East and Africa Market Value Share (%) and BPS Analysis by Service Type, 2025-2035
  • Figure 267: Middle East and Africa Market Y-o-Y Growth (%) Projections by Service Type, 2025-2035
  • Figure 268: Middle East and Africa Market Value (USD Million) Analysis by Delivery Setting, 2020-2035
  • Figure 269: Middle East and Africa Market Volume (Units) Analysis by Delivery Setting, 2020-2035
  • Figure 270: Middle East and Africa Market Value Share (%) and BPS Analysis by Delivery Setting, 2025-2035
  • Figure 271: Middle East and Africa Market Y-o-Y Growth (%) Projections by Delivery Setting, 2025-2035
  • Figure 272: Middle East and Africa Market Value (USD Million) Analysis by End User, 2020-2035
  • Figure 273: Middle East and Africa Market Volume (Units) Analysis by End User, 2020-2035
  • Figure 274: Middle East and Africa Market Value Share (%) and BPS Analysis by End User, 2025-2035
  • Figure 275: Middle East and Africa Market Y-o-Y Growth (%) Projections by End User, 2025-2035
  • Figure 276: Middle East and Africa Market Value (USD Million) Analysis by Session Type, 2020-2035
  • Figure 277: Middle East and Africa Market Volume (Units) Analysis by Session Type, 2020-2035
  • Figure 278: Middle East and Africa Market Value Share (%) and BPS Analysis by Session Type, 2025-2035
  • Figure 279: Middle East and Africa Market Y-o-Y Growth (%) Projections by Session Type, 2025-2035
  • Figure 280: Middle East and Africa Market Value (USD Million) Analysis by Pricing Model, 2020-2035
  • Figure 281: Middle East and Africa Market Volume (Units) Analysis by Pricing Model, 2020-2035
  • Figure 282: Middle East and Africa Market Value Share (%) and BPS Analysis by Pricing Model, 2025-2035
  • Figure 283: Middle East and Africa Market Y-o-Y Growth (%) Projections by Pricing Model, 2025-2035
  • Figure 284: Middle East and Africa Market Value (USD Million) Analysis by Booking Channel, 2020-2035
  • Figure 285: Middle East and Africa Market Volume (Units) Analysis by Booking Channel, 2020-2035
  • Figure 286: Middle East and Africa Market Value Share (%) and BPS Analysis by Booking Channel, 2025-2035
  • Figure 287: Middle East and Africa Market Y-o-Y Growth (%) Projections by Booking Channel, 2025-2035
  • Figure 288: Middle East and Africa Market Attractiveness by Service Type, 2025-2035
  • Figure 289: Middle East and Africa Market Attractiveness by Delivery Setting, 2025-2035
  • Figure 290: Middle East and Africa Market Attractiveness by End User, 2025-2035
  • Figure 291: Middle East and Africa Market Attractiveness by Session Type, 2025-2035
  • Figure 292: Middle East and Africa Market Attractiveness by Pricing Model, 2025-2035
  • Figure 293: Middle East and Africa Market Attractiveness by Booking Channel, 2025-2035
  • Figure 294: Middle East and Africa Market Attractiveness by Country, 2025-2035

Frequently Asked Questions

How big is the Global Fitness Recovery Services Market in 2025?

The Global Fitness Recovery Services Market is estimated to be valued at USD 8,219.7 million in 2025.

What will be the size of the Global Fitness Recovery Services Market in 2035?

The market size for the Global Fitness Recovery Services Market is projected to reach USD 24,528.9 million by 2035.

How much will be the Global Fitness Recovery Services Market growth between 2025 and 2035?

The Global Fitness Recovery Services Market is expected to grow at a 11.6% CAGR between 2025 and 2035.

What are the key service types in the Global Fitness Recovery Services Market?

The key service types in the market are massage therapy & assisted stretch, cryotherapy, compression therapy, infrared/red-light therapy, myofascial/percussive & mobility sessions, and other recovery modalities.

Which booking channel is expected to contribute the largest share in 2025?

In terms of booking channel, app/web booking is projected to command 63.2% share in 2025 (USD 5,194.8 million).

Explore Similar Insights

Future Market Insights

Fitness Recovery Services Market