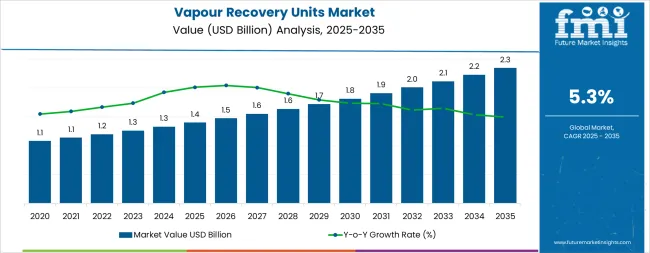
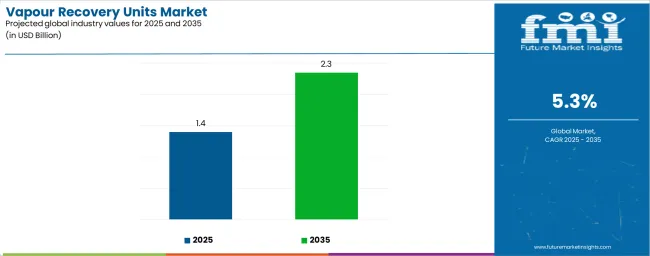
The global vapour recovery units market is valued at USD 1.4 billion in 2025 and is slated to reach USD 2.3 billion by 2035, recording an absolute increase of USD 0.9 billion over the forecast period. This translates into a total growth of 64.3%, with the market forecast to expand at a compound annual growth rate (CAGR) of 5.3% between 2025 and 2035. The overall market size is expected to grow by nearly 1.6X during the same period, supported by increasing environmental regulations enforcement, growing oil and gas infrastructure development, and rising adoption of VOC emission control technologies across diverse industrial and energy applications.
| Metric | Value |
|---|---|
| Estimated Value in (2025E) | USD 1.4 billion |
| Forecast Value in (2035F) | USD 2.3 billion |
| Forecast CAGR (2025 to 2035) | 5.3% |
From 2030 to 2035, the market is forecast to grow from USD 1.8 billion to USD 2.3 billion, adding another USD 0.5 billion, which constitutes 55.6% of the overall ten-year expansion. This period is expected to be characterized by the expansion of smart monitoring technologies, the integration of IoT-enabled emission control systems, and the development of advanced membrane separation solutions for major industrial and energy infrastructure projects. The growing adoption of digital transformation programs and automated monitoring initiatives will drive demand for vapour recovery units with enhanced technological capabilities and reduced operational complexity.
Between 2020 and 2025, the vapour recovery units market experienced steady growth, driven by increasing environmental awareness and growing recognition of VOC emission control as essential technology for regulatory compliance and operational efficiency. The market developed as industrial operators and energy companies recognized the potential for advanced vapour recovery systems to enhance environmental performance while reducing product losses and improving cost efficiency. Technological advancement in smart monitoring and digital control systems began emphasizing the critical importance of maintaining emission compliance and operational reliability in industrial processing applications.
Market expansion is being supported by the increasing environmental regulations enforcement and the corresponding need for effective emission control equipment that can maintain regulatory compliance and operational efficiency while supporting diverse industrial applications across various processing environments. Modern industrial operators and energy companies are increasingly focused on implementing vapour recovery solutions that can reduce emission violations, minimize product losses, and provide consistent performance in VOC control operations. Vapour recovery units' proven ability to deliver enhanced environmental compliance, reliable emission control capabilities, and versatile industrial applications make them essential equipment for contemporary industrial operations and energy processing solutions.
The growing emphasis on environmental compliance and operational efficiency is driving demand for vapour recovery units that can support stringent emission standards, reduce regulatory risks, and enable efficient vapour capture operations across varying industrial configurations. Industrial operators' preference for equipment that combines reliability with environmental performance and cost-effectiveness is creating opportunities for innovative vapour recovery implementations. The rising influence of smart monitoring technologies and automated control systems is also contributing to increased adoption of vapour recovery units that can provide advanced operational control without compromising performance or environmental compliance.
The vapour recovery units market is poised for steady growth and transformation. As industrial operators across both developed and emerging markets seek emission control equipment that is efficient, reliable, compliant, and operationally effective, vapour recovery systems are gaining prominence not just as environmental equipment but as strategic infrastructure for regulatory compliance, operational efficiency, cost optimization, and environmental performance enhancement.
Rising environmental regulations and industrial development in North America, East Asia, and South Asia Pacific amplify demand, while manufacturers are picking up on innovations in smart monitoring technologies and advanced separation systems.
Pathways like membrane separation technologies, IoT integration, and smart monitoring promise strong margin uplift, especially in developed markets. Geographic expansion and application diversification will capture volume, particularly where industrial activities are growing or environmental infrastructure requires modernization. Environmental pressures around VOC emissions, regulatory compliance, operational efficiency, and cost optimization give structural support.
The market is segmented by technology, process, application, end-use, and region. By technology, the market is divided into adsorption, condensation, and absorption. By process, it covers upstream and downstream. By application, it is segmented into marine loading, truck loading, railcar loading, pipelines, and storage tank vents. By end-use, it includes oil & gas compressors, landfills, brewery and food processing, and others. Regionally, the market is divided into North America, Latin America, Western Europe, Eastern Europe, East Asia, South Asia Pacific, and Middle East & Africa.
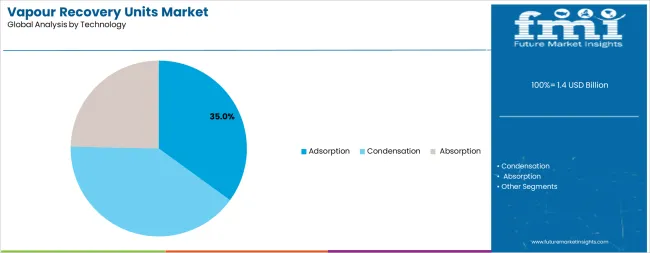
The adsorption technology segment is projected to account for 35% of the vapour recovery units market in 2025, reaffirming its position as the leading technology category. Industrial operators and energy companies increasingly utilize adsorption VRU systems for their proven efficiency, operational reliability, and versatile deployment capabilities across oil & gas, petrochemical, and storage applications. Adsorption technology's established operational procedures and consistent performance characteristics directly address the industrial requirements for reliable emission control and operational efficiency in diverse processing environments.
This technology segment forms the foundation of current vapour recovery operations, as it represents the technology with the greatest operational flexibility and proven application compatibility across multiple industries and processing scenarios. Operator investments in enhanced adsorption systems and operational optimization continue to strengthen adoption among energy companies and industrial processors. With operators prioritizing operational reliability and cost-effectiveness, adsorption systems align with both environmental compliance objectives and operational management requirements, making them the central component of comprehensive emission control strategies.
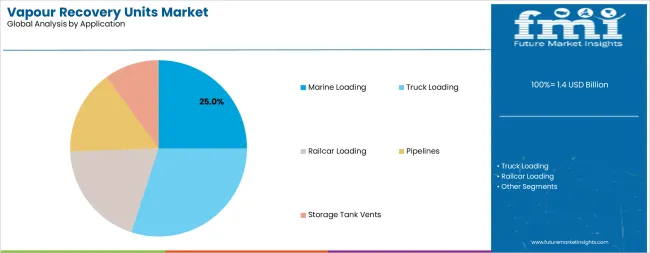
Truck loading applications are projected to represent 30% of vapour recovery units demand in 2025, underscoring their critical role as the primary application for fuel and chemical transportation operations. Industrial operators prefer truck loading VRU systems for their operational necessity, regulatory compliance requirements, and ability to support continuous loading operations while ensuring emission control and product recovery requirements. Positioned as essential equipment for modern transportation operations, truck loading applications offer both compliance advantages and operational benefits.
The segment is supported by continuous innovation in loading terminal operations and the growing availability of specialized VRU configurations that enable efficient vapour capture with enhanced recovery capabilities. Additionally, transportation operators are investing in truck loading solutions to support large-scale operations and regulatory compliance delivery. As fuel transportation becomes more prevalent and emission requirements increase, truck loading applications will continue to dominate the application market while supporting advanced VRU utilization and transportation operational strategies.
The vapour recovery units market is advancing steadily due to increasing environmental regulations enforcement and growing adoption of emission control infrastructure that provides enhanced regulatory compliance and operational efficiency across diverse industrial applications. However, the market faces challenges, including high initial investment costs, complex installation requirements, and varying regulatory standards across different operational environments. Innovation in smart monitoring technologies and advanced separation systems continues to influence equipment development and market expansion patterns.
The growing enforcement of environmental regulations and emission control standards is enabling equipment manufacturers to develop vapour recovery systems that provide superior emission control, enhanced regulatory compliance, and reliable performance in high-volume industrial environments. Advanced VRU systems provide improved environmental performance while allowing more effective vapour capture and consistent compliance delivery across various applications and industrial requirements. Manufacturers are increasingly recognizing the competitive advantages of modern VRU capabilities for environmental compliance and operational efficiency positioning.
Modern vapour recovery unit manufacturers are incorporating smart monitoring and automated control systems to enhance emission control accuracy, reduce operational costs, and ensure consistent performance delivery to industrial and energy operators. These technologies improve system reliability while enabling new applications, including predictive maintenance and remote monitoring solutions. Advanced technology integration also allows manufacturers to support premium equipment positioning and operational optimization beyond traditional emission control equipment supply.
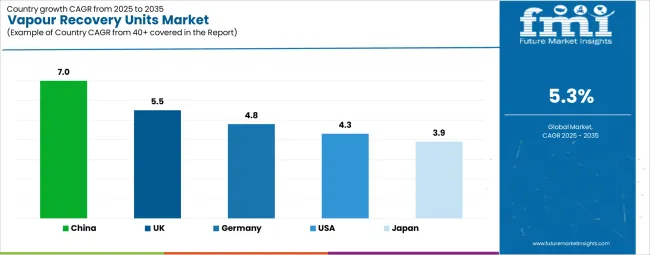
| Country | CAGR (2025-2035) |
|---|---|
| UK | 5.5% |
| Germany | 4.8% |
| USA | 4.3% |
| Japan | 3.9% |
| China | 7% |
The vapour recovery units market is experiencing varied growth globally, with ASEAN leading at a 5.7% CAGR through 2035, driven by expanding oil and gas infrastructure, rapid industrial development, and significant adoption of environmental compliance solutions. UK follows at 5.5%, supported by stringent environmental regulations, industrial modernization programs, and growing adoption of emission control technologies. Germany shows growth at 4.8%, emphasizing environmental compliance and advanced manufacturing capabilities. USA records 4.3%, focusing on EPA regulations and oil & gas infrastructure development. Japan demonstrates 3.9% growth, supported by environmental standards and industrial modernization programs.
The report covers an in-depth analysis of 40+ countries top-performing countries are highlighted below.
Revenue from vapour recovery units in China is expanding at a CAGR of 7.0%, supported by the country’s rapid industrial expansion, strengthened environmental governance, and increasing investments in advanced emission control infrastructure. China’s commitment to achieving national carbon reduction goals and enhancing energy efficiency is driving widespread adoption of vapour recovery systems across refineries, petrochemical facilities, and storage terminals. The country’s emphasis on sustainable production and regulatory compliance continues to stimulate demand for high-performance VRU technologies designed to minimize volatile organic compound (VOC) emissions and improve operational efficiency.
Revenue from vapour recovery units in UK is expanding at a CAGR of 5.5%, supported by the country's stringent environmental regulations, comprehensive industrial modernization programs, and increasing adoption of advanced emission control systems. The country's established regulatory framework and growing emphasis on environmental performance are driving sophisticated VRU capabilities. Industrial companies and energy operators are establishing extensive emission control operations to address the growing demand for regulatory compliance and operational efficiency.
Revenue from vapour recovery units in Germany is growing at a CAGR of 4.8%, driven by expanding environmental compliance requirements, increasing manufacturing modernization activities, and growing investment in emission control enhancement. The country's established industrial sector and emphasis on environmental performance are supporting demand for advanced VRU technologies across major industrial markets. Industrial operators and energy companies are establishing comprehensive emission control programs to serve both domestic compliance needs and operational efficiency requirements.
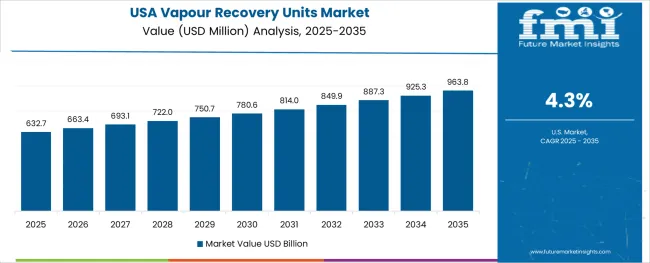
Revenue from vapour recovery units in USA is expanding at a CAGR of 4.3%, supported by the country's focus on EPA regulatory compliance, comprehensive oil & gas infrastructure development, and strategic investment in emission control improvement. USA's established energy infrastructure and emphasis on regulatory adherence are driving demand for specialized VRU technologies focusing on operational reliability and compliance assurance. Energy operators are investing in comprehensive emission control modernization to serve both domestic regulatory requirements and operational efficiency initiatives.
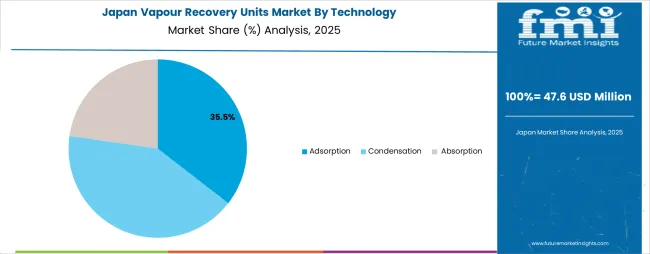
Revenue from vapour recovery units in Japan is expanding at a CAGR of 3.9%, supported by the country's focus on environmental standards, comprehensive industrial modernization programs, and strategic investment in emission control improvement. Japan's established industrial infrastructure and emphasis on environmental compliance are driving demand for specialized VRU technologies focusing on operational precision and regulatory adherence. Industrial operators are investing in comprehensive emission control enhancement to serve both domestic compliance requirements and operational efficiency initiatives.
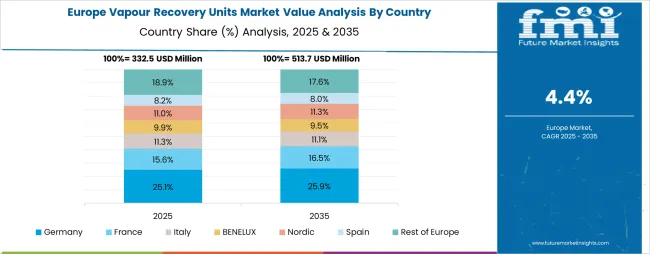
The vapour recovery units market in Europe is projected to grow from USD 0.4 billion in 2025 to USD 0.6 billion by 2035, registering a CAGR of 4.5% over the forecast period. Germany is expected to maintain its leadership position with a 29.2% market share in 2025, increasing to 29.8% by 2035, supported by its advanced industrial infrastructure, comprehensive environmental compliance capabilities, and major chemical processing facilities serving European and international markets.
UK follows with a 26.4% share in 2025, projected to reach 27.1% by 2035, driven by environmental regulation enforcement, industrial modernization programs, and established energy capabilities, but facing challenges from competitive pressures and infrastructure investment constraints. France holds a 18.7% share in 2025, expected to decline to 18.3% by 2035, supported by industrial compliance requirements and environmental development but facing challenges from regulatory adjustments and investment uncertainties.
Italy commands a 12.3% share in 2025, projected to reach 12.5% by 2035, while Netherlands accounts for 9.8% in 2025, expected to reach 9.9% by 2035. The Rest of Europe region, including Nordic countries, Eastern European markets, Spain, and other European countries, is anticipated to gain momentum, expanding its collective share from 3.6% to 3.9% by 2035, attributed to increasing environmental development across Nordic countries and growing industrial modernization across various European markets implementing advanced emission control upgrade programs.
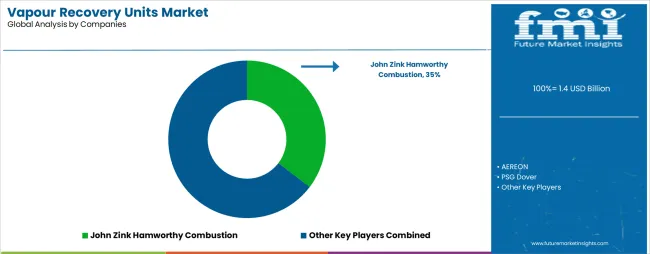
The vapour recovery units market is characterized by competition among established industrial equipment manufacturers, specialized emission control technology providers, and integrated environmental service companies. Companies are investing in advanced separation technology research, smart monitoring development, automation enhancement, and comprehensive VRU portfolios to deliver efficient, reliable, and environmentally-compliant vapour recovery solutions. Innovation in monitoring technology systems, advanced separation technologies, and specialized application capabilities is central to strengthening market position and competitive advantage.
John Zink Hamworthy Combustion leads the market with a strong presence, offering comprehensive emission control and vapour recovery solutions with a focus on industrial applications and advanced engineering capabilities for oil & gas and petrochemical operations. AEREON provides specialized environmental technology portfolios with an emphasis on emission control innovation, operational reliability, and comprehensive service support. PSG Dover delivers integrated fluid handling and emission control solutions with focus on operational efficiency and technological advancement. Cool Sorption A/S specializes in adsorption technologies with emphasis on vapour recovery applications and operational excellence. Hy-Bon/EDI focuses on emission control solutions with advanced recovery capabilities and technical expertise.
| Items | Values |
|---|---|
| Quantitative Units (2025) | USD 1.4 billion |
| Technology | Adsorption, Condensation, Absorption |
| Process | Upstream, Downstream |
| Application | Marine Loading, Truck Loading, Railcar Loading, Pipelines, Storage Tank Vents |
| End-use | Oil & Gas Compressors, Landfills, Brewery and Food Processing, Others |
| Regions Covered | North America, Latin America, Western Europe, Eastern Europe, East Asia, South Asia Pacific, Middle East & Africa |
| Countries Covered | United States, Japan, Germany, India, United Kingdom, France, Italy, Brazil, Canada, South Korea, Australia, Spain, Netherlands, Saudi Arabia, Switzerland, and 30+ countries |
| Key Companies Profiled | John Zink Hamworthy Combustion, AEREON, PSG Dover, Cool Sorption A/S, Hy-Bon/EDI, and others |
| Additional Attributes | Equipment sales by technology and application category, regional demand trends, competitive landscape, technological advancements in separation systems, smart monitoring development, automation innovation, and operational efficiency optimization |
The global vapour recovery units market is estimated to be valued at USD 1.4 billion in 2025.
The market size for the vapour recovery units market is projected to reach USD 2.3 billion by 2035.
The vapour recovery units market is expected to grow at a 5.3% CAGR between 2025 and 2035.
The key product types in vapour recovery units market are adsorption, condensation and absorption.
In terms of application, marine loading segment to command 0.0% share in the vapour recovery units market in 2025.


Our Research Products

The "Full Research Suite" delivers actionable market intel, deep dives on markets or technologies, so clients act faster, cut risk, and unlock growth.

The Leaderboard benchmarks and ranks top vendors, classifying them as Established Leaders, Leading Challengers, or Disruptors & Challengers.

Locates where complements amplify value and substitutes erode it, forecasting net impact by horizon

We deliver granular, decision-grade intel: market sizing, 5-year forecasts, pricing, adoption, usage, revenue, and operational KPIs—plus competitor tracking, regulation, and value chains—across 60 countries broadly.

Spot the shifts before they hit your P&L. We track inflection points, adoption curves, pricing moves, and ecosystem plays to show where demand is heading, why it is changing, and what to do next across high-growth markets and disruptive tech

Real-time reads of user behavior. We track shifting priorities, perceptions of today’s and next-gen services, and provider experience, then pace how fast tech moves from trial to adoption, blending buyer, consumer, and channel inputs with social signals (#WhySwitch, #UX).

Partner with our analyst team to build a custom report designed around your business priorities. From analysing market trends to assessing competitors or crafting bespoke datasets, we tailor insights to your needs.
Supplier Intelligence
Discovery & Profiling
Capacity & Footprint
Performance & Risk
Compliance & Governance
Commercial Readiness
Who Supplies Whom
Scorecards & Shortlists
Playbooks & Docs
Category Intelligence
Definition & Scope
Demand & Use Cases
Cost Drivers
Market Structure
Supply Chain Map
Trade & Policy
Operating Norms
Deliverables
Buyer Intelligence
Account Basics
Spend & Scope
Procurement Model
Vendor Requirements
Terms & Policies
Entry Strategy
Pain Points & Triggers
Outputs
Pricing Analysis
Benchmarks
Trends
Should-Cost
Indexation
Landed Cost
Commercial Terms
Deliverables
Brand Analysis
Positioning & Value Prop
Share & Presence
Customer Evidence
Go-to-Market
Digital & Reputation
Compliance & Trust
KPIs & Gaps
Outputs
Full Research Suite comprises of:
Market outlook & trends analysis
Interviews & case studies
Strategic recommendations
Vendor profiles & capabilities analysis
5-year forecasts
8 regions and 60+ country-level data splits
Market segment data splits
12 months of continuous data updates
DELIVERED AS:
PDF EXCEL ONLINE
Market Share Insights of Vapour Recovery Unit Providers
Vapour Barrier Market Size and Share Forecast Outlook 2025 to 2035
Vapour Blasting Equipment Market Growth - Trends & Forecast 2025 to 2035
Heat Recovery System Generator Market Size and Share Forecast Outlook 2025 to 2035
Heat Recovery Steam Generator Market Growth – Trends & Forecast 2025 to 2035
Dental Units Market Size and Share Forecast Outlook 2025 to 2035
Energy Recovery Ventilator Core Market Growth – Trends & Forecast 2024-2034
Starch Recovery Systems Market Outlook – Growth, Demand & Forecast 2023-2033
Solvent Recovery Systems Market Size and Share Forecast Outlook 2025 to 2035
Global Fitness Recovery Services Market Analysis Size and Share Forecast Outlook 2025 to 2035
Sulphur Recovery Technology Market Analysis - Size, Share, and Forecast Outlook 2025 to 2035
AI-Enhanced Disaster Recovery – Ensuring Business Continuity
Explosive Vapour Detector Market Size and Share Forecast Outlook 2025 to 2035
Flare Gas Recovery System Market Outlook – Share, Growth & Forecast 2025–2035
Demand for Vapour Barrier in EU Size and Share Forecast Outlook 2025 to 2035
Enhanced Oil Recovery Market Size and Share Forecast Outlook 2025 to 2035
Linear Slide Units Market Size and Share Forecast Outlook 2025 to 2035
Heat Therapy Units Market Analysis - Size, Share, and Forecast 2025 to 2035
Handheld GPS Units Market
Vacuum-Refill Units Market Analysis - Size and Share Forecast Outlook 2025 to 2035

Thank you!
You will receive an email from our Business Development Manager. Please be sure to check your SPAM/JUNK folder too.
Chat With
MaRIA