Linear Slide Units Market Outlook (2022 to 2028)

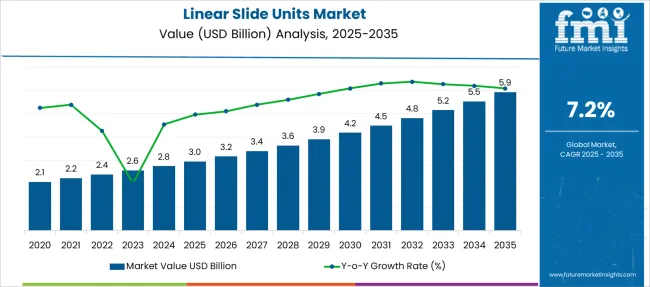
Shipments of linear slide units are set to enjoy Y-o-Y growth of 4.9% in 2022 and attain a market valuation of USD 2.4 Billion. With the market predicted to expand at a CAGR of 7.2% (2022 to 2028), the global linear slide units market is projected to reach USD 3.6 Billion by 2028.

Attribute Details
Linear Slide Units Market Size (2022) USD 2.4 Billion
Predicted Market Revenue (2028) USD 3.6 Billion
Forecasted Growth Rate (2022 to 2028) 7.2% CAGR
Dominant Regional Market Europe – 36.8%

Increasing industrialization and automation are anticipated to propel demand for linear slide units. Linear slide unit sales account for 2% of the global bearings marketplace.

How The Market Progressed Till June 2022?

Market Statistics Details
H1,2021 (A) 6.4%
H1,2022 Projected (P) 6.7%
H1,2022 Outlook (O) 6.9%
BPS Change : H1,2022 (O) - H1,2022 (P) (+) 17 ↑
BPS Change : H1,2022 (O) - H1,2021 (A) (+) 47 ↑

Future Market Insights presents a comparison and review study of the Linear Slide Units market, which are significantly influenced by certain macro-economic factors, along with certain industrial and innovation aspects. The market for linear slide units is expected to be sustained by their efficiency in continuous operations and their adaptation in the end use industries.

According to FMI analysis, the variation between the BPS values observed in the linear slide units market in H1, 2022 - Outlook over H1, 2022 Projected reflects a positive of 17 units. However, compared to H1, 2021, the market is expected to gain 47 BPS based on current estimation for first half 2022. The automobile industry has seen significant shifts in recent years, fueling demand for automation.

The increasing popularity of EVs is transforming the automobile sector, and automakers are striving to maintain their revenue potential, they are opting for automation, which enhances efficiency while also enabling cost-cutting.

Linear slide unit suppliers are also concentrating on producing linear slide units for robotic automation, which is becoming popular in the automobile sector. Manufacturers of linear slide units are also focused on potential in special purpose machine (SPM) production.

Key developments included in the market includes, manufacturers engagements in research and development of new creative products and solutions for technologically advanced automation systems. Linear slide unit providers are also concentrating on mergers and acquisitions to expand their worldwide market presence and optimize revenue possibilities.

Sales Analysis of Linear Slide Units (2013 to 2021) Vs Projected Market Metrics (2022 to 2028)

Linear slide unit shipments increased at a steady CAGR of 5.9% from 2013 to 2021 and ended up with a valuation of USD 2.2 Billion in 2021. Industry 4.0 has become the new norm in the industrial sector and has largely propelled the demand for automation in multiple verticals such as automotive, packaging, etc.

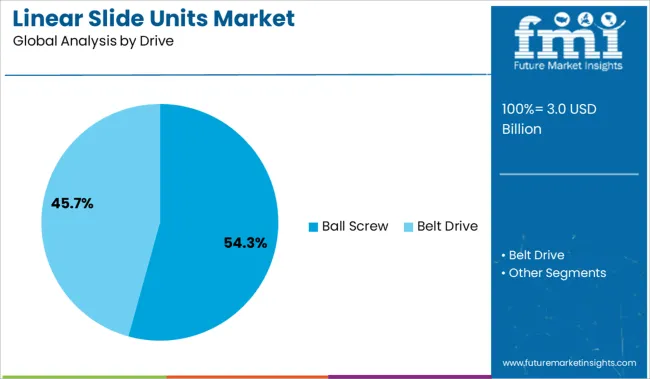
Linear slide unit demand is anticipated to be upheld by their efficiency in continuous operations. Belt drive units are expected to see high preference as they have high speed while being continuously operated.

Rising industrial activity, increasing demand for automation, rising use of robotics, increasing research and development for industrial machinery, and rising technological proliferation in multiple industries are some major factors that influence linear slide units market potential over the forecast period.

Rising availability of substitutes for linear slide units is anticipated to hinder market potential to a certain extent, but this factor is expected to come into play later during the forecast period. The linear slide units market is projected to evolve at a CAGR of 7.2% from 2022 to 2028.

What’s Promoting Demand for Linear Slide Units?

Increasing Demand for Industrial Automation to Boost Sales of Linear Units

Industry 4.0 trend has substantially increased in popularity over the past few years and this is largely influencing multiple industries to increase focus on automation. Automation is anticipated to see a major hike in demand as many companies realize its benefits in productivity and profitability.

Linear slide units are crucial in robotic automation and have proven extremely effective in improving inline operations. These factors are expected to boost linear slide unit shipments through 2029.

For instance, in August 2021, The Timken Company, a leading name in the engineered bearings industry, announced the acquisition of Intelligent Machine Solutions (iMS). With this acquisition, Timken is looking to bolster its Rollon® linear motion product range and other robotic automation solutions to provide customers with a more effective solutions package.

What is the Regional Outlook for Linear Slide Units?

Consumption of Linear Slide Units High in European Region
This research report by FMI analyses the demand for linear slide units across North America, Latin America, Europe, East Asia, South Asia & Pacific, and the Middle East & Africa (MEA).

The North America linear slide units industry, which currently holds a market share of 22.2% in the global landscape, is expected to see steady rise in demand. Increasing adoption of linear slide units in nations such as the USA and Canada is expected to majorly influence market potential in North America.

South Asia and East Asia are anticipated to be highly lucrative markets for linear slide units over the forecast period. Rising industrial activity in these regions is expected to majorly influence linear slide unit consumption. In 2022, East Asia and South Asia account for 18% and 12.5% of the global linear slide units marketplace. Economies like China and India are anticipated to be highly popular markets in these regions.

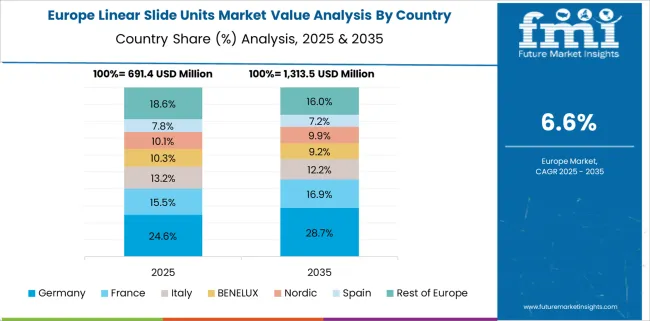
The Europe linear slide units market is holding a dominant share of 36.8% in the global space. Increasing industrialization and the rising popularity of automation in this region are expected to boost shipments of linear slide units through 2028.

Accounting for the least market share of 6% at present, the MEA linear slide units market is expected to provide lucrative opportunities later as industrialization paces in the region.
Country-wise Analysis

How is Demand for Linear Slide Units Anticipated to Shape Up in China?

Rising Popularity of Automation in End-use Industries to Boost Shipments of Linear Slide Units

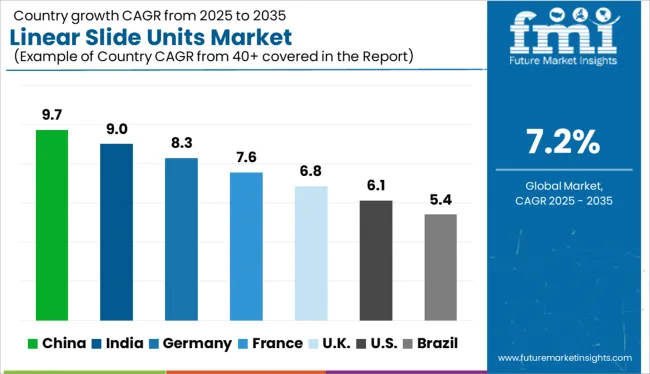
China is anticipated to prove extremely rewarding for linear slide unit vendors owing to the presence of a massive industrial sector. Automation in industries like automotive and machine-building is expected to majorly propel the demand for linear slide units in China. Increasing investments in the manufacturing sector and supportive government initiatives are also expected to guide linear slide unit consumption through 2029.

Will India Be a Lucrative Market for Linear Slide Unit Manufacturers?

Advanced Material Technology to Majorly Influence Linear Slide Units Market Potential

Introduction to advanced material technology has largely influenced linear slide unit demand in India. Through this technology corrosion resistance and higher temperature resistance can be obtained from linear slide units which increases productivity and efficiency of the complete industrial facility. Technological proliferation has increased in India as the nation is subject to rapid urbanization and industrialization on a mass scale.

Increasing investments in automation of multiple facilities in India and the rising popularity of advanced material technology are anticipated to govern the sales of linear slide units in India.

Category-wise Analysis

Which End-use Sector is Expected to See High Adoption of Linear Slide Unit Systems?

Automotive Sector Expected to Exhibit Lucrative Opportunities for Linear Slide Unit Sales

The automotive sector has undergone major transformations over recent years and this has propelled demand for automation in this industry. The automotive industry is being major transformed by the rising popularity of EVs and since automotive manufacturers are struggling to keep up their revenue potential, they are opting for more automation as it improves productivity and also enables cost-cutting.

Linear slide unit vendors are also focusing on developing linear slide units for robotic automation which has seen an increase in application in the automotive industry. Linear slide unit manufacturers also are focusing on opportunities from special purpose machine (SPM) manufacturing.
Competitive Landscape

Linear slide unit manufacturers are investing in the research & development of new innovative products and solutions for technologically advanced automation devices. Linear slide unit vendors are also focusing on mergers and acquisitions to increase their market presence on a global level and maximize revenue potential.

In February 2022, Güdel, a Switzerland-based machine components manufacturer, announced the formation of its new business entity to serve its customers in the United States. The new Güdel Americas is aimed at providing better services to customers in the USA, Mexico, and Canada.

Linear Slide Units Industry Report Scope

Attribute Details
Forecast Period 2022 to 2028
Historical Data Available for 2013 to 2021
Market Analysis Units for Volume, USD Million for Value
Key Regions Covered North America; Latin America; Europe; East Asia; South Asia & Pacific; Middle East & Africa (MEA)
Key Countries Covered United States, Canada, Brazil, Mexico, Germany, UK, France, Spain, Italy, China, Japan, South Korea, India, Indonesia, Malaysia, Singapore, Australia, New Zealand, Turkey, South Africa, and GCC Countries
Key Market Segments Covered Pricing, Drive, Guide, Capacity, Application, End Use, Region
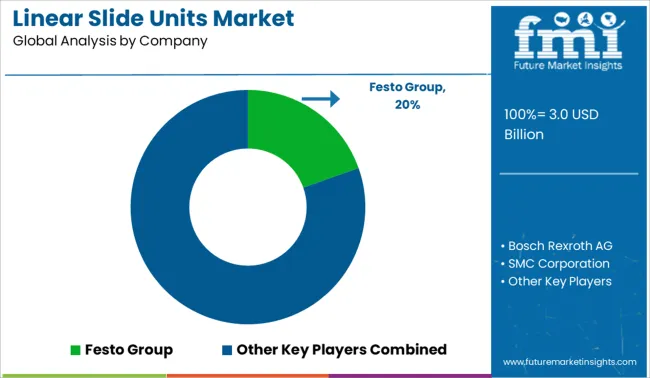
Key Companies Profiled Festo Group; SMC Corporation; THK CO. LTD.; Parker Hannifin; Igus GmbH; Phoenix Mecano AG; SKF Group; Hiwin Corporation; Thomson Industries Inc.; Saiprasad Enterprises
Pricing Available upon Request

Key Segments of Linear Slide Units Industry Survey

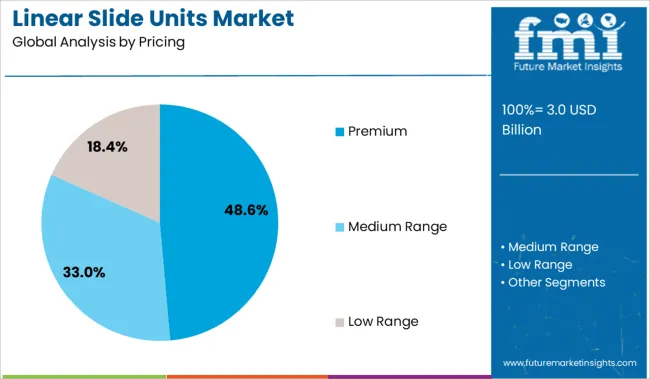
Linear Slide Units Market by Pricing:

  • Premium Linear Slide Units
  • Medium Range Linear Slide Units
  • Low Range Linear Slide Units

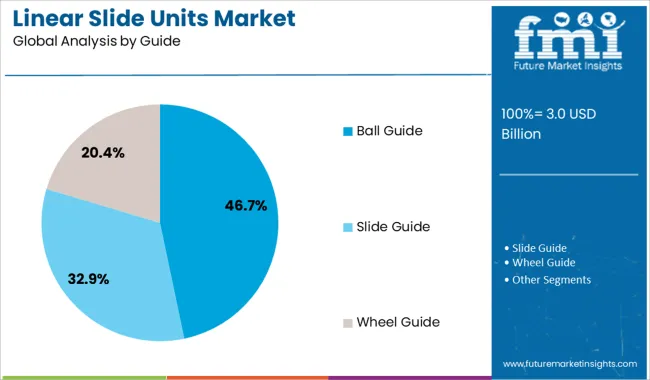
Linear Slide Units Market by Guide:

  • Ball Guide
  • Slide Guide
  • Wheel Guide

Linear Slide Units Market by Capacity:

  • Linear Slide Units Less than 50 Kg
  • Linear Slide Units Between 50 to 100 Kg
  • Linear Slide Units Between 100 to 150 Kg
  • Linear Slide Units Above 150 Kg

Linear Slide Units Market by Drive:

  • Ball Screw
  • Belt Drive

Linear Slide Units Market by Application:

  • Pick & Place
  • Packaging
  • Inline Production

Linear Slide Units Market by End Use:

  • Linear Slide Units for Food & Beverages
  • Linear Slide Units for Packaging
  • Linear Slide Units for Retail & E-commerce
  • Linear Slide Units for Machine Building & SPM
  • Linear Slide Units for Automotive
  • Linear Slide Units for Pharmaceuticals

Linear Slide Units Market by Region:

  • North America Linear Slide Units Market
  • Latin America Linear Slide Units Market
  • Europe Linear Slide Units Market
  • East Asia Linear Slide Units Market
  • South Asia & Pacific Linear Slide Units Market
  • Middle East & Africa (MEA) Linear Slide Units Market

Table of Content

  • 1. Executive Summary
  • 2. Market Introduction
  • 3. Market Background
  • 4. Market Forecast
  • 5. Global Linear Slide Unit Market Analysis 2013 to 2021 and Forecast 2022 to 2028, by Pricing
    • 5.1. Premium
    • 5.2. Medium Range
    • 5.3. Low Range
  • 6. Market Attractiveness Analysis By Pricing Global Linear Slide Unit Market Analysis 2013 to 2021 and Forecast 2022 to 2028, by Drive
    • 6.1. Ball Screw
    • 6.2. Belt Drive
  • 7. Global Linear Slide Unit Market Analysis 2013 to 2021 and Forecast 2022 to 2028, by Guide
    • 7.1. Ball Guide
    • 7.2. Slide Guide
    • 7.3. Wheel Guide
  • 8. Global Linear Slide Unit Market Analysis 2013 to 2021 and Forecast 2022 to 2028, by Capacity
    • 8.1. 8
    • 8.2. Less than 50 Kg
    • 8.3. Between 50 to 100 Kg
    • 8.4. Between 100 to 150 Kg
    • 8.5. Above 150 Kg
  • 9. Global Linear Slide Unit Market Analysis 2013 to 2021 and Forecast 2022 to 2028, by Application
    • 9.1. Pick & Place
    • 9.2. Packaging
    • 9.3. Inline Production
  • 10. Global Linear Slide Unit Market Analysis 2013 to 2021 and Forecast 2022 to 2028, by End Use
    • 10.1. Food & Beverage
    • 10.2. Packaging
    • 10.3. Retail & E-commerce
    • 10.4. Machine Building & SPM
    • 10.5. Automotive
    • 10.6. Pharmaceutical
  • 11. Global Linear Slide Unit Market Analysis 2013 to 2021 and Forecast 2022 to 2028, by Region
    • 11.1. North America
    • 11.2. Europe
    • 11.3. South Asia
    • 11.4. Latin America
    • 11.5. East Asia
    • 11.6. India
    • 11.7. Middle East and Africa (MEA)
  • 12. North America Linear Slide Unit Market Analysis 2013 to 2021 and Forecast 2022 to 2028
  • 13. Latin America Linear Slide Unit Market Analysis 2013 to 2021 and Forecast 2022 to 2028
  • 14. Europe Linear Slide Unit Market Analysis 2013 to 2021 and Forecast 2022 to 2028
  • 15. South Asia Linear Slide Unit Market Analysis 2013 to 2021 and Forecast 2022 to 2028
  • 16. East Asia Linear Slide Unit Market Analysis 2013 to 2021 and Forecast 2022 to 2028
  • 17. India Linear Slide Unit Market Analysis 2013 to 2021 and Forecast 2022 to 2028
  • 18. Middle East and Africa Linear Slide Unit Market Analysis 2013 to 2021 and Forecast 2022 to 2028
  • 19. Competition Analysis
    • 19.1. Festo Group
    • 19.2. Bosch Rexroth AG
    • 19.3. SMC Corporation
    • 19.4. THK CO., LTD.
    • 19.5. Parker Hannifin
    • 19.6. Igus GmbH
    • 19.7. Phoenix Mecano AG
    • 19.8. SKF Group
    • 19.9. Hiwin Corporation
    • 19.10. Thomson Industries, Inc.
    • 19.11. Saiprasad Enterprises
  • 20. Assumptions and Acronyms Used
  • 21. Research Methodology

List of Tables

Table 01: Global Market Volume (Units) & Value (US$ Mn.) Forecast by Pricing, 2013 – 2028

Table 02: Global Market Volume (Units) & Value (US$ Mn.) Forecast by Drive Type, 2013 – 2028

Table 03: Global Market Volume (Units) & Value (US$ Mn) Forecast by Guide, 2013 – 2028

Table 04: Global Market Volume (Units) & Value (US$ Mn) Forecast by Capacity Type, 2013 – 2028

Table 05: Global Market Volume (Units) & Value (US$ Mn) Forecast by Application, 2013 – 2028

Table 06: Global Market Volume (Units) Forecast by End Use, 2013 – 2028

Table 07: Global Market Value (US$ Mn) Forecast by End Use, 2013 – 2028

Table 08: Global Market Volume (Units) Forecast by Region, 2013 – 2028

Table 09: Global Market Value (US$ Mn) Forecast by Region, 2013 – 2028

Table 10: North America Market Value (US$ Mn) Forecast by Country, 2013 – 2028

Table 11: North America Market Volume (Units) & Value (US$ Mn.) Forecast by Pricing, 2013 – 2028

Table 12: North America Market Volume (Units) & Value (US$ Mn.) Forecast by Drive Type, 2013 – 2028

Table 13: North America Market Volume (Units) & Value (US$ Mn) Forecast by Guide, 2013 – 2028

Table 14: North America Market Volume (Units) & Value (US$ Mn) Forecast by Capacity Type, 2013 – 2028

Table 15: North America Market Volume (Units) & Value (US$ Mn) Forecast by Application, 2013 – 2028

Table 16: North America Market Volume (Units) Forecast by End Use, 2013 – 2028

Table 17: North America Market Value (US$ Mn) Forecast by End Use, 2013 – 2028

Table 18: Latin America Market Value (US$ Mn) Forecast by Country, 2013 – 2028

Table 19: Latin America Market Volume (Units) & Value (US$ Mn.) Forecast by Pricing, 2013 – 2028

Table 20: Latin America Market Volume (Units) & Value (US$ Mn.) Forecast by Drive Type, 2013 – 2028

Table 21: Latin America Market Volume (Units) & Value (US$ Mn) Forecast by Guide, 2013 – 2028

Table 22: Latin America Market Volume (Units) & Value (US$ Mn) Forecast by Capacity Type, 2013 – 2028

Table 23: Latin America Market Volume (Units) & Value (US$ Mn) Forecast by Application, 2013 – 2028

Table 24: Latin America Market Volume (Units) Forecast by End Use, 2013 – 2028

Table 25: Latin America Market Value (US$ Mn) Forecast by End Use, 2013 – 2028

Table 26: Europe Market Volume (Units) Forecast by Country, 2013 – 2028

Table 27: Europe Market Value (US$ Mn) Forecast by Country, 2013 – 2028

Table 28: Europe Market Volume (Units) & Value (US$ Mn.) Forecast by Pricing, 2013 – 2028

Table 29: Europe Market Volume (Units) & Value (US$ Mn.) Forecast by Drive Type, 2013 – 2028

Table 30: Europe Market Volume (Units) & Value (US$ Mn) Forecast by Guide, 2013 – 2028

Table 31: Europe Market Volume (Units) & Value (US$ Mn) Forecast by Capacity Type, 2013 – 2028

Table 32: Europe Market Volume (Units) & Value (US$ Mn) Forecast by Application, 2013 – 2028

Table 33: Europe Market Volume (Units) Forecast by End Use, 2013 – 2028

Table 34: Europe Market Value (US$ Mn) Forecast by End Use, 2013 – 2028

Table 35: South Asia Market Volume (Units) Forecast by Country, 2013 – 2028

Table 36: South Asia Market Value (US$ Mn) Forecast by Country, 2013 – 2028

Table 37: South Asia Market Volume (Units) & Value (US$ Mn.) Forecast by Pricing, 2013 – 2028

Table 38: South Asia Market Volume (Units) & Value (US$ Mn.) Forecast by Drive Type, 2013 – 2028

Table 39: South Asia Market Volume (Units) & Value (US$ Mn) Forecast by Guide, 2013 – 2028

Table 40: South Asia Market Volume (Units) & Value (US$ Mn) Forecast by Capacity Type, 2013 – 2028

Table 41: South Asia Market Volume (Units) & Value (US$ Mn) Forecast by Application, 2013 – 2028

Table 42: South Asia Market Volume (Units) Forecast by End Use, 2013 – 2028

Table 43: South Asia Market Value (US$ Mn) Forecast by End Use, 2013 – 2028

Table 44: East Asia Market Volume (Units) Forecast by Country, 2013 – 2028

Table 45: East Asia Market Value (US$ Mn) Forecast by Country, 2013 – 2028

Table 46: East Asia Market Volume (Units) & Value (US$ Mn.) Forecast by Pricing, 2013 – 2028

Table 47: East Asia Market Volume (Units) & Value (US$ Mn.) Forecast by Drive Type, 2013 – 2028

Table 48: East Asia Market Volume (Units) & Value (US$ Mn) Forecast by Guide, 2013 – 2028

Table 49: East Asia Market Volume (Units) & Value (US$ Mn) Forecast by Capacity Type, 2013 – 2028

Table 50: East Asia Market Volume (Units) & Value (US$ Mn) Forecast by Application, 2013 – 2028

Table 51: East Asia Market Volume (Units) Forecast by End Use, 2013 – 2028

Table 52: East Asia Market Value (US$ Mn) Forecast by End Use, 2013 – 2028

Table 53: India Market Volume (Units) & Value (US$ Mn.) Forecast by Pricing, 2013 – 2028

Table 54: India Market Volume (Units) & Value (US$ Mn.) Forecast by Drive Type, 2013 – 2028

Table 55: India Market Volume (Units) & Value (US$ Mn) Forecast by Guide, 2013 – 2028

Table 56: India Market Volume (Units) & Value (US$ Mn) Forecast by Capacity Type, 2013 – 2028

Table 57: India Market Volume (Units) & Value (US$ Mn) Forecast by Application, 2013 – 2028

Table 58: India Market Volume (Units) Forecast by End Use, 2013 – 2028

Table 59: India Market Value (US$ Mn) Forecast by End Use, 2013 – 2028

Table 60: MEA Market Volume (Units) Forecast by Country, 2013 – 2028

Table 61: MEA Market Value (US$ Mn) Forecast by Country, 2013 – 2028

Table 62: MEA Market Volume (Units) & Value (US$ Mn.) Forecast by Pricing, 2013 – 2028

Table 63: MEA Market Volume (Units) & Value (US$ Mn.) Forecast by Drive Type, 2013 – 2028

Table 64: MEA Market Volume (Units) & Value (US$ Mn) Forecast by Guide, 2013 – 2028

Table 65: MEA Market Volume (Units) & Value (US$ Mn) Forecast by Capacity Type, 2013 – 2028

Table 66: MEA Market Volume (Units) & Value (US$ Mn) Forecast by Application, 2013 – 2028

Table 67: MEA Market Volume (Units) Forecast by End Use, 2013 – 2028

Table 68: MEA Market Value (US$ Mn) Forecast by End Use, 2013 – 2028

List of Figures

Figure 01: Global Linear Slide Units Market Historical Volume (Units), 2013 – 2021

Figure 02: Global Linear Slide Units Market Volume (Units) Forecast, 2022 – 2028

Figure 03: Global Linear Slide Units Market Value (US$ Mn) Forecast, 2013 – 2028

Figure 04: Global Linear Slide Units Market Absolute US$ Opportunity, 2013 – 2028

Figure 05: Global Market Share and BPS Analysis by Pricing – 2022 & 2028

Figure 06: Global Market Y-o-Y Growth by Pricing, 2022 – 2028

Figure 07: Global Linear Slide Units Market Attractiveness by Pricing, 2022-2028

Figure 08: Global Linear Slide Units Market Absolute US$ Opportunity by Premium Range, 2013 – 2028

Figure 09: Global Linear Slide Units Market Absolute US$ Opportunity by Medium Range, 2013 – 2028

Figure 10: Global Linear Slide Units Market Absolute US$ Opportunity by Low Range, 2013 – 2028

Figure 11: Global Market Share and BPS Analysis by Drive Type– 2022 & 2028

Figure 12: Global Market Y-o-Y Growth by Drive Type, 2022 – 2028

Figure 13: Global Linear Slide Units Market Attractiveness by Drive Type, 2022-2028

Figure 14: Global Linear Slide Units Market Absolute US$ Opportunity by Ball Screw, 2013 – 2028

Figure 15: Global Linear Slide Units Market Absolute US$ Opportunity by Belt Drive, 2013 – 2028

Figure 16: Global Market Share and BPS Analysis by Guide– 2022 & 2028

Figure 17: Global Market Y-o-Y Growth by Guide, 2022 – 2028

Figure 18: Global Linear Slide Units Market Attractiveness by Guide, 2022-2028

Figure 19: Global Linear Slide Units Market Absolute US$ Opportunity by Ball Guide, 2013 – 2028

Figure 20: Global Linear Slide Units Market Absolute US$ Opportunity by Slide Guide, 2013 – 2028

Figure 21: Global Linear Slide Units Market Absolute US$ Opportunity by Wheel Guides, 2013 – 2028

Figure 22: Global Market Share and BPS Analysis by Capacity– 2022 & 2028

Figure 23: Global Market Y-o-Y Growth by Capacity, 2022 – 2028

Figure 24: Global Linear Slide Units Market Attractiveness by Capacity, 2022-2028

Figure 25: Global Linear Slide Units Market Absolute US$ Opportunity by less than 50 Kg, 2013 – 2028

Figure 26: Global Linear Slide Units Market Absolute US$ Opportunity by Between 50-100 Kg, 2013 – 2028

Figure 27: Global Linear Slide Units Market Absolute US$ Opportunity by Below 100-150 Kg, 2013 – 2028

Figure 28: Global Linear Slide Units Market Absolute US$ Opportunity by Above 150 Kg, 2013 – 2028

Figure 29: Global Market Share and BPS Analysis by Application– 2022 & 2028

Figure 30: Global Market Y-o-Y Growth by Application, 2022 – 2028

Figure 31: Global Linear Slide Units Market Attractiveness by Application, 2022-2028

Figure 32: Global Linear Slide Units Market Absolute US$ Opportunity by Pick and Place, 2013 – 2028

Figure 33: Global Linear Slide Units Market Absolute US$ Opportunity by Packaging, 2013 – 2028

Figure 34: Global Linear Slide Units Market Absolute US$ Opportunity by Inline Production, 2013 – 2028

Figure 35: Global Market Share and BPS Analysis by End-Use– 2022 & 2028

Figure 36: Global Market Y-o-Y Growth by End Use, 2022 – 2028

Figure 37: Global Linear Slide Units Market Attractiveness by End Use, 2022-2028

Figure 38: Global Linear Slide Units Market Absolute US$ Opportunity by Food & Beverages Segment, 2013 – 2028

Figure 39: Global Linear Slide Units Market Absolute US$ Opportunity by Packaging Segment, 2013 – 2028

Figure 40: Global Linear Slide Units Market Absolute US$ Opportunity by Retail & E-Commerce Segment, 2013 – 2028

Figure 41: Global Linear Slide Units Market Absolute US$ Opportunity by Machine Building & SPM Segment, 2013 – 2028

Figure 42: Global Linear Slide Units Market Absolute US$ Opportunity by Automotive Segment, 2013 – 2028

Figure 43: Global Linear Slide Units Market Absolute US$ Opportunity by Pharmaceutical Segment, 2013 – 2028

Figure 44: Global Market Split (Value) by Region, 2017A

Figure 45: Global Market Split (Value) by Region, 2028E

Figure 46: Global Market Share and BPS Analysis by Region– 2013, 2022 & 2028

Figure 47: Global Market Y-o-Y Growth by Region, 2022 – 2028

Figure 48: Global Market Attractiveness by Region, 2022 – 2028

Figure 49: North America Market Absolute $ Opportunity, 2013 to 2021 and 2028

Figure 50: Latin America Market Absolute $ Opportunity, 2013 to 2021 and 2028

Figure 51: Europe Market Absolute $ Opportunity, 2013 to 2021 and 2028

Figure 52: South Asia & East Asia Market Absolute $ Opportunity, 2013 to 2021 and 2028

Figure 53: India Market Absolute $ Opportunity, 2013 to 2021 and 2028

Figure 54: MEA Market Absolute $ Opportunity, 2013 to 2021 and 2028

Figure 55: North America Market Share and BPS Analysis by Country– 2013, 2022 & 2028

Figure 56: North America Market Y-o-Y Growth by Country, 2022 – 2028

Figure 57: North America Market Attractiveness by Country, 2022 – 2028

Figure 58: U.S.A Market Absolute $ Opportunity, 2013 to 2021 and 2028

Figure 59: Canada Market Absolute $ Opportunity, 2013 to 2021 and 2028

Figure 60: North America Market Share and BPS Analysis by Pricing – 2022 & 2028

Figure 61: North America Market Y-o-Y Growth by Pricing, 2022 – 2028

Figure 62: North America Linear Slide Units Market Attractiveness by Pricing, 2022-2028

Figure 63: North America Market Share and BPS Analysis by Drive Type– 2022 & 2028

Figure 64: North America Market Y-o-Y Growth by Drive Type, 2022 – 2028

Figure 65: North America Linear Slide Units Market Attractiveness by Drive Type, 2022-2028

Figure 66: North America Market Share and BPS Analysis by Guide– 2022 & 2028

Figure 67: North America Market Y-o-Y Growth by Guide, 2022 – 2028

Figure 68: North America Linear Slide Units Market Attractiveness by Guide, 2022-2028

Figure 69: North America Market Share and BPS Analysis by Capacity– 2022 & 2028

Figure 70: North America Market Y-o-Y Growth by Capacity, 2022 – 2028

Figure 71: North America Linear Slide Units Market Attractiveness by Capacity, 2022-2028

Figure 72: North America Market Share and BPS Analysis by Application– 2022 & 2028

Figure 73: North America Market Y-o-Y Growth by Application, 2022 – 2028

Figure 74: North America Linear Slide Units Market Attractiveness by Application, 2022-2028

Figure 75: North America Market Share and BPS Analysis by End-Use– 2022 & 2028

Figure 76: North America Market Y-o-Y Growth by End Use, 2022 – 2028

Figure 77: North America Linear Slide Units Market Attractiveness by End Use, 2022-2028

Figure 78: Latin America Market Share and BPS Analysis by Country– 2013, 2022 & 2028

Figure 79: Latin America Market Y-o-Y Growth by Country, 2022 – 2028

Figure 80: Latin America Market Attractiveness by Country, 2022 – 2028

Figure 81: Mexico Market Absolute $ Opportunity, 2013 to 2021 and 2028

Figure 82: Brazil Market Absolute $ Opportunity, 2013 to 2021 and 2028

Figure 83: Rest of Latin America Market Absolute $ Opportunity, 2013 to 2021 and 2028

Figure 84: Latin America Market Share and BPS Analysis by Pricing – 2022 & 2028

Figure 85: Latin America Market Y-o-Y Growth by Pricing, 2022 – 2028

Figure 86: Latin America Linear Slide Units Market Attractiveness by Pricing, 2022-2028

Figure 87: Latin America Market Share and BPS Analysis by Drive Type– 2022 & 2028

Figure 88: Latin America Market Y-o-Y Growth by Drive Type, 2022 – 2028

Figure 89: Latin America Linear Slide Units Market Attractiveness by Drive Type, 2022-2028

Figure 90: Latin America Market Share and BPS Analysis by Guide– 2022 & 2028

Figure 91: Latin America Market Y-o-Y Growth by Guide, 2022 – 2028

Figure 92: Latin America Linear Slide Units Market Attractiveness by Guide, 2022-2028

Figure 93: Latin America Market Share and BPS Analysis by Capacity– 2022 & 2028

Figure 94: Latin America Market Y-o-Y Growth by Capacity, 2022 – 2028

Figure 95: Latin America Linear Slide Units Market Attractiveness by Capacity, 2022-2028

Figure 96: Latin America Market Share and BPS Analysis by Application– 2022 & 2028

Figure 97: Latin America Market Y-o-Y Growth by Application, 2022 – 2028

Figure 98: Latin America Linear Slide Units Market Attractiveness by Application, 2022-2028

Figure 99: Latin America Market Share and BPS Analysis by End-Use– 2022 & 2028

Figure 100: Latin America Market Y-o-Y Growth by End Use, 2022 – 2028

Figure 101: Latin America Linear Slide Units Market Attractiveness by End Use, 2022-2028

Figure 102: Europe Market Share and BPS Analysis by Country– 2013, 2022 & 2028

Figure 103: Europe Market Y-o-Y Growth by Country, 2022 – 2028

Figure 104: Europe Market Attractiveness by Country, 2022 – 2028

Figure 105: U.K. Market Absolute $ Opportunity, 2013 to 2021 and 2028

Figure 106: Germany Market Absolute $ Opportunity, 2013 to 2021 and 2028

Figure 107: France Market Absolute $ Opportunity, 2013 to 2021 and 2028

Figure 108: Italy Market Absolute $ Opportunity, 2013 to 2021 and 2028

Figure 109: Spain Market Absolute $ Opportunity, 2013 to 2021 and 2028

Figure 110: Russia Market Absolute $ Opportunity, 2013 to 2021 and 2028

Figure 111: Rest of Europe Market Absolute $ Opportunity, 2013 to 2021 and 2028

Figure 112: Europe Market Share and BPS Analysis by Pricing – 2022 & 2028

Figure 113: Europe Market Y-o-Y Growth by Pricing, 2022 – 2028

Figure 114: Europe Linear Slide Units Market Attractiveness by Pricing, 2022-2028

Figure 115: Europe Market Share and BPS Analysis by Drive Type– 2022 & 2028

Figure 116: Europe Market Y-o-Y Growth by Drive Type, 2022 – 2028

Figure 117: Europe Linear Slide Units Market Attractiveness by Drive Type, 2022-2028

Figure 118: Europe Market Share and BPS Analysis by Guide– 2022 & 2028

Figure 119: Europe Market Y-o-Y Growth by Guide, 2022 – 2028

Figure 120: Europe Linear Slide Units Market Attractiveness by Guide, 2022-2028

Figure 121: Europe Market Share and BPS Analysis by Capacity– 2022 & 2028

Figure 122: Europe Market Y-o-Y Growth by Capacity, 2022 – 2028

Figure 123: Europe Linear Slide Units Market Attractiveness by Capacity, 2022-2028

Figure 124: Europe Market Share and BPS Analysis by Application– 2022 & 2028

Figure 125: Europe Market Y-o-Y Growth by Application, 2022 – 2028

Figure 126: Europe Linear Slide Units Market Attractiveness by Application, 2022-2028

Figure 127: Europe Market Share and BPS Analysis by End-Use– 2022 & 2028

Figure 128: Europe Market Y-o-Y Growth by End Use, 2022 – 2028

Figure 129: Europe Linear Slide Units Market Attractiveness by End Use, 2022-2028

Figure 130: South Asia Market Share and BPS Analysis by Country– 2013, 2022 & 2028

Figure 131: South Asia Market Y-o-Y Growth by Country, 2022 – 2028

Figure 132: South Asia Market Attractiveness by Country, 2022 – 2028

Figure 133: ASEAN Market Absolute $ Opportunity, 2013 to 2021 and 2028

Figure 134: Oceania Market Absolute $ Opportunity, 2013 to 2021 and 2028

Figure 135: Rest of South Asia Market Absolute $ Opportunity, 2013 to 2021 and 2028

Figure 136: South Asia Market Share and BPS Analysis by Pricing – 2022 & 2028

Figure 137: South Asia Market Y-o-Y Growth by Pricing, 2022 – 2028

Figure 138: South Asia Linear Slide Units Market Attractiveness by Pricing, 2022-2028

Figure 139: South Asia Market Share and BPS Analysis by Drive Type– 2022 & 2028

Figure 140: South Asia Market Y-o-Y Growth by Drive Type, 2022 – 2028

Figure 141: South Asia Linear Slide Units Market Attractiveness by Drive Type, 2022-2028

Figure 142: South Asia Market Share and BPS Analysis by Guide– 2022 & 2028

Figure 143: South Asia Market Y-o-Y Growth by Guide, 2022 – 2028

Figure 144: South Asia Linear Slide Units Market Attractiveness by Guide, 2022-2028

Figure 145: South Asia Market Share and BPS Analysis by Capacity– 2022 & 2028

Figure 146: South Asia Market Y-o-Y Growth by Capacity, 2022 – 2028

Figure 147: South Asia Linear Slide Units Market Attractiveness by Capacity, 2022-2028

Figure 148: South Asia Market Share and BPS Analysis by Application– 2022 & 2028

Figure 149: South Asia Market Y-o-Y Growth by Application, 2022 – 2028

Figure 150: South Asia Linear Slide Units Market Attractiveness by Application, 2022-2028

Figure 151: South Asia Market Share and BPS Analysis by End-Use– 2022 & 2028

Figure 152: South Asia Market Y-o-Y Growth by End Use, 2022 – 2028

Figure 153: South Asia Linear Slide Units Market Attractiveness by End Use, 2022-2028

Figure 154: East Asia Market Share and BPS Analysis by Country– 2013, 2022 & 2028

Figure 155: East Asia Market Y-o-Y Growth by Country, 2022 – 2028

Figure 156: East Asia Market Attractiveness by Country, 2022 – 2028

Figure 157: China Market Absolute $ Opportunity, 2013 to 2021 and 2028

Figure 158: Japan Market Absolute $ Opportunity, 2013 to 2021 and 2028

Figure 159: South Korea Market Absolute $ Opportunity, 2013 to 2021 and 2028

Figure 160: East Asia Market Share and BPS Analysis by Pricing – 2022 & 2028

Figure 161: East Asia Market Y-o-Y Growth by Pricing, 2022 – 2028

Figure 162: East Asia Linear Slide Units Market Attractiveness by Pricing, 2022-2028

Figure 163: East Asia Market Share and BPS Analysis by Drive Type– 2022 & 2028

Figure 164: East Asia Market Y-o-Y Growth by Drive Type, 2022 – 2028

Figure 165: East Asia Linear Slide Units Market Attractiveness by Drive Type, 2022-2028

Figure 166: East Asia Market Share and BPS Analysis by Guide– 2022 & 2028

Figure 167: East Asia Market Y-o-Y Growth by Guide, 2022 – 2028

Figure 168: East Asia Linear Slide Units Market Attractiveness by Guide, 2022-2028

Figure 169: East Asia Market Share and BPS Analysis by Capacity– 2022 & 2028

Figure 170: East Asia Market Y-o-Y Growth by Capacity, 2022 – 2028

Figure 171: East Asia Linear Slide Units Market Attractiveness by Capacity, 2022-2028

Figure 172: East Asia Market Share and BPS Analysis by Application– 2022 & 2028

Figure 173: East Asia Market Y-o-Y Growth by Application, 2022 – 2028

Figure 174: East Asia Linear Slide Units Market Attractiveness by Application, 2022-2028

Figure 175: East Asia Market Share and BPS Analysis by End-Use– 2022 & 2028

Figure 176: East Asia Market Y-o-Y Growth by End Use, 2022 – 2028

Figure 177: East Asia Linear Slide Units Market Attractiveness by End Use, 2022-2028

Figure 178: India Market Share and BPS Analysis by Pricing – 2022 & 2028

Figure 179: India Market Y-o-Y Growth by Pricing, 2022 – 2028

Figure 180: India Linear Slide Units Market Attractiveness by Pricing, 2022-2028

Figure 181: India Market Share and BPS Analysis by Drive Type– 2022 & 2028

Figure 182: India Market Y-o-Y Growth by Drive Type, 2022 – 2028

Figure 183: India Linear Slide Units Market Attractiveness by Drive Type, 2022-2028

Figure 184: India Market Share and BPS Analysis by Guide– 2022 & 2028

Figure 185: India Market Y-o-Y Growth by Guide, 2022 – 2028

Figure 186: India Linear Slide Units Market Attractiveness by Guide, 2022-2028

Figure 187: India Market Share and BPS Analysis by Capacity– 2022 & 2028

Figure 188: India Market Y-o-Y Growth by Capacity, 2022 – 2028

Figure 189: India Linear Slide Units Market Attractiveness by Capacity, 2022-2028

Figure 190: India Market Share and BPS Analysis by Application– 2022 & 2028

Figure 191: India Market Y-o-Y Growth by Application, 2022 – 2028

Figure 192: India Linear Slide Units Market Attractiveness by Application, 2022-2028

Figure 193: India Market Share and BPS Analysis by End-Use– 2022 & 2028

Figure 194: India Market Y-o-Y Growth by End Use, 2022 – 2028

Figure 195: India Linear Slide Units Market Attractiveness by End Use, 2022-2028

Figure 196: MEA Market Share and BPS Analysis by Country– 2013, 2022 & 2028

Figure 197: MEA Market Y-o-Y Growth by Country, 2022 – 2028

Figure 198: MEA Market Attractiveness by Country, 2022 – 2028

Figure 199: GCC Countries Market Absolute $ Opportunity, 2013 to 2021 and 2028

Figure 200: Northern Africa Market Absolute $ Opportunity, 2013 to 2021 and 2028

Figure 201: Turkey Market Absolute $ Opportunity, 2013 to 2021 and 2028

Figure 202: South Africa Market Absolute $ Opportunity, 2013 to 2021 and 2028

Figure 203: Rest of MEA Market Absolute $ Opportunity, 2013 to 2021 and 2028

Figure 204: MEA Market Share and BPS Analysis by Pricing – 2022 & 2028

Figure 205: MEA Market Y-o-Y Growth by Pricing, 2022 – 2028

Figure 206: MEA Linear Slide Units Market Attractiveness by Pricing, 2022-2028

Figure 207: MEA Market Share and BPS Analysis by Drive Type– 2022 & 2028

Figure 208: MEA Market Y-o-Y Growth by Drive Type, 2022 – 2028

Figure 209: MEA Linear Slide Units Market Attractiveness by Drive Type, 2022-2028

Figure 210: MEA Market Share and BPS Analysis by Guide– 2022 & 2028

Figure 211: MEA Market Y-o-Y Growth by Guide, 2022 – 2028

Figure 212: MEA Linear Slide Units Market Attractiveness by Guide, 2022-2028

Figure 213: MEA Market Share and BPS Analysis by Capacity– 2022 & 2028

Figure 214: MEA Market Y-o-Y Growth by Capacity, 2022 – 2028

Figure 215: MEA Linear Slide Units Market Attractiveness by Capacity, 2022-2028

Figure 216: MEA Market Share and BPS Analysis by Application– 2022 & 2028

Figure 217: MEA Market Y-o-Y Growth by Application, 2022 – 2028

Figure 218: MEA Linear Slide Units Market Attractiveness by Application, 2022-2028

Figure 219: MEA Market Share and BPS Analysis by End-Use– 2022 & 2028

Figure 220: MEA Market Y-o-Y Growth by End Use, 2022 – 2028

Figure 221: MEA Linear Slide Units Market Attractiveness by End Use, 2022-2028

Frequently Asked Questions

How much is the linear slide units market worth in 2022?

In 2022, the global linear slide units market stands at a net valuation of USD 2.4 Billion.

What is the forecasted size of the linear slide units market?

By 2028, the global linear slide units market is expected to reach USD 3.6 Billion.

Who are the key companies in the linear slide units market?

Festo Group, SMC Corporation, THK CO. LTD., Parker Hannifin, Igus GmbH, Phoenix Mecano AG, and SKF Group are key manufacturers of linear slide units.

What factors are propelling linear slide units market growth?

Rising industrialization and increasing popularity of automation are expected to majorly sculpt linear slide units market potential.

At what CAGR is the linear slide units market expected to develop?

Demand for linear slide units is anticipated to rise at a CAGR of 7.2% from 2022 to 2028.

Explore Similar Insights

Future Market Insights

Linear Slide Units Market