Linear Net Weighing Machines Market Overview (2022 to 2032)

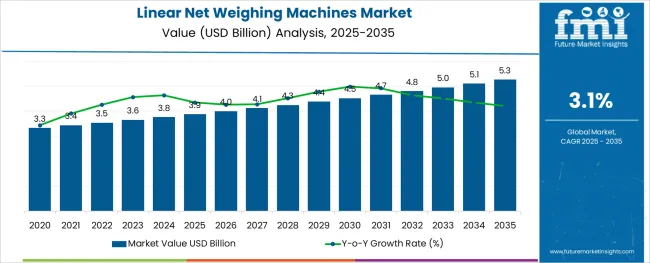
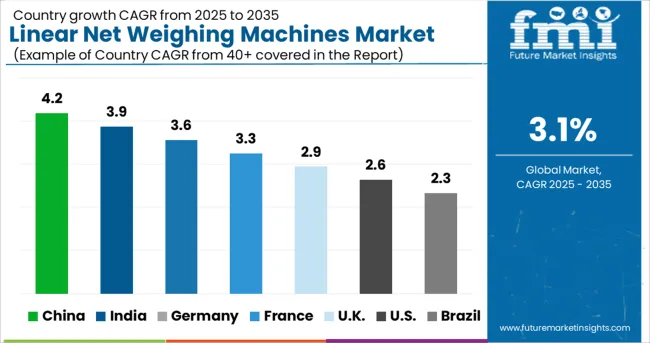
The linear net weighing machines market is likely to record an average CAGR of 3.1% during the forecast period. The linear net weighing machines market is currently valued at US$ 3.54 Billion and is likely to reach US$ 4.74 Billion by 2032.

Attributes Details
Linear Net Weighing Machines Market CAGR (2022 to 2032) 3.1%
Linear Net Weighing Machines Market Value (2022) US$ 3,54 Billion
Linear Net Weighing Machines Market Value (2032) US$ 4.74 Billion

Linear net weighing machines are used to speed up the handling process with the accurate weighing of free-flowing products with their fast and precise functions due to their compact design and easy functionality that enables them to be used in small spaces with better durability to ensure long operational life. These factors give a push to the sales of linear net weighing machines.

Demand for linear net weighing machines also increases due to factors like low maintenance, easy cleaning, and accurate and precise weighing. Machines are used in multiple industries like Food, Pharmaceuticals, Cosmetics & Personal Care, and Chemicals & Fertilizers, diversifying the sales of linear net weighing machines.

What are the Key Drivers and Restraints of the Linear Net Weighing Machines Market?

Linear net weighing machines are considered an important weighing solution in the food, pharmaceutical, chemical, fertilizer & other end-use industries. This is primarily due to the accurate weighing solution offered by these machines for multiple end-use products.

These machines are suitable for the weighing of food items such as grains & seeds, tea & coffee, dairy products, etc., as these products are sold in different pack sizes in retail. This gives a push to the sales of linear net weighing machines.

The robust growth rate of the food industry across the globe is expected to create significant demand for linear net weighing machines in the coming years. Linear net weighing machines are very efficient and can be used for high production outputs, this factor raising its acceptance in the FMCG industry and fueling its growth in the demand for linear net weighing machines.

Also, the increasing popularity of linear net weighing machines in industries such as Pharmaceuticals, chemicals & fertilizers, etc., is likely to drive its growth throughout the forecast period.

With the advent of the latest technological developments, linear net weighing machines have become inexpensive and technically robust, which and likely to attain significant traction in coming years, increasing the sales of linear net weighing machines. Thus, the global linear net weighing machines market is expected to witness notable growth prospects during the forecast period.

Don't pay for what you don't need

Customize your report by selecting specific countries or regions and save 30%!

Which Region is the Biggest for Linear Net Weighing Machines Market?

East & South Asia are expected to be highly attractive regions for the growth of the linear net weighing machines market due to the high growth rate of end-use industries. Continuous expansion of food, pharmaceuticals, chemicals & fertilizers in East & South Asia is expected to create significant demand for linear net weighing machines during the forecast period.

China in East Asia and India in South Asia is expected to remain at the forefront regarding linear net weighing market share throughout the forecast period. The Europe region is a substantial shareholder of the linear net weighing machines market and is likely to expand with a moderate growth rate during the forecast period.

It is attributed to the increasing acceptance of linear net weighing machines in various end-use industries. North America is projected to register a healthy growth rate in the linear net weighing machines market during the forecast period. In North America, the US is highly attractive in terms of market share, while Canada is highly attractive regarding the growth rate of the linear net weighing machines market.
How’s the Competitive Landscape in Linear Net Weighing Machines Market?

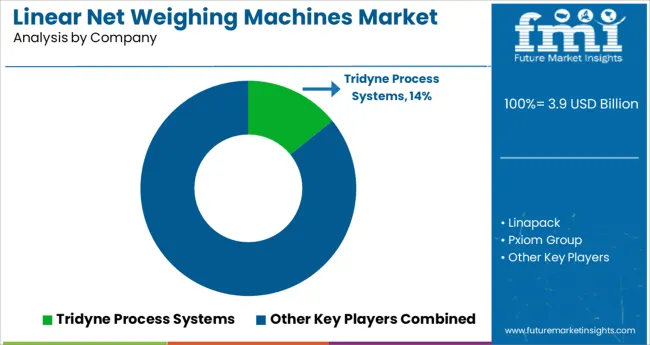
The key players in the Linear net weighing machines market are focusing on. The competitors also focus on factors like product launches, and partnerships for better access to distribution channels. Companies also work on an optimized design that drives the demand for linear net weighing machines business. This drives the sales of linear net weighing machines.

Key players in the linear net weighing machines market include Tridyne Process Systems, Linapack, Pxiom Group, Coastal Counting & Industrial Scales Inc, Unitech, and Zhongshan Multiweigh Packaging Machinery Co Ltd

Recent Market Development:

  • Tridyne process systems have launched new types of linear net weighing machines that hold new advanced processes and are more dependable, increasing the sales of linear net weighing machines.
  • Unitech Filling System has upgraded the process and functioning and has introduced a new series of linear net weighing machines, increasing the sales of linear net weighing machines into a new market.
Ismail Sutaria
Ismail Sutaria

Principal Consultant

Talk to Analyst

Find your sweet spots for generating winning opportunities in this market.

Report Scope

Report Attribute Details
Growth Rate CAGR of 3.1% from 2022 to 2032
The base year for estimation 2021
Historical data 2015 to 2020
Forecast period 2022 to 2032
Quantitative units Revenue in USD Million and CAGR from 2022 to 2032
Report Coverage Revenue forecast, volume forecast, company ranking, competitive landscape, growth factors, and trends, Pricing Analysis,
Segments Covered Automation Type, Number of Heads, Weighing Range, End-Use
Regional scope North America; Western Europe, Eastern Europe, Middle East, Africa, ASEAN, South Asia, Rest of Asia, Australia, and New Zealand
Country scope United States of America; Canada; Mexico; Germany; United Kingdom; France; Italy; Spain; Russia; Belgium; Poland; Czech Republic; China; India; Japan; Australia; Brazil; Argentina; Colombia; Saudi Arabia; UAE; Iran; South Africa
Key companies profiled Tridyne Process Systems, Linapack, Pxiom Group, Coastal Counting & Industrial Scales Inc, Unitech, Zhongshan Multiweigh Packaging Machinery Co Ltd
Customization scope Free report customization (equivalent to up to 8 analysts' working days) with purchase. Addition or alteration to country, regional & segment scope.
Pricing and purchase options Avail customized purchase options to meet your exact research needs.

Key Segments in the Linear Net Weighing Machines Market

By Automation Type:

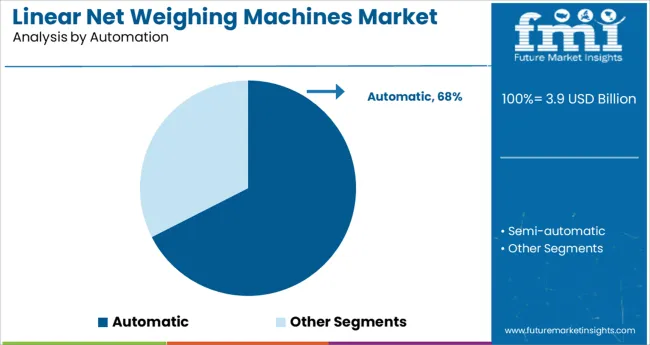
  • Automatic
  • Semi-automatic

By Heads:

  • Single Head
  • Multiple Head

By Weighing Range:

  • Up to 500 grams
  • 501 - 1000 grams
  • 1001 - 2000 grams
  • 2001 - 3000 grams
  • More than 3000 grams

By End-use Industry:

  • Food - Grains & Seeds
  • Tea & Coffee
  • Dairy Products
  • Meat
  • Poultry
  • Seafood
  • Cosmetics & Personal Care
  • Pharmaceuticals
  • Chemical &Fertilizers

By Region:

  • North America
  • Latin America
  • Asia Pacific
  • Middle East and Africa
  • Europe

Get the data you need at a Fraction of the cost

Personalize your report by choosing insights you need
and save 40%!

Frequently Asked Questions

What Region is the Most Prominent in the Linear Net Weighing Machines Market?

East and South Asia is the biggest market for the linear net weighing machines market and is expected to hold a big portion of the market in the forecast period due to the rising construction projects, growing infrastructure and industries in the region.

Who are the Key Competitors in the Linear Net Weighing Machines Market?

Key competitors holding substantial linear net weighing machines market share are Tridyne Process Systems, Linapack, Pxiom Group, Coastal Counting & Industrial Scales Inc, Unitech, and Zhongshan Multiweigh Packaging Machinery Co Ltd

Which is the Key Driver in the Linear Net Weighing Machines Market?

Demand for Linear net weighing machines is likely to rise with their high use in healthcare, pharmaceutical, and cosmetic & personal care. This increases the demand for linear net weighing machines.

Table of Content
1. Executive Summary | Linear Net Weighing Machines Market

    1.1. Global Market Outlook

    1.2. Demand-side Trends

    1.3. Supply-side Trends

    1.4. Technology Roadmap Analysis

    1.5. Analysis and Recommendations

2. Market Overview

    2.1. Market Coverage / Taxonomy

    2.2. Market Definition / Scope / Limitations

3. Market Background

    3.1. Market Dynamics

        3.1.1. Drivers

        3.1.2. Restraints

        3.1.3. Opportunity

        3.1.4. Trends

    3.2. Impact of Covid-19

        3.2.1. Demand in Optimistic Scenario

        3.2.2. Demand in Likely Scenario

        3.2.3. Demand in Conservative Scenario

    3.3. Macro Factors and Forecast Factors

    3.4. Value Chain Analysis

        3.4.1. Profit Margin Analysis

        3.4.2. Raw Material Suppliers

        3.4.3. Manufacturers, Wholesalers, and Distributors

        3.4.4. End Users/ Customers

    3.5. Regional Parent Market Outlook

    3.6. Production and Consumption Statistics

    3.7. Global Average Pricing Analysis Benchmark

4. Global Market Analysis 2015 to 2021 and Forecast, 2022 to 2032

    4.1. Historical Market Size Value (US$ Million) & Volume (Units) Analysis, 2015 to 2021

    4.2. Current and Future Market Size Value (US$ Million) & Volume (Units) Projections, 2022 to 2032

        4.2.1. Y-o-Y Growth Trend Analysis

        4.2.2. Absolute Opportunity Analysis

5. Global Market Analysis 2015 to 2021 and Forecast 2022 to 2032, By Automation

    5.1. Introduction / Key Findings

    5.2. Historical Market Size Value (US$ Million) & Volume (Units) Analysis by Automation, 2015 to 2021

    5.3. Current and Future Market Size Value (US$ Million) & Volume (Units) Analysis and Forecast by Automation, 2022 to 2032

        5.3.1. Automatic

        5.3.2. Semi-automatic

    5.4. Y-o-Y Growth Trend Analysis by Automation, 2015 to 2021

    5.5. Absolute Opportunity Analysis by Automation, 2022 to 2032

6. Global Market Analysis 2015 to 2021 and Forecast 2022 to 2032, By Weigh Range

    6.1. Introduction / Key Findings

    6.2. Historical Market Size Value (US$ Million) & Volume (Units) Analysis by Weigh Range, 2015 to 2021

    6.3. Current and Future Market Size Value (US$ Million) & Volume (Units) Analysis and Forecast by Weigh Range, 2022 to 2032

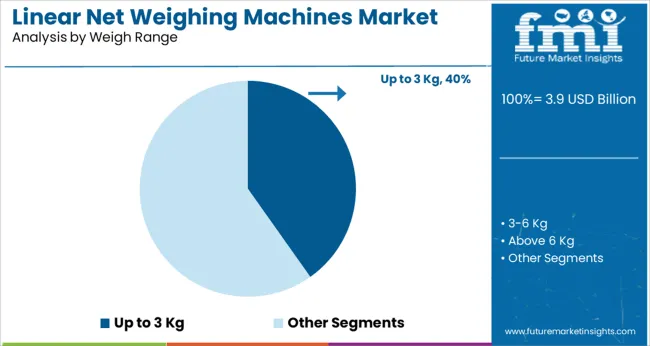
        6.3.1. Up to 3 Kg

        6.3.2. 3-6 Kg

        6.3.3. Above 6 Kg

    6.4. Y-o-Y Growth Trend Analysis by Weigh Range, 2015 to 2021

    6.5. Absolute Opportunity Analysis by Weigh Range, 2022 to 2032

7. Global Market Analysis 2015 to 2021 and Forecast 2022 to 2032, By End Use

    7.1. Introduction / Key Findings

    7.2. Historical Market Size Value (US$ Million) & Volume (Units) Analysis by End Use, 2015 to 2021

    7.3. Current and Future Market Size Value (US$ Million) & Volume (Units) Analysis and Forecast by End Use, 2022 to 2032

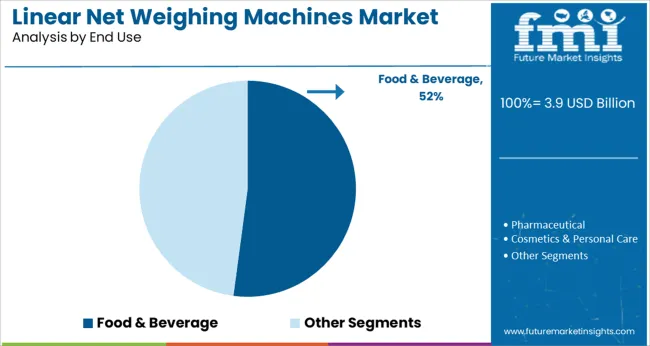
        7.3.1. Food & Beverage

        7.3.2. Pharmaceutical

        7.3.3. Cosmetics & Personal Care

        7.3.4. Chemical & Fertilizers

    7.4. Y-o-Y Growth Trend Analysis by End Use, 2015 to 2021

    7.5. Absolute Opportunity Analysis by End Use, 2022 to 2032

8. Global Market Analysis 2015 to 2021 and Forecast 2022 to 2032, By Region

    8.1. Introduction / Key Findings

    8.2. Historical Market Size Value (US$ Million) & Volume (Units) Analysis by Region, 2015 to 2021

    8.3. Current and Future Market Size Value (US$ Million) & Volume (Units) Analysis and Forecast by Region, 2022 to 2032

        8.3.1. North America

        8.3.2. Latin America

        8.3.3. Europe

        8.3.4. East Asia

        8.3.5. South Asia

        8.3.6. Oceania

        8.3.7. Middle East and Africa

    8.4. Market Attractiveness Analysis, by Region

9. North America Market Analysis 2015 to 2021 and Forecast 2022 to 2032, By Country

    9.1. Historical Market Size Value (US$ Million) & Volume (Units) Trend Analysis by Market Taxonomy, 2015 to 2021

    9.2. Market Size Value (US$ Million) & Volume (Units) Forecast by Market Taxonomy, 2022 to 2032

        9.2.1. By Country

            9.2.1.1. United States of America

            9.2.1.2. Canada

        9.2.2. By Automation

        9.2.3. By Weigh Range

        9.2.4. By End Use

    9.3. Market Attractiveness Analysis

        9.3.1. By Country

        9.3.2. By Automation

        9.3.3. By Weigh Range

        9.3.4. By End Use

    9.4. Key Takeaways

10. Latin America Market Analysis 2015 to 2021 and Forecast 2022 to 2032, By Country

    10.1. Historical Market Size Value (US$ Million) & Volume (Units) Trend Analysis by Market Taxonomy, 2015 to 2021

    10.2. Market Size Value (US$ Million) & Volume (Units) Forecast by Market Taxonomy, 2022 to 2032

        10.2.1. By Country

            10.2.1.1. Brazil

            10.2.1.2. Mexico

            10.2.1.3. Argentina

            10.2.1.4. Chile

            10.2.1.5. Peru

            10.2.1.6. Rest of Latin America

        10.2.2. By Automation

        10.2.3. By Weigh Range

        10.2.4. By End Use

    10.3. Market Attractiveness Analysis

        10.3.1. By Country

        10.3.2. By Automation

        10.3.3. By Weigh Range

        10.3.4. By End Use

    10.4. Key Takeaways

11. Europe Market Analysis 2015 to 2021 and Forecast 2022 to 2032, By Country

    11.1. Historical Market Size Value (US$ Million) & Volume (Units) Trend Analysis by Market Taxonomy, 2015 to 2021

    11.2. Market Size Value (US$ Million) & Volume (Units) Forecast by Market Taxonomy, 2022 to 2032

        11.2.1. By Country

            11.2.1.1. Germany

            11.2.1.2. Italy

            11.2.1.3. France

            11.2.1.4. United Kingdom

            11.2.1.5. Spain

            11.2.1.6. BENELUX

            11.2.1.7. Nordic

            11.2.1.8. Russia

            11.2.1.9. Poland

            11.2.1.10. Rest of Europe

        11.2.2. By Automation

        11.2.3. By Weigh Range

        11.2.4. By End Use

    11.3. Market Attractiveness Analysis

        11.3.1. By Country

        11.3.2. By Automation

        11.3.3. By Weigh Range

        11.3.4. By End Use

    11.4. Key Takeaways

12. East Asia Market Analysis 2015 to 2021 and Forecast 2022 to 2032, By Country

    12.1. Historical Market Size Value (US$ Million) & Volume (Units) Trend Analysis by Market Taxonomy, 2015 to 2021

    12.2. Market Size Value (US$ Million) & Volume (Units) Forecast by Market Taxonomy, 2022 to 2032

        12.2.1. By Country

            12.2.1.1. China

            12.2.1.2. Japan

            12.2.1.3. South Korea

        12.2.2. By Automation

        12.2.3. By Weigh Range

        12.2.4. By End Use

    12.3. Market Attractiveness Analysis

        12.3.1. By Country

        12.3.2. By Automation

        12.3.3. By Weigh Range

        12.3.4. By End Use

    12.4. Key Takeaways

13. South Asia Market Analysis 2015 to 2021 and Forecast 2022 to 2032, By Country

    13.1. Historical Market Size Value (US$ Million) & Volume (Units) Trend Analysis by Market Taxonomy, 2015 to 2021

    13.2. Market Size Value (US$ Million) & Volume (Units) Forecast by Market Taxonomy, 2022 to 2032

        13.2.1. By Country

            13.2.1.1. India

            13.2.1.2. Thailand

            13.2.1.3. Malaysia

            13.2.1.4. Indonesia

            13.2.1.5. Rest of South Asia

        13.2.2. By Automation

        13.2.3. By Weigh Range

        13.2.4. By End Use

    13.3. Market Attractiveness Analysis

        13.3.1. By Country

        13.3.2. By Automation

        13.3.3. By Weigh Range

        13.3.4. By End Use

    13.4. Key Takeaways

14. Oceania Market Analysis 2015 to 2021 and Forecast 2022 to 2032, By Country

    14.1. Historical Market Size Value (US$ Million) & Volume (Units) Trend Analysis by Market Taxonomy, 2015 to 2021

    14.2. Market Size Value (US$ Million) & Volume (Units) Forecast by Market Taxonomy, 2022 to 2032

        14.2.1. By Country

            14.2.1.1. Australia

            14.2.1.2. New Zealand

        14.2.2. By Automation

        14.2.3. By Weigh Range

        14.2.4. By End Use

    14.3. Market Attractiveness Analysis

        14.3.1. By Country

        14.3.2. By Automation

        14.3.3. By Weigh Range

        14.3.4. By End Use

    14.4. Key Takeaways

15. Middle East & Africa Market Analysis 2015 to 2021 and Forecast 2022 to 2032, By Country

    15.1. Historical Market Size Value (US$ Million) & Volume (Units) Trend Analysis by Market Taxonomy, 2015 to 2021

    15.2. Market Size Value (US$ Million) & Volume (Units) Forecast by Market Taxonomy, 2022 to 2032

        15.2.1. By Country

            15.2.1.1. GCC Countries

            15.2.1.2. Turkey

            15.2.1.3. Northern Africa

            15.2.1.4. South Africa

            15.2.1.5. Rest of Middle East and Africa

        15.2.2. By Automation

        15.2.3. By Weigh Range

        15.2.4. By End Use

    15.3. Market Attractiveness Analysis

        15.3.1. By Country

        15.3.2. By Automation

        15.3.3. By Weigh Range

        15.3.4. By End Use

    15.4. Key Takeaways

16. Country-wise Market Analysis

    16.1. United States of America

        16.1.1. Market Share Analysis, 2022

        16.1.2. By Automation

        16.1.3. By Weigh Range

        16.1.4. By End Use

    16.2. Canada

        16.2.1. Market Share Analysis, 2022

        16.2.2. By Automation

        16.2.3. By Weigh Range

        16.2.4. By End Use

    16.3. Brazil

        16.3.1. Market Share Analysis, 2022

        16.3.2. By Automation

        16.3.3. By Weigh Range

        16.3.4. By End Use

    16.4. Mexico

        16.4.1. Market Share Analysis, 2022

        16.4.2. By Automation

        16.4.3. By Weigh Range

        16.4.4. By End Use

    16.5. Germany

        16.5.1. Market Share Analysis, 2022

        16.5.2. By Automation

        16.5.3. By Weigh Range

        16.5.4. By End Use

    16.6. Italy

        16.6.1. Market Share Analysis, 2022

        16.6.2. By Automation

        16.6.3. By Weigh Range

        16.6.4. By End Use

    16.7. France

        16.7.1. Market Share Analysis, 2022

        16.7.2. By Automation

        16.7.3. By Weigh Range

        16.7.4. By End Use

    16.8. Spain

        16.8.1. Market Share Analysis, 2022

        16.8.2. By Automation

        16.8.3. By Weigh Range

        16.8.4. By End Use

    16.9. United Kingdom

        16.9.1. Market Share Analysis, 2022

        16.9.2. By Automation

        16.9.3. By Weigh Range

        16.9.4. By End Use

    16.10. Russia

        16.10.1. Market Share Analysis, 2022

        16.10.2. By Automation

        16.10.3. By Weigh Range

        16.10.4. By End Use

    16.11. China

        16.11.1. Market Share Analysis, 2022

        16.11.2. By Automation

        16.11.3. By Weigh Range

        16.11.4. By End Use

    16.12. Japan

        16.12.1. Market Share Analysis, 2022

        16.12.2. By Automation

        16.12.3. By Weigh Range

        16.12.4. By End Use

    16.13. India

        16.13.1. Market Share Analysis, 2022

        16.13.2. By Automation

        16.13.3. By Weigh Range

        16.13.4. By End Use

    16.14. GCC Countries

        16.14.1. Market Share Analysis, 2022

        16.14.2. By Automation

        16.14.3. By Weigh Range

        16.14.4. By End Use

    16.15. Australia

        16.15.1. Market Share Analysis, 2022

        16.15.2. By Automation

        16.15.3. By Weigh Range

        16.15.4. By End Use

17. Market Structure Analysis

    17.1. Competition Dashboard

    17.2. Competition Benchmarking

    17.3. Market Share Analysis of Top Players

        17.3.1. By Region

        17.3.2. By Product Portfolio

18. Competition Analysis

    18.1. Competition Deep Dive

        18.1.1. Tridyne Process Systems

            18.1.1.1. Overview

            18.1.1.2. Product Portfolio

            18.1.1.3. Profitability by Market Segments (Product/Channel/Region)

            18.1.1.4. Sales Footprint

            18.1.1.5. Strategy Overview

                18.1.1.5.1. Marketing Strategy

                18.1.1.5.2. Product Strategy

                18.1.1.5.3. Channel Strategy

        18.1.2. Linapack

            18.1.2.1. Overview

            18.1.2.2. Product Portfolio

            18.1.2.3. Profitability by Market Segments (Product/Channel/Region)

            18.1.2.4. Sales Footprint

            18.1.2.5. Strategy Overview

                18.1.2.5.1. Marketing Strategy

                18.1.2.5.2. Product Strategy

                18.1.2.5.3. Channel Strategy

        18.1.3. Pxiom Group

            18.1.3.1. Overview

            18.1.3.2. Product Portfolio

            18.1.3.3. Profitability by Market Segments (Product/Channel/Region)

            18.1.3.4. Sales Footprint

            18.1.3.5. Strategy Overview

                18.1.3.5.1. Marketing Strategy

                18.1.3.5.2. Product Strategy

                18.1.3.5.3. Channel Strategy

        18.1.4. METTLER TOLEDO

            18.1.4.1. Overview

            18.1.4.2. Product Portfolio

            18.1.4.3. Profitability by Market Segments (Product/Channel/Region)

            18.1.4.4. Sales Footprint

            18.1.4.5. Strategy Overview

                18.1.4.5.1. Marketing Strategy

                18.1.4.5.2. Product Strategy

                18.1.4.5.3. Channel Strategy

        18.1.5. Heat and Control, Inc.

            18.1.5.1. Overview

            18.1.5.2. Product Portfolio

            18.1.5.3. Profitability by Market Segments (Product/Channel/Region)

            18.1.5.4. Sales Footprint

            18.1.5.5. Strategy Overview

                18.1.5.5.1. Marketing Strategy

                18.1.5.5.2. Product Strategy

                18.1.5.5.3. Channel Strategy

        18.1.6. Unitech

            18.1.6.1. Overview

            18.1.6.2. Product Portfolio

            18.1.6.3. Profitability by Market Segments (Product/Channel/Region)

            18.1.6.4. Sales Footprint

            18.1.6.5. Strategy Overview

                18.1.6.5.1. Marketing Strategy

                18.1.6.5.2. Product Strategy

                18.1.6.5.3. Channel Strategy

        18.1.7. koldpackindia

            18.1.7.1. Overview

            18.1.7.2. Product Portfolio

            18.1.7.3. Profitability by Market Segments (Product/Channel/Region)

            18.1.7.4. Sales Footprint

            18.1.7.5. Strategy Overview

                18.1.7.5.1. Marketing Strategy

                18.1.7.5.2. Product Strategy

                18.1.7.5.3. Channel Strategy

        18.1.8. Technopack Corporation

            18.1.8.1. Overview

            18.1.8.2. Product Portfolio

            18.1.8.3. Profitability by Market Segments (Product/Channel/Region)

            18.1.8.4. Sales Footprint

            18.1.8.5. Strategy Overview

                18.1.8.5.1. Marketing Strategy

                18.1.8.5.2. Product Strategy

                18.1.8.5.3. Channel Strategy

        18.1.9. nVenia LLC.

            18.1.9.1. Overview

            18.1.9.2. Product Portfolio

            18.1.9.3. Profitability by Market Segments (Product/Channel/Region)

            18.1.9.4. Sales Footprint

            18.1.9.5. Strategy Overview

                18.1.9.5.1. Marketing Strategy

                18.1.9.5.2. Product Strategy

                18.1.9.5.3. Channel Strategy

        18.1.10. Weigh Right Automatic Scale Company

            18.1.10.1. Overview

            18.1.10.2. Product Portfolio

            18.1.10.3. Profitability by Market Segments (Product/Channel/Region)

            18.1.10.4. Sales Footprint

            18.1.10.5. Strategy Overview

                18.1.10.5.1. Marketing Strategy

                18.1.10.5.2. Product Strategy

                18.1.10.5.3. Channel Strategy

        18.1.11. SIGMA Equipment Inc.

            18.1.11.1. Overview

            18.1.11.2. Product Portfolio

            18.1.11.3. Profitability by Market Segments (Product/Channel/Region)

            18.1.11.4. Sales Footprint

            18.1.11.5. Strategy Overview

                18.1.11.5.1. Marketing Strategy

                18.1.11.5.2. Product Strategy

                18.1.11.5.3. Channel Strategy

        18.1.12. Zhengzhou Vtops Machinery Co., Ltd.

            18.1.12.1. Overview

            18.1.12.2. Product Portfolio

            18.1.12.3. Profitability by Market Segments (Product/Channel/Region)

            18.1.12.4. Sales Footprint

            18.1.12.5. Strategy Overview

                18.1.12.5.1. Marketing Strategy

                18.1.12.5.2. Product Strategy

                18.1.12.5.3. Channel Strategy

19. Assumptions and Acronyms Used

20. Research Methodology

Explore Packaging Insights

View Reports
Future Market Insights

Linear Net Weighing Machines Market