Slide Tray Box Market Size and Share Forecast Outlook 2025 to 2035

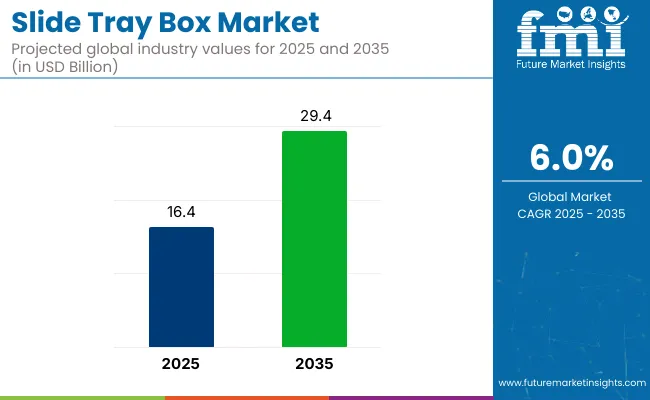
The slide tray box market is projected to be valued at USD 16.4 billion in 2025 and is anticipated to reach USD 29.4 billion by 2035, registering a CAGR of 6.0% over the forecast period. Sales in 2024 were estimated to reach approximately USD 15,622.3 billion, reflecting consistent demand from premium retail packaging and organized storage applications.
Quick Stats of slide tray box market

  • Market Value (2025): USD 16.4 billion
  • Forecast Value (2035): USD 29.4 billion
  • Forecast CAGR: 6.0%
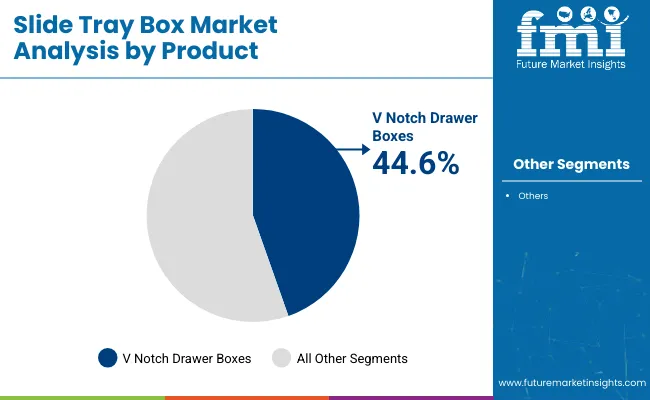
  • Top Product in 2025: V Notch Drawer Box (44.6% market share)
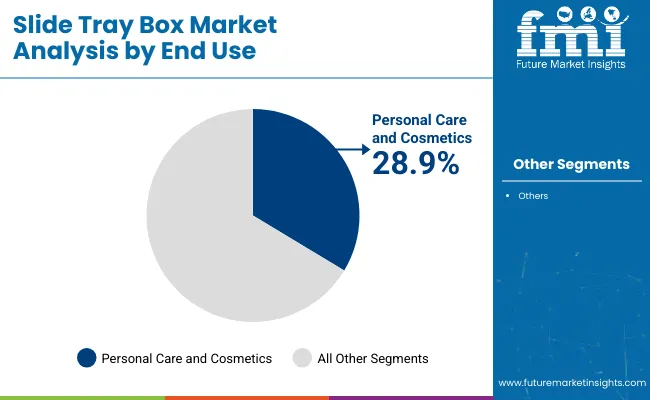
  • Top End Use: Personal Care and Cosmetics (28.9% market share)
  • Key Growth Region: South Asia and Pacific (India is the fastest-growing market with 6.7% CAGR)

Slide Tray Box Market

Metric Value
Market Size (2025E) USD 16.4 billion
Market Value (2035F) USD 29.4 billion
CAGR (2025 to 2035) 6.0%

Expansion of the market has been driven by the growing appeal of high-quality, customizable paperboard packaging in sectors such as cosmetics, personal care, electronics, and fashion. Consumer preferences for sustainable, gift-ready, and brand-elevating formats have resulted in the widespread adoption of rigid drawer boxes across global packaging operations.

In 2025, The Yebo Group expanded its production capabilities by investing in a second tray forming machine from H+S, reinforcing its focus on packaging automation. “We started looking for a new Tray Former to expand our capabilities back in mid‑2021.

When we took delivery of the first machine in January 2022, we knew it was going to have a good impact on our business, so we had no hesitation in ordering the second machine from H+S. It is great to extend our relationship with them and we have been impressed with the build quality and training on this easy to use machine,” said Andrew Tosh, CEO, The Yebo Group.

Demand has grown for environmentally friendly packaging formats that do not compromise product safety or aesthetics. Sustainability has emerged as a major influence on purchasing decisions, prompting manufacturers to adopt recyclable, biodegradable, and FSC-certified paperboards and substrates in slide tray box production.

Demand has grown for environmentally friendly packaging formats that do not compromise product safety or aesthetics. Brands have increasingly used this format to communicate environmental responsibility while preserving luxury appeal. Advances in manufacturing processes have allowed reduced material usage, minimized waste, and increased production efficiency, enabling companies to meet both ecological and economic goals.

Brands have increasingly used this format to communicate environmental responsibility while preserving luxury appeal. Advances in manufacturing processes have allowed reduced material usage, minimized waste, and increased production efficiency, enabling companies to meet both ecological and economic goals.

Advancements in die-cutting, finishing, and folding-gluing machinery have significantly improved the scalability and customization potential of drawer box formats. These innovations have enabled the creation of intricate structures using recyclable and FSC-certified paperboards without compromising on design precision or structural strength.

Growing investment in sustainable materials and plastic-free packaging by personal care brands has aligned well with drawer box solutions. As brand storytelling, eco-consciousness, and consumer experience remain central to packaging strategies, the drawer box market is expected to grow steadily as a premium yet practical format across diverse product categories.

Analyzing Slide Tray Box Market by Top Investment Segment

The market is segmented based on product, material, capacity, end use industry, and region. By product, the market includes V notch drawer box, box with ribbon pull, and box with handle. In terms of material, the market is categorized into plastic, metal, wood, and cardboard and paper.

By capacity, the market comprises up to 1 kg, 1.1 kg to 3 kg, 3.1 kg to 5 kg, and above 5 kg. By end use industry, the market includes food and beverages, electronics and electrical, textile, chemicals, pharmaceuticals and health care, personal care and cosmetics, and others. Regionally, the market is analyzed across North America, Latin America, Western Europe, Eastern Europe, East Asia, South Asia & Pacific, and the Middle East & Africa.

V Notch Drawer Boxes Chosen for Seamless Design and Premium Appeal

V Notch drawer boxes have been projected to account for 44.6% of the rigid paper drawer box market in 2025, due to their sharp-angled corners, seamless construction, and premium visual appeal. This format allows manufacturers to produce clean, refined drawer boxes that enhance unboxing experiences, making them highly favored in gifting and luxury packaging applications. The V-notch scoring process reduces material bulk at folds and allows for a tighter structure with minimal warping.

These boxes offer both functional durability and design sophistication, which are critical in high-end retail. Their compatibility with foil stamping, textured laminates, and custom inserts makes them ideal for branding. As sustainability becomes a key focus, many brands have adopted V notch drawer boxes using FSC-certified paperboard and biodegradable adhesives, balancing aesthetics with eco-conscious consumer preferences.
Slide Tray Box Market Analysis By Product

Personal Care and Cosmetics Drive Demand for Elegant and Reusable Drawer Packaging

Personal care and cosmetics have been estimated to hold a 28.9% market share in the rigid paper drawer box market in 2025, driven by the demand for elegant and sustainable secondary packaging. Drawer boxes are commonly used to house skincare kits, perfumes, lipsticks, and compact mirrors, offering both protection and luxury presentation. Their drawer-style mechanism enhances shelf presence and aligns with premium branding strategies in the beauty industry.

Cosmetics brands increasingly use drawer boxes to convey sophistication, build brand equity, and support influencer-driven unboxing experiences. As e-commerce gains prominence in beauty retail, sturdy rigid drawer boxes are favored to ensure product safety during transit. Furthermore, the growing shift toward refillable and limited-edition packaging has contributed to the adoption of rigid paper drawer boxes as reusable and collectible packaging solutions that resonate with environmentally aware consumers.
Slide Tray Box Market Analysis By End Use

Challenges and Opportunities

Challenges

High Manufacturing Costs and Competition from Alternative Packaging Solutions

However, one of the major challenges for the slide tray box market is the high cost of manufacturing rigid packaging, especially for premium and custom-made boxes. Also, the presence of alternatives packaging options such as folding cartons and magnetic closure boxes acts as restraints for market development.

Small-scale manufacturers also face cost hurdles due to the necessity of advanced printing and finishing techniques to achieve high aesthetic appeal and durability.

Opportunities

Sustainable Materials, Smart Packaging, and Personalization Trends

Segmentation by the end-user types provides firsthand insights into the actual development of the Slide Tray Box Market, which directly dictates the revenue generation. For instance, the increasing use of recyclable paper board, moldedfiber, kraft paper tray boxes, and other sustainable and biodegradable packaging materials is enhancing market attractiveness among eco-conscious consumers.

The increase in smart packaging solutions using QR codes, RFID, NFC and augmented reality (AR) for interactive unboxing experiences creates new business opportunities for luxury brands. Further, the growing demand for custom-printed and personalized slide tray boxes, used for gift packaging, limited-edition product launches, and subscription services are expected to upsurge the market adoption.

The emergence of aesthetically pleasing, lightweight, and durable die-cut slide tray boxes that add more protection to the product and branding opportunities will also benefit market growth.

Country-wise Insights

United States

This drives the slide tray box market in the United States to experience steady growth as premium and protective packaging in retail, which is increasingly needed with the expansion of e-commerce, and which tends to be made from sustainable and recyclable substances. Standards for packaging sustainability and recyclability are set by two governing bodies: the USA Environmental Protection Agency (EPA) and the Sustainable Packaging Coalition (SPC).

Market growth is driven by the expansion of luxury and custom packaging solutions, growing utilization of slide tray boxes in electronics and cosmetics packaging, and increasing investments in biodegradable and compostable packaging materials. Other industry trends include advancements in digital printing and high-end finishing techniques for slide tray boxes.

Country CAGR (2025 to 2035)
USA 6.2%

United Kingdom

The UK slide tray box market is experiencing growth driven by rising demand for attractive and sustainable packaging solutions, increased adoption in food, beverage and pharmaceutical industries, and the government's stringent regulations against plastic waste generation. Packaging compliance and sustainability schemes in the UK here (UK Environment Agency, British Retail Consortium (BRC))

The growth of sustainable rigid boxes, increasing customization in slide tray wrap packaging for branding purposes, and expansion of anti-counterfeit packaging solutions for high-end products are some factors aiding market expansion. In turn, investments in FSC-certified and 100% recycled paperboard materials are also shaping some of the trends in the industry.

Country CAGR (2025 to 2035)
UK 5.8%

European Union

The market for slide tray box in the European Union is growing at a steady pace owing to stringent package sustainability regulations in the European Union, increasing demand from consumers for plastic-free options and growing investments in premium and high-end packaging. Packaging sustainability and recyclability standards are governed by the European Environment Agency (EEA) and the European Paper Packaging Alliance (EPPA).

High-end consumer goods packaging, tamper-proof pharmaceutical packaging, and luxury rigid packaging solutions for retail are driving the adoption of slide tray boxes, especially across European nations like Germany, France, and Italy. Moreover, the introduction of smart packaging technology, such as RFID-enabled and interactive slide tray boxes, aids in the market growth.

Country CAGR (2025 to 2035)
European Union (EU) 6.0%

Japan

Owing to this, the Japan slide tray box market is growing due to high demand for precision-engineered and aesthetically refined packaging, increasing consumption of premium packaging for a variety of gift items, and growing consumer preference for minimalist and eco-friendly packaging solutions. Packaging innovation and sustainability policies are regulated by METI (Japan's Ministry of Economy, Trade, and Industry) and JPI (Japan Packaging Institute).

Companies involved in high-quality paperboard and rigid packaging solutions in Japan are focusing on customized slide tray boxes for cosmetic and confectionery; as well as light and durable packaging for electronics with anti-moisture properties. The industry trends include growth of biodegradable or reusable slide tray packaging materials.

Country CAGR (2025 to 2035)
Japan 6.1%

South Korea

The South Korea slide tray box market is growing at a rapid rate, as e-commerce and luxury retail sectors expanding, demand for tailored and unique packaging is increasing, and strong regulatory push for sustainable materials. Packaging waste management and compliance regulations fall under the Ministry of Environment of South Korea and the Korea Packaging Recycling Cooperative (KPRC).

Other trends driving growth of the Rigid Box packaging market include the rising trend of rigid box packaging in the high-end electronics and beauty industries, growing adoption of smart packaging with QR codes that make it easier for end-users to authenticate their products and sales of premium branding with high-gloss and textured slide tray box designs. Moreover, there is also growing interest in AI-driven packaging design and manufacturing for mass customization use cases.

Country CAGR (2025 to 2035)
South Korea 6.3%

Competitive Outlook

Their versatility, durability, and reusability further encourage the spread of the Slide Tray Box Market. Demand for high-end packaging, innovations in bio-based products, and the ascending e-commerce trends are the major factors justifying the growth of the market.

Businesses are now interested in high-strength, lightweight and aesthetic appeal in the slide tray boxes which help in adding value to brand, safety of product and sustainability. Contains Leading Packaging Manufacturers, Specialty Box Suppliers & Eco-packaging Innovators Contributing Towards Innovations in Recyclable, Biodegradable & High-end Custom Slide Tray Packaging

Key Players

  • Stora Enso Oyj-Introduced fully compostable slide tray packaging for food and beverage applications.
  • Graphic Packaging International-Developedcustom-printed rigid slide tray boxes for premium consumer goods.
  • PakFactor-Expandedaffordable, small-batch custom packaging solutions for startups and SMEs.
  • Ebro Color GmbH-Launchedluxury slide tray boxes with specialty finishes for the cosmetics industry.
  • Premier Packaging-Improvedshipping-grade slide tray boxes for high-value electronics and medical products.

Key Segmentation

By Product:

  • V notch drawer box
  • Box with ribbon pull
  • Box with handle

By Material:

  • Plastic
  • Metal
  • Wood
  • Cardboard and Paper

By Capacity:

  • Up to 1 Kg
  • 1.1 Kg to 3 Kg
  • 3.1 Kg to 5 Kg
  • Above 5 Kg

By End use industry:

  • Food and Beverages
  • Electronics and Electricals
  • Textile
  • Chemicals
  • Pharmaceuticals and Health care
  • Personal Care & Cosmetics
  • Others

By Region:

  • North America
  • Latin America
  • Western Europe
  • Eastern Europe
  • East Asia
  • South Asia Pacific
  • Middle East and Africa

Table of Content

  1. Executive Summary
    • Global Market Outlook
    • Demand-side Trends
    • Supply-side Trends
    • Technology Roadmap Analysis
    • Analysis and Recommendations
  2. Market Overview
    • Market Coverage / Taxonomy
    • Market Definition / Scope / Limitations
  3. Market Background
    • Market Dynamics
      • Drivers
      • Restraints
      • Opportunity
      • Trends
    • Scenario Forecast
      • Demand in Optimistic Scenario
      • Demand in Likely Scenario
      • Demand in Conservative Scenario
    • Opportunity Map Analysis
    • Product Life Cycle Analysis
    • Supply Chain Analysis
      • Supply Side Participants and their Roles
        • Producers
        • Mid-Level Participants (Traders/ Agents/ Brokers)
        • Wholesalers and Distributors
      • Value Added and Value Created at Node in the Supply Chain
      • List of Raw Material Suppliers
      • List of Existing and Potential Buyer’s
    • Investment Feasibility Matrix
    • Value Chain Analysis
      • Profit Margin Analysis
      • Wholesalers and Distributors
      • Retailers
    • PESTLE and Porter’s Analysis
    • Regulatory Landscape
      • By Key Regions
      • By Key Countries
    • Regional Parent Market Outlook
    • Production and Consumption Statistics
    • Import and Export Statistics
  4. Global Market Analysis 2020 to 2024 and Forecast, 2025 to 2035
    • Historical Market Size Value (USD Million) & Volume (Units) Analysis, 2020 to 2024
    • Current and Future Market Size Value (USD Million) & Volume (Units) Projections, 2025 to 2035
      • Y-o-Y Growth Trend Analysis
      • Absolute $ Opportunity Analysis
  5. Global Market Analysis 2020 to 2024 and Forecast 2025 to 2035, By Product Type
    • Introduction / Key Findings
    • Historical Market Size Value (USD Million) & Volume (Units) Analysis By Product Type, 2020 to 2024
    • Current and Future Market Size Value (USD Million) & Volume (Units) Analysis and Forecast By Product Type, 2025 to 2035
      • V Notch Drawer Box
      • Box with Ribbon Pull
      • Box with Handle
    • Y-o-Y Growth Trend Analysis By Product Type, 2020 to 2024
    • Absolute $ Opportunity Analysis By Product Type, 2025 to 2035
  6. Global Market Analysis 2020 to 2024 and Forecast 2025 to 2035, By Material
    • Introduction / Key Findings
    • Historical Market Size Value (USD Million) & Volume (Units) Analysis By Material, 2020 to 2024
    • Current and Future Market Size Value (USD Million) & Volume (Units) Analysis and Forecast By Material, 2025 to 2035
      • Plastic
      • Metal
      • Wood
      • Cardboard and Paper
    • Y-o-Y Growth Trend Analysis By Material, 2020 to 2024
    • Absolute $ Opportunity Analysis By Material, 2025 to 2035
  7. Global Market Analysis 2020 to 2024 and Forecast 2025 to 2035, By Capacity
    • Introduction / Key Findings
    • Historical Market Size Value (USD Million) & Volume (Units) Analysis By Capacity, 2020 to 2024
    • Current and Future Market Size Value (USD Million) & Volume (Units) Analysis and Forecast By Capacity, 2025 to 2035
      • Up to 1 Kg
      • 1.1 Kg to 3 Kg
      • 3.1 Kg to 5 Kg
      • Above 5 Kg
    • Y-o-Y Growth Trend Analysis By Capacity, 2020 to 2024
    • Absolute $ Opportunity Analysis By Capacity, 2025 to 2035
  8. Global Market Analysis 2020 to 2024 and Forecast 2025 to 2035, By End Use Industry
    • Introduction / Key Findings
    • Historical Market Size Value (USD Million) & Volume (Units) Analysis By End Use Industry, 2020 to 2024
    • Current and Future Market Size Value (USD Million) & Volume (Units) Analysis and Forecast By End Use Industry, 2025 to 2035
      • Food and Beverages
      • Electronics and Electricals
      • Textile
      • Chemicals
      • Pharmaceuticals and Health Care
      • Personal Care and Cosmetics
      • Others
    • Y-o-Y Growth Trend Analysis By End Use Industry, 2020 to 2024
    • Absolute $ Opportunity Analysis By End Use Industry, 2025 to 2035
  9. Global Market Analysis 2020 to 2024 and Forecast 2025 to 2035, By Region
    • Introduction
    • Historical Market Size Value (USD Million) & Volume (Units) Analysis By Region, 2020 to 2024
    • Current Market Size Value (USD Million) & Volume (Units) Analysis and Forecast By Region, 2025 to 2035
      • North America
      • Latin America
      • Europe
      • East Asia
      • South Asia
      • Oceania
      • MEA
    • Market Attractiveness Analysis By Region
  10. North America Market Analysis 2020 to 2024 and Forecast 2025 to 2035, By Country
    • Historical Market Size Value (USD Million) & Volume (Units) Trend Analysis By Market Taxonomy, 2020 to 2024
    • Market Size Value (USD Million) & Volume (Units) Forecast By Market Taxonomy, 2025 to 2035
      • By Country
        • USA
        • Canada
      • By Product Type
      • By Material
      • By Capacity
      • By End Use Industry
    • Market Attractiveness Analysis
      • By Country
      • By Product Type
      • By Material
      • By Capacity
      • By End Use Industry
    • Key Takeaways
  11. Latin America Market Analysis 2020 to 2024 and Forecast 2025 to 2035, By Country
    • Historical Market Size Value (USD Million) & Volume (Units) Trend Analysis By Market Taxonomy, 2020 to 2024
    • Market Size Value (USD Million) & Volume (Units) Forecast By Market Taxonomy, 2025 to 2035
      • By Country
        • Brazil
        • Mexico
        • Argentina
        • Chile
        • Peru
        • Rest of Latin America
      • By Product Type
      • By Material
      • By Capacity
      • By End Use Industry
    • Market Attractiveness Analysis
      • By Country
      • By Product Type
      • By Material
      • By Capacity
      • By End Use Industry
    • Key Takeaways
  12. Europe Market Analysis 2020 to 2024 and Forecast 2025 to 2035, By Country
    • Historical Market Size Value (USD Million) & Volume (Units) Trend Analysis By Market Taxonomy, 2020 to 2024
    • Market Size Value (USD Million) & Volume (Units) Forecast By Market Taxonomy, 2025 to 2035
      • By Country
        • Germany
        • Italy
        • France
        • UK
        • Spain
        • Russia
        • BENELUX
        • Rest of Europe
      • By Product Type
      • By Material
      • By Capacity
      • By End Use Industry
    • Market Attractiveness Analysis
      • By Country
      • By Product Type
      • By Material
      • By Capacity
      • By End Use Industry
    • Key Takeaways
  13. East Asia Market Analysis 2020 to 2024 and Forecast 2025 to 2035, By Country
    • Historical Market Size Value (USD Million) & Volume (Units) Trend Analysis By Market Taxonomy, 2020 to 2024
    • Market Size Value (USD Million) & Volume (Units) Forecast By Market Taxonomy, 2025 to 2035
      • By Country
        • China
        • Japan
        • South Korea
      • By Product Type
      • By Material
      • By Capacity
      • By End Use Industry
    • Market Attractiveness Analysis
      • By Country
      • By Product Type
      • By Material
      • By Capacity
      • By End Use Industry
    • Key Takeaways
  14. South Asia Market Analysis 2020 to 2024 and Forecast 2025 to 2035, By Country
    • Historical Market Size Value (USD Million) & Volume (Units) Trend Analysis By Market Taxonomy, 2020 to 2024
    • Market Size Value (USD Million) & Volume (Units) Forecast By Market Taxonomy, 2025 to 2035
      • By Country
        • India
        • Thailand
        • Malaysia
        • Indonesia
        • Rest of South Asia
      • By Product Type
      • By Material
      • By Capacity
      • By End Use Industry
    • Market Attractiveness Analysis
      • By Country
      • By Product Type
      • By Material
      • By Capacity
      • By End Use Industry
    • Key Takeaways
  15. Oceania Market Analysis 2020 to 2024 and Forecast 2025 to 2035, By Country
    • Historical Market Size Value (USD Million) & Volume (Units) Trend Analysis By Market Taxonomy, 2020 to 2024
    • Market Size Value (USD Million) & Volume (Units) Forecast By Market Taxonomy, 2025 to 2035
      • By Country
        • Australia
        • New Zealand
      • By Product Type
      • By Material
      • By Capacity
      • By End Use Industry
    • Market Attractiveness Analysis
      • By Country
      • By Product Type
      • By Material
      • By Capacity
      • By End Use Industry
    • Key Takeaways
  16. MEA Market Analysis 2020 to 2024 and Forecast 2025 to 2035, By Country
    • Historical Market Size Value (USD Million) & Volume (Units) Trend Analysis By Market Taxonomy, 2020 to 2024
    • Market Size Value (USD Million) & Volume (Units) Forecast By Market Taxonomy, 2025 to 2035
      • By Country
        • GCC
        • Rest of MEA
      • By Product Type
      • By Material
      • By Capacity
      • By End Use Industry
    • Market Attractiveness Analysis
      • By Country
      • By Product Type
      • By Material
      • By Capacity
      • By End Use Industry
    • Key Takeaways
  17. Key Countries Market Analysis
    • USA
      • Pricing Analysis
      • Market Share Analysis, 2024
        • By Product Type
        • By Material
        • By Capacity
        • By End Use Industry
    • Canada
      • Pricing Analysis
      • Market Share Analysis, 2024
        • By Product Type
        • By Material
        • By Capacity
        • By End Use Industry
    • Brazil
      • Pricing Analysis
      • Market Share Analysis, 2024
        • By Product Type
        • By Material
        • By Capacity
        • By End Use Industry
    • Mexico
      • Pricing Analysis
      • Market Share Analysis, 2024
        • By Product Type
        • By Material
        • By Capacity
        • By End Use Industry
    • Argentina
      • Pricing Analysis
      • Market Share Analysis, 2024
        • By Product Type
        • By Material
        • By Capacity
        • By End Use Industry
  18. Market Structure Analysis
    • Competition Dashboard
    • Competition Benchmarking
    • Market Share Analysis of Top Players
      • By Regional
      • By Product Type
      • By Material
      • By Capacity
      • By End Use Industry
  19. Competition Analysis
    • Competition Deep Dive
      • WestRock Company
        • Overview
        • Product Portfolio
        • Profitability by Market Segments (Product/Age /Sales Channel/Region)
        • Sales Footprint
        • Strategy Overview
          • Marketing Strategy
          • Product Strategy
          • Channel Strategy
      • DS Smith plc
        • Overview
        • Product Portfolio
        • Profitability by Market Segments (Product/Age /Sales Channel/Region)
        • Sales Footprint
        • Strategy Overview
          • Marketing Strategy
          • Product Strategy
          • Channel Strategy
      • Smurfit Kappa Group
        • Overview
        • Product Portfolio
        • Profitability by Market Segments (Product/Age /Sales Channel/Region)
        • Sales Footprint
        • Strategy Overview
          • Marketing Strategy
          • Product Strategy
          • Channel Strategy
      • Mondi Group
        • Overview
        • Product Portfolio
        • Profitability by Market Segments (Product/Age /Sales Channel/Region)
        • Sales Footprint
        • Strategy Overview
          • Marketing Strategy
          • Product Strategy
          • Channel Strategy
      • International Paper Company
        • Overview
        • Product Portfolio
        • Profitability by Market Segments (Product/Age /Sales Channel/Region)
        • Sales Footprint
        • Strategy Overview
          • Marketing Strategy
          • Product Strategy
          • Channel Strategy
  20. Assumptions & Acronyms Used
  21. Research Methodology

List of Tables

  • Table 1: Global Market Value (USD Million) Forecast by Region, 2020-2035
  • Table 2: Global Market Volume (Units) Forecast by Region, 2020-2035
  • Table 3: Global Market Value (USD Million) Forecast by Product Type, 2020-2035
  • Table 4: Global Market Volume (Units) Forecast by Product Type, 2020-2035
  • Table 5: Global Market Value (USD Million) Forecast by Material, 2020-2035
  • Table 6: Global Market Volume (Units) Forecast by Material, 2020-2035
  • Table 7: Global Market Value (USD Million) Forecast by Capacity, 2020-2035
  • Table 8: Global Market Volume (Units) Forecast by Capacity, 2020-2035
  • Table 9: Global Market Value (USD Million) Forecast by End Use Industry, 2020-2035
  • Table 10: Global Market Volume (Units) Forecast by End Use Industry, 2020-2035
  • Table 11: North America Market Value (USD Million) Forecast by Country, 2020-2035
  • Table 12: North America Market Volume (Units) Forecast by Country, 2020-2035
  • Table 13: North America Market Value (USD Million) Forecast by Product Type, 2020-2035
  • Table 14: North America Market Volume (Units) Forecast by Product Type, 2020-2035
  • Table 15: North America Market Value (USD Million) Forecast by Material, 2020-2035
  • Table 16: North America Market Volume (Units) Forecast by Material, 2020-2035
  • Table 17: North America Market Value (USD Million) Forecast by Capacity, 2020-2035
  • Table 18: North America Market Volume (Units) Forecast by Capacity, 2020-2035
  • Table 19: North America Market Value (USD Million) Forecast by End Use Industry, 2020-2035
  • Table 20: North America Market Volume (Units) Forecast by End Use Industry, 2020-2035
  • Table 21: Latin America Market Value (USD Million) Forecast by Country, 2020-2035
  • Table 22: Latin America Market Volume (Units) Forecast by Country, 2020-2035
  • Table 23: Latin America Market Value (USD Million) Forecast by Product Type, 2020-2035
  • Table 24: Latin America Market Volume (Units) Forecast by Product Type, 2020-2035
  • Table 25: Latin America Market Value (USD Million) Forecast by Material, 2020-2035
  • Table 26: Latin America Market Volume (Units) Forecast by Material, 2020-2035
  • Table 27: Latin America Market Value (USD Million) Forecast by Capacity, 2020-2035
  • Table 28: Latin America Market Volume (Units) Forecast by Capacity, 2020-2035
  • Table 29: Latin America Market Value (USD Million) Forecast by End Use Industry, 2020-2035
  • Table 30: Latin America Market Volume (Units) Forecast by End Use Industry, 2020-2035
  • Table 31: Europe Market Value (USD Million) Forecast by Country, 2020-2035
  • Table 32: Europe Market Volume (Units) Forecast by Country, 2020-2035
  • Table 33: Europe Market Value (USD Million) Forecast by Product Type, 2020-2035
  • Table 34: Europe Market Volume (Units) Forecast by Product Type, 2020-2035
  • Table 35: Europe Market Value (USD Million) Forecast by Material, 2020-2035
  • Table 36: Europe Market Volume (Units) Forecast by Material, 2020-2035
  • Table 37: Europe Market Value (USD Million) Forecast by Capacity, 2020-2035
  • Table 38: Europe Market Volume (Units) Forecast by Capacity, 2020-2035
  • Table 39: Europe Market Value (USD Million) Forecast by End Use Industry, 2020-2035
  • Table 40: Europe Market Volume (Units) Forecast by End Use Industry, 2020-2035
  • Table 41: East Asia Market Value (USD Million) Forecast by Country, 2020-2035
  • Table 42: East Asia Market Volume (Units) Forecast by Country, 2020-2035
  • Table 43: East Asia Market Value (USD Million) Forecast by Product Type, 2020-2035
  • Table 44: East Asia Market Volume (Units) Forecast by Product Type, 2020-2035
  • Table 45: East Asia Market Value (USD Million) Forecast by Material, 2020-2035
  • Table 46: East Asia Market Volume (Units) Forecast by Material, 2020-2035
  • Table 47: East Asia Market Value (USD Million) Forecast by Capacity, 2020-2035
  • Table 48: East Asia Market Volume (Units) Forecast by Capacity, 2020-2035
  • Table 49: East Asia Market Value (USD Million) Forecast by End Use Industry, 2020-2035
  • Table 50: East Asia Market Volume (Units) Forecast by End Use Industry, 2020-2035
  • Table 51: South Asia Market Value (USD Million) Forecast by Country, 2020-2035
  • Table 52: South Asia Market Volume (Units) Forecast by Country, 2020-2035
  • Table 53: South Asia Market Value (USD Million) Forecast by Product Type, 2020-2035
  • Table 54: South Asia Market Volume (Units) Forecast by Product Type, 2020-2035
  • Table 55: South Asia Market Value (USD Million) Forecast by Material, 2020-2035
  • Table 56: South Asia Market Volume (Units) Forecast by Material, 2020-2035
  • Table 57: South Asia Market Value (USD Million) Forecast by Capacity, 2020-2035
  • Table 58: South Asia Market Volume (Units) Forecast by Capacity, 2020-2035
  • Table 59: South Asia Market Value (USD Million) Forecast by End Use Industry, 2020-2035
  • Table 60: South Asia Market Volume (Units) Forecast by End Use Industry, 2020-2035
  • Table 61: Oceania Market Value (USD Million) Forecast by Country, 2020-2035
  • Table 62: Oceania Market Volume (Units) Forecast by Country, 2020-2035
  • Table 63: Oceania Market Value (USD Million) Forecast by Product Type, 2020-2035
  • Table 64: Oceania Market Volume (Units) Forecast by Product Type, 2020-2035
  • Table 65: Oceania Market Value (USD Million) Forecast by Material, 2020-2035
  • Table 66: Oceania Market Volume (Units) Forecast by Material, 2020-2035
  • Table 67: Oceania Market Value (USD Million) Forecast by Capacity, 2020-2035
  • Table 68: Oceania Market Volume (Units) Forecast by Capacity, 2020-2035
  • Table 69: Oceania Market Value (USD Million) Forecast by End Use Industry, 2020-2035
  • Table 70: Oceania Market Volume (Units) Forecast by End Use Industry, 2020-2035
  • Table 71: MEA Market Value (USD Million) Forecast by Country, 2020-2035
  • Table 72: MEA Market Volume (Units) Forecast by Country, 2020-2035
  • Table 73: MEA Market Value (USD Million) Forecast by Product Type, 2020-2035
  • Table 74: MEA Market Volume (Units) Forecast by Product Type, 2020-2035
  • Table 75: MEA Market Value (USD Million) Forecast by Material, 2020-2035
  • Table 76: MEA Market Volume (Units) Forecast by Material, 2020-2035
  • Table 77: MEA Market Value (USD Million) Forecast by Capacity, 2020-2035
  • Table 78: MEA Market Volume (Units) Forecast by Capacity, 2020-2035
  • Table 79: MEA Market Value (USD Million) Forecast by End Use Industry, 2020-2035
  • Table 80: MEA Market Volume (Units) Forecast by End Use Industry, 2020-2035

List of Figures

  • Figure 1: Global Market Value (USD Million) by Product Type, 2025-2035
  • Figure 2: Global Market Value (USD Million) by Material, 2025-2035
  • Figure 3: Global Market Value (USD Million) by Capacity, 2025-2035
  • Figure 4: Global Market Value (USD Million) by End Use Industry, 2025-2035
  • Figure 5: Global Market Value (USD Million) by Region, 2025-2035
  • Figure 6: Global Market Value (USD Million) Analysis by Region, 2020-2035
  • Figure 7: Global Market Volume (Units) Analysis by Region, 2020-2035
  • Figure 8: Global Market Value Share (%) and BPS Analysis by Region, 2025-2035
  • Figure 9: Global Market Y-o-Y Growth (%) Projections by Region, 2025-2035
  • Figure 10: Global Market Value (USD Million) Analysis by Product Type, 2020-2035
  • Figure 11: Global Market Volume (Units) Analysis by Product Type, 2020-2035
  • Figure 12: Global Market Value Share (%) and BPS Analysis by Product Type, 2025-2035
  • Figure 13: Global Market Y-o-Y Growth (%) Projections by Product Type, 2025-2035
  • Figure 14: Global Market Value (USD Million) Analysis by Material, 2020-2035
  • Figure 15: Global Market Volume (Units) Analysis by Material, 2020-2035
  • Figure 16: Global Market Value Share (%) and BPS Analysis by Material, 2025-2035
  • Figure 17: Global Market Y-o-Y Growth (%) Projections by Material, 2025-2035
  • Figure 18: Global Market Value (USD Million) Analysis by Capacity, 2020-2035
  • Figure 19: Global Market Volume (Units) Analysis by Capacity, 2020-2035
  • Figure 20: Global Market Value Share (%) and BPS Analysis by Capacity, 2025-2035
  • Figure 21: Global Market Y-o-Y Growth (%) Projections by Capacity, 2025-2035
  • Figure 22: Global Market Value (USD Million) Analysis by End Use Industry, 2020-2035
  • Figure 23: Global Market Volume (Units) Analysis by End Use Industry, 2020-2035
  • Figure 24: Global Market Value Share (%) and BPS Analysis by End Use Industry, 2025-2035
  • Figure 25: Global Market Y-o-Y Growth (%) Projections by End Use Industry, 2025-2035
  • Figure 26: Global Market Attractiveness by Product Type, 2025-2035
  • Figure 27: Global Market Attractiveness by Material, 2025-2035
  • Figure 28: Global Market Attractiveness by Capacity, 2025-2035
  • Figure 29: Global Market Attractiveness by End Use Industry, 2025-2035
  • Figure 30: Global Market Attractiveness by Region, 2025-2035
  • Figure 31: North America Market Value (USD Million) by Product Type, 2025-2035
  • Figure 32: North America Market Value (USD Million) by Material, 2025-2035
  • Figure 33: North America Market Value (USD Million) by Capacity, 2025-2035
  • Figure 34: North America Market Value (USD Million) by End Use Industry, 2025-2035
  • Figure 35: North America Market Value (USD Million) by Country, 2025-2035
  • Figure 36: North America Market Value (USD Million) Analysis by Country, 2020-2035
  • Figure 37: North America Market Volume (Units) Analysis by Country, 2020-2035
  • Figure 38: North America Market Value Share (%) and BPS Analysis by Country, 2025-2035
  • Figure 39: North America Market Y-o-Y Growth (%) Projections by Country, 2025-2035
  • Figure 40: North America Market Value (USD Million) Analysis by Product Type, 2020-2035
  • Figure 41: North America Market Volume (Units) Analysis by Product Type, 2020-2035
  • Figure 42: North America Market Value Share (%) and BPS Analysis by Product Type, 2025-2035
  • Figure 43: North America Market Y-o-Y Growth (%) Projections by Product Type, 2025-2035
  • Figure 44: North America Market Value (USD Million) Analysis by Material, 2020-2035
  • Figure 45: North America Market Volume (Units) Analysis by Material, 2020-2035
  • Figure 46: North America Market Value Share (%) and BPS Analysis by Material, 2025-2035
  • Figure 47: North America Market Y-o-Y Growth (%) Projections by Material, 2025-2035
  • Figure 48: North America Market Value (USD Million) Analysis by Capacity, 2020-2035
  • Figure 49: North America Market Volume (Units) Analysis by Capacity, 2020-2035
  • Figure 50: North America Market Value Share (%) and BPS Analysis by Capacity, 2025-2035
  • Figure 51: North America Market Y-o-Y Growth (%) Projections by Capacity, 2025-2035
  • Figure 52: North America Market Value (USD Million) Analysis by End Use Industry, 2020-2035
  • Figure 53: North America Market Volume (Units) Analysis by End Use Industry, 2020-2035
  • Figure 54: North America Market Value Share (%) and BPS Analysis by End Use Industry, 2025-2035
  • Figure 55: North America Market Y-o-Y Growth (%) Projections by End Use Industry, 2025-2035
  • Figure 56: North America Market Attractiveness by Product Type, 2025-2035
  • Figure 57: North America Market Attractiveness by Material, 2025-2035
  • Figure 58: North America Market Attractiveness by Capacity, 2025-2035
  • Figure 59: North America Market Attractiveness by End Use Industry, 2025-2035
  • Figure 60: North America Market Attractiveness by Country, 2025-2035
  • Figure 61: Latin America Market Value (USD Million) by Product Type, 2025-2035
  • Figure 62: Latin America Market Value (USD Million) by Material, 2025-2035
  • Figure 63: Latin America Market Value (USD Million) by Capacity, 2025-2035
  • Figure 64: Latin America Market Value (USD Million) by End Use Industry, 2025-2035
  • Figure 65: Latin America Market Value (USD Million) by Country, 2025-2035
  • Figure 66: Latin America Market Value (USD Million) Analysis by Country, 2020-2035
  • Figure 67: Latin America Market Volume (Units) Analysis by Country, 2020-2035
  • Figure 68: Latin America Market Value Share (%) and BPS Analysis by Country, 2025-2035
  • Figure 69: Latin America Market Y-o-Y Growth (%) Projections by Country, 2025-2035
  • Figure 70: Latin America Market Value (USD Million) Analysis by Product Type, 2020-2035
  • Figure 71: Latin America Market Volume (Units) Analysis by Product Type, 2020-2035
  • Figure 72: Latin America Market Value Share (%) and BPS Analysis by Product Type, 2025-2035
  • Figure 73: Latin America Market Y-o-Y Growth (%) Projections by Product Type, 2025-2035
  • Figure 74: Latin America Market Value (USD Million) Analysis by Material, 2020-2035
  • Figure 75: Latin America Market Volume (Units) Analysis by Material, 2020-2035
  • Figure 76: Latin America Market Value Share (%) and BPS Analysis by Material, 2025-2035
  • Figure 77: Latin America Market Y-o-Y Growth (%) Projections by Material, 2025-2035
  • Figure 78: Latin America Market Value (USD Million) Analysis by Capacity, 2020-2035
  • Figure 79: Latin America Market Volume (Units) Analysis by Capacity, 2020-2035
  • Figure 80: Latin America Market Value Share (%) and BPS Analysis by Capacity, 2025-2035
  • Figure 81: Latin America Market Y-o-Y Growth (%) Projections by Capacity, 2025-2035
  • Figure 82: Latin America Market Value (USD Million) Analysis by End Use Industry, 2020-2035
  • Figure 83: Latin America Market Volume (Units) Analysis by End Use Industry, 2020-2035
  • Figure 84: Latin America Market Value Share (%) and BPS Analysis by End Use Industry, 2025-2035
  • Figure 85: Latin America Market Y-o-Y Growth (%) Projections by End Use Industry, 2025-2035
  • Figure 86: Latin America Market Attractiveness by Product Type, 2025-2035
  • Figure 87: Latin America Market Attractiveness by Material, 2025-2035
  • Figure 88: Latin America Market Attractiveness by Capacity, 2025-2035
  • Figure 89: Latin America Market Attractiveness by End Use Industry, 2025-2035
  • Figure 90: Latin America Market Attractiveness by Country, 2025-2035
  • Figure 91: Europe Market Value (USD Million) by Product Type, 2025-2035
  • Figure 92: Europe Market Value (USD Million) by Material, 2025-2035
  • Figure 93: Europe Market Value (USD Million) by Capacity, 2025-2035
  • Figure 94: Europe Market Value (USD Million) by End Use Industry, 2025-2035
  • Figure 95: Europe Market Value (USD Million) by Country, 2025-2035
  • Figure 96: Europe Market Value (USD Million) Analysis by Country, 2020-2035
  • Figure 97: Europe Market Volume (Units) Analysis by Country, 2020-2035
  • Figure 98: Europe Market Value Share (%) and BPS Analysis by Country, 2025-2035
  • Figure 99: Europe Market Y-o-Y Growth (%) Projections by Country, 2025-2035
  • Figure 100: Europe Market Value (USD Million) Analysis by Product Type, 2020-2035
  • Figure 101: Europe Market Volume (Units) Analysis by Product Type, 2020-2035
  • Figure 102: Europe Market Value Share (%) and BPS Analysis by Product Type, 2025-2035
  • Figure 103: Europe Market Y-o-Y Growth (%) Projections by Product Type, 2025-2035
  • Figure 104: Europe Market Value (USD Million) Analysis by Material, 2020-2035
  • Figure 105: Europe Market Volume (Units) Analysis by Material, 2020-2035
  • Figure 106: Europe Market Value Share (%) and BPS Analysis by Material, 2025-2035
  • Figure 107: Europe Market Y-o-Y Growth (%) Projections by Material, 2025-2035
  • Figure 108: Europe Market Value (USD Million) Analysis by Capacity, 2020-2035
  • Figure 109: Europe Market Volume (Units) Analysis by Capacity, 2020-2035
  • Figure 110: Europe Market Value Share (%) and BPS Analysis by Capacity, 2025-2035
  • Figure 111: Europe Market Y-o-Y Growth (%) Projections by Capacity, 2025-2035
  • Figure 112: Europe Market Value (USD Million) Analysis by End Use Industry, 2020-2035
  • Figure 113: Europe Market Volume (Units) Analysis by End Use Industry, 2020-2035
  • Figure 114: Europe Market Value Share (%) and BPS Analysis by End Use Industry, 2025-2035
  • Figure 115: Europe Market Y-o-Y Growth (%) Projections by End Use Industry, 2025-2035
  • Figure 116: Europe Market Attractiveness by Product Type, 2025-2035
  • Figure 117: Europe Market Attractiveness by Material, 2025-2035
  • Figure 118: Europe Market Attractiveness by Capacity, 2025-2035
  • Figure 119: Europe Market Attractiveness by End Use Industry, 2025-2035
  • Figure 120: Europe Market Attractiveness by Country, 2025-2035
  • Figure 121: East Asia Market Value (USD Million) by Product Type, 2025-2035
  • Figure 122: East Asia Market Value (USD Million) by Material, 2025-2035
  • Figure 123: East Asia Market Value (USD Million) by Capacity, 2025-2035
  • Figure 124: East Asia Market Value (USD Million) by End Use Industry, 2025-2035
  • Figure 125: East Asia Market Value (USD Million) by Country, 2025-2035
  • Figure 126: East Asia Market Value (USD Million) Analysis by Country, 2020-2035
  • Figure 127: East Asia Market Volume (Units) Analysis by Country, 2020-2035
  • Figure 128: East Asia Market Value Share (%) and BPS Analysis by Country, 2025-2035
  • Figure 129: East Asia Market Y-o-Y Growth (%) Projections by Country, 2025-2035
  • Figure 130: East Asia Market Value (USD Million) Analysis by Product Type, 2020-2035
  • Figure 131: East Asia Market Volume (Units) Analysis by Product Type, 2020-2035
  • Figure 132: East Asia Market Value Share (%) and BPS Analysis by Product Type, 2025-2035
  • Figure 133: East Asia Market Y-o-Y Growth (%) Projections by Product Type, 2025-2035
  • Figure 134: East Asia Market Value (USD Million) Analysis by Material, 2020-2035
  • Figure 135: East Asia Market Volume (Units) Analysis by Material, 2020-2035
  • Figure 136: East Asia Market Value Share (%) and BPS Analysis by Material, 2025-2035
  • Figure 137: East Asia Market Y-o-Y Growth (%) Projections by Material, 2025-2035
  • Figure 138: East Asia Market Value (USD Million) Analysis by Capacity, 2020-2035
  • Figure 139: East Asia Market Volume (Units) Analysis by Capacity, 2020-2035
  • Figure 140: East Asia Market Value Share (%) and BPS Analysis by Capacity, 2025-2035
  • Figure 141: East Asia Market Y-o-Y Growth (%) Projections by Capacity, 2025-2035
  • Figure 142: East Asia Market Value (USD Million) Analysis by End Use Industry, 2020-2035
  • Figure 143: East Asia Market Volume (Units) Analysis by End Use Industry, 2020-2035
  • Figure 144: East Asia Market Value Share (%) and BPS Analysis by End Use Industry, 2025-2035
  • Figure 145: East Asia Market Y-o-Y Growth (%) Projections by End Use Industry, 2025-2035
  • Figure 146: East Asia Market Attractiveness by Product Type, 2025-2035
  • Figure 147: East Asia Market Attractiveness by Material, 2025-2035
  • Figure 148: East Asia Market Attractiveness by Capacity, 2025-2035
  • Figure 149: East Asia Market Attractiveness by End Use Industry, 2025-2035
  • Figure 150: East Asia Market Attractiveness by Country, 2025-2035
  • Figure 151: South Asia Market Value (USD Million) by Product Type, 2025-2035
  • Figure 152: South Asia Market Value (USD Million) by Material, 2025-2035
  • Figure 153: South Asia Market Value (USD Million) by Capacity, 2025-2035
  • Figure 154: South Asia Market Value (USD Million) by End Use Industry, 2025-2035
  • Figure 155: South Asia Market Value (USD Million) by Country, 2025-2035
  • Figure 156: South Asia Market Value (USD Million) Analysis by Country, 2020-2035
  • Figure 157: South Asia Market Volume (Units) Analysis by Country, 2020-2035
  • Figure 158: South Asia Market Value Share (%) and BPS Analysis by Country, 2025-2035
  • Figure 159: South Asia Market Y-o-Y Growth (%) Projections by Country, 2025-2035
  • Figure 160: South Asia Market Value (USD Million) Analysis by Product Type, 2020-2035
  • Figure 161: South Asia Market Volume (Units) Analysis by Product Type, 2020-2035
  • Figure 162: South Asia Market Value Share (%) and BPS Analysis by Product Type, 2025-2035
  • Figure 163: South Asia Market Y-o-Y Growth (%) Projections by Product Type, 2025-2035
  • Figure 164: South Asia Market Value (USD Million) Analysis by Material, 2020-2035
  • Figure 165: South Asia Market Volume (Units) Analysis by Material, 2020-2035
  • Figure 166: South Asia Market Value Share (%) and BPS Analysis by Material, 2025-2035
  • Figure 167: South Asia Market Y-o-Y Growth (%) Projections by Material, 2025-2035
  • Figure 168: South Asia Market Value (USD Million) Analysis by Capacity, 2020-2035
  • Figure 169: South Asia Market Volume (Units) Analysis by Capacity, 2020-2035
  • Figure 170: South Asia Market Value Share (%) and BPS Analysis by Capacity, 2025-2035
  • Figure 171: South Asia Market Y-o-Y Growth (%) Projections by Capacity, 2025-2035
  • Figure 172: South Asia Market Value (USD Million) Analysis by End Use Industry, 2020-2035
  • Figure 173: South Asia Market Volume (Units) Analysis by End Use Industry, 2020-2035
  • Figure 174: South Asia Market Value Share (%) and BPS Analysis by End Use Industry, 2025-2035
  • Figure 175: South Asia Market Y-o-Y Growth (%) Projections by End Use Industry, 2025-2035
  • Figure 176: South Asia Market Attractiveness by Product Type, 2025-2035
  • Figure 177: South Asia Market Attractiveness by Material, 2025-2035
  • Figure 178: South Asia Market Attractiveness by Capacity, 2025-2035
  • Figure 179: South Asia Market Attractiveness by End Use Industry, 2025-2035
  • Figure 180: South Asia Market Attractiveness by Country, 2025-2035
  • Figure 181: Oceania Market Value (USD Million) by Product Type, 2025-2035
  • Figure 182: Oceania Market Value (USD Million) by Material, 2025-2035
  • Figure 183: Oceania Market Value (USD Million) by Capacity, 2025-2035
  • Figure 184: Oceania Market Value (USD Million) by End Use Industry, 2025-2035
  • Figure 185: Oceania Market Value (USD Million) by Country, 2025-2035
  • Figure 186: Oceania Market Value (USD Million) Analysis by Country, 2020-2035
  • Figure 187: Oceania Market Volume (Units) Analysis by Country, 2020-2035
  • Figure 188: Oceania Market Value Share (%) and BPS Analysis by Country, 2025-2035
  • Figure 189: Oceania Market Y-o-Y Growth (%) Projections by Country, 2025-2035
  • Figure 190: Oceania Market Value (USD Million) Analysis by Product Type, 2020-2035
  • Figure 191: Oceania Market Volume (Units) Analysis by Product Type, 2020-2035
  • Figure 192: Oceania Market Value Share (%) and BPS Analysis by Product Type, 2025-2035
  • Figure 193: Oceania Market Y-o-Y Growth (%) Projections by Product Type, 2025-2035
  • Figure 194: Oceania Market Value (USD Million) Analysis by Material, 2020-2035
  • Figure 195: Oceania Market Volume (Units) Analysis by Material, 2020-2035
  • Figure 196: Oceania Market Value Share (%) and BPS Analysis by Material, 2025-2035
  • Figure 197: Oceania Market Y-o-Y Growth (%) Projections by Material, 2025-2035
  • Figure 198: Oceania Market Value (USD Million) Analysis by Capacity, 2020-2035
  • Figure 199: Oceania Market Volume (Units) Analysis by Capacity, 2020-2035
  • Figure 200: Oceania Market Value Share (%) and BPS Analysis by Capacity, 2025-2035
  • Figure 201: Oceania Market Y-o-Y Growth (%) Projections by Capacity, 2025-2035
  • Figure 202: Oceania Market Value (USD Million) Analysis by End Use Industry, 2020-2035
  • Figure 203: Oceania Market Volume (Units) Analysis by End Use Industry, 2020-2035
  • Figure 204: Oceania Market Value Share (%) and BPS Analysis by End Use Industry, 2025-2035
  • Figure 205: Oceania Market Y-o-Y Growth (%) Projections by End Use Industry, 2025-2035
  • Figure 206: Oceania Market Attractiveness by Product Type, 2025-2035
  • Figure 207: Oceania Market Attractiveness by Material, 2025-2035
  • Figure 208: Oceania Market Attractiveness by Capacity, 2025-2035
  • Figure 209: Oceania Market Attractiveness by End Use Industry, 2025-2035
  • Figure 210: Oceania Market Attractiveness by Country, 2025-2035
  • Figure 211: MEA Market Value (USD Million) by Product Type, 2025-2035
  • Figure 212: MEA Market Value (USD Million) by Material, 2025-2035
  • Figure 213: MEA Market Value (USD Million) by Capacity, 2025-2035
  • Figure 214: MEA Market Value (USD Million) by End Use Industry, 2025-2035
  • Figure 215: MEA Market Value (USD Million) by Country, 2025-2035
  • Figure 216: MEA Market Value (USD Million) Analysis by Country, 2020-2035
  • Figure 217: MEA Market Volume (Units) Analysis by Country, 2020-2035
  • Figure 218: MEA Market Value Share (%) and BPS Analysis by Country, 2025-2035
  • Figure 219: MEA Market Y-o-Y Growth (%) Projections by Country, 2025-2035
  • Figure 220: MEA Market Value (USD Million) Analysis by Product Type, 2020-2035
  • Figure 221: MEA Market Volume (Units) Analysis by Product Type, 2020-2035
  • Figure 222: MEA Market Value Share (%) and BPS Analysis by Product Type, 2025-2035
  • Figure 223: MEA Market Y-o-Y Growth (%) Projections by Product Type, 2025-2035
  • Figure 224: MEA Market Value (USD Million) Analysis by Material, 2020-2035
  • Figure 225: MEA Market Volume (Units) Analysis by Material, 2020-2035
  • Figure 226: MEA Market Value Share (%) and BPS Analysis by Material, 2025-2035
  • Figure 227: MEA Market Y-o-Y Growth (%) Projections by Material, 2025-2035
  • Figure 228: MEA Market Value (USD Million) Analysis by Capacity, 2020-2035
  • Figure 229: MEA Market Volume (Units) Analysis by Capacity, 2020-2035
  • Figure 230: MEA Market Value Share (%) and BPS Analysis by Capacity, 2025-2035
  • Figure 231: MEA Market Y-o-Y Growth (%) Projections by Capacity, 2025-2035
  • Figure 232: MEA Market Value (USD Million) Analysis by End Use Industry, 2020-2035
  • Figure 233: MEA Market Volume (Units) Analysis by End Use Industry, 2020-2035
  • Figure 234: MEA Market Value Share (%) and BPS Analysis by End Use Industry, 2025-2035
  • Figure 235: MEA Market Y-o-Y Growth (%) Projections by End Use Industry, 2025-2035
  • Figure 236: MEA Market Attractiveness by Product Type, 2025-2035
  • Figure 237: MEA Market Attractiveness by Material, 2025-2035
  • Figure 238: MEA Market Attractiveness by Capacity, 2025-2035
  • Figure 239: MEA Market Attractiveness by End Use Industry, 2025-2035
  • Figure 240: MEA Market Attractiveness by Country, 2025-2035

Frequently Asked Questions

What was the overall size of the slide tray box market in 2025?

The overall market size for the slide tray box market was USD 16.4 billion in 2025.

How big is the slide tray box market expected to be in 2035?

The slide tray box market is expected to reach USD 29.4 billion in 2035.

What will drive the demand for the slide tray box market during the forecast period?

Growing demand for premium and sustainable packaging, increasing adoption in luxury goods and electronics, and rising preference for eco-friendly rigid packaging solutions will drive market growth.

List the top 5 countries contributing to the slide tray box market.

The USA, China, Germany, Japan, and India are key contributors.

Which segment in type is expected to lead in the slide tray box market?

Paperboard slide tray boxes are expected to dominate due to their recyclability, durability, and widespread use in retail and gift packaging.

Explore Similar Insights

Future Market Insights

Slide Tray Box Market