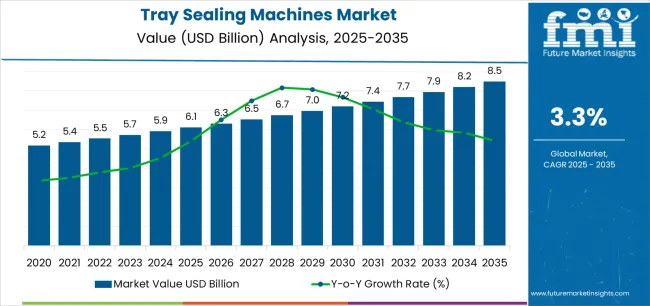
The Tray Sealing Machines Market is estimated to be valued at USD 6.1 billion in 2025 and is projected to reach USD 8.5 billion by 2035, registering a compound annual growth rate (CAGR) of 3.3% over the forecast period.
The Tray Sealing Machines market is witnessing significant growth driven by the increasing demand for efficient, hygienic, and automated packaging solutions across the food and beverage industry. The future outlook remains optimistic as manufacturers continue to invest in automation and digitalization to improve productivity and reduce operational costs. The market growth is being propelled by rising consumer preference for convenience foods, extended shelf life, and sustainable packaging formats.
Advancements in sealing technologies have enabled higher precision, reduced energy consumption, and enhanced sealing integrity, which are critical in ensuring food safety and freshness. Moreover, the shift towards ready-to-eat and take-away meal packaging is accelerating demand for tray sealing machines, especially from retail and food service providers.
The integration of intelligent sensors and control systems is improving operational accuracy, supporting Industry 4.0 adoption in packaging lines As sustainability regulations tighten globally, manufacturers are focusing on recyclable and biodegradable tray materials, which will further drive innovation and growth within the tray sealing machines market.
| Metric | Value |
|---|---|
| Tray Sealing Machines Market Estimated Value in (2025 E) | USD 6.1 billion |
| Tray Sealing Machines Market Forecast Value in (2035 F) | USD 8.5 billion |
| Forecast CAGR (2025 to 2035) | 3.3% |
The market is segmented by Technology, Application Type, Operating Speed, and Packaging Type and region. By Technology, the market is divided into Automatic, Semi-Automation, and Manual. In terms of Application Type, the market is classified into Meat, Poultry And Sea Food, Bakery And Confectionary, Fresh Produce, Ready Meals, Sweets And Dry Fruits, and Others. Based on Operating Speed, the market is segmented into 4 To 8 CPM, Up To 3 CPM, 9 To 12 CPM, and Above 12 CPM. By Packaging Type, the market is divided into MAP, VSP, and General Sealing. Regionally, the market is classified into North America, Latin America, Western Europe, Eastern Europe, Balkan & Baltic Countries, Russia & Belarus, Central Asia, East Asia, South Asia & Pacific, and the Middle East & Africa.
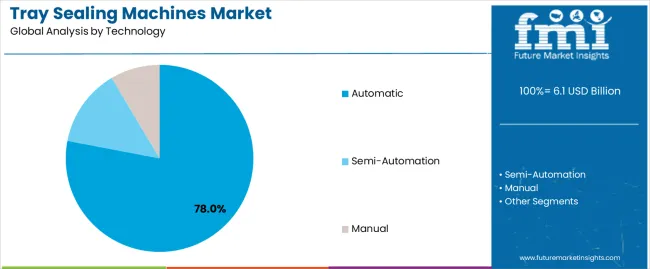
The automatic technology segment is projected to hold 78.0% of the Tray Sealing Machines market revenue share in 2025, making it the leading technology type. This dominance is driven by the growing preference for automation in packaging lines to enhance operational efficiency, minimize manual intervention, and ensure consistent product quality. Automatic tray sealing machines enable faster throughput, reduced labor dependency, and improved precision in sealing operations.
The increasing focus on food safety and hygiene standards has encouraged manufacturers to adopt fully automated systems that limit human contact during packaging. Additionally, advancements in automation software, including real-time monitoring and remote diagnostics, have improved the reliability and performance of automatic sealing systems.
The growing demand for high-speed, large-volume production lines across food processing and pharmaceutical industries further supports the expansion of this segment The cost efficiency, scalability, and reduced downtime offered by automatic tray sealing machines have positioned them as the preferred choice for medium to large-scale manufacturers worldwide.
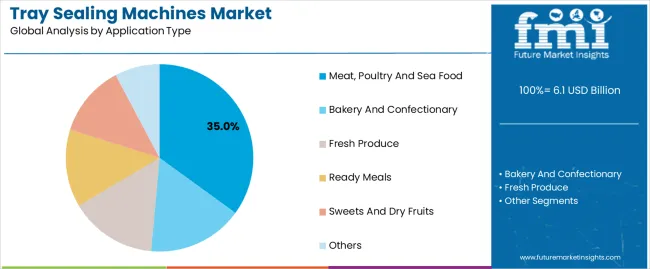
The meat, poultry, and seafood application segment is expected to account for 35.0% of the Tray Sealing Machines market revenue share in 2025, establishing its position as a leading application type. The growth of this segment is being driven by the rising demand for fresh, chilled, and frozen packaged meat products that require reliable sealing to maintain product integrity and extend shelf life. Tray sealing machines are being increasingly utilized in this sector for their ability to provide secure, leak-proof packaging that preserves freshness and prevents contamination.
Growing consumer preference for portion-controlled and ready-to-cook meat packaging has further accelerated adoption. The integration of modified atmosphere packaging (MAP) technology in tray sealing machines enhances product quality by maintaining ideal oxygen and carbon dioxide levels.
Additionally, stringent food safety regulations and hygiene compliance requirements have LED to widespread use of automated tray sealing systems With global meat consumption on the rise, this application segment continues to experience strong growth momentum across retail and food processing industries.
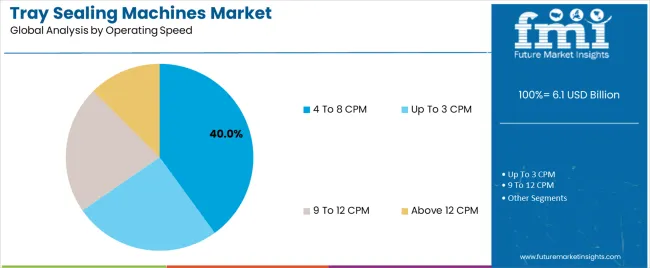
The 4 to 8 CPM operating speed segment is projected to capture 40.0% of the Tray Sealing Machines market revenue share in 2025, making it a leading operating speed category. The prominence of this segment is attributed to its suitability for small to medium-scale production environments where flexibility, precision, and moderate throughput are essential. Machines operating at this speed range offer a balanced combination of efficiency and cost-effectiveness, making them ideal for food producers managing diverse packaging formats.
The increasing demand for semi-automated and small-batch production in the ready-meal and convenience food sectors has supported adoption in this range. Furthermore, the 4 to 8 CPM machines provide better control over sealing pressure and temperature, ensuring consistent sealing quality without compromising productivity.
The segment’s growth is also supported by the expanding base of small and mid-sized food manufacturers investing in compact yet technologically advanced packaging machinery As demand for customized and short-run packaging solutions continues to grow, this operating speed category is expected to maintain steady expansion.
The table provided below presents the poised CAGR for Global tray sealing machines market over several semi-annual periods spanning from 2025 to 2035. In the first half (H1) of the year from 2025 to 2035, the business is predicted to surge at a CAGR of 3.1%, followed by a slightly higher growth rate of 3.9% in the second half (H2) of the same year.
| Particulars | Value CAGR |
|---|---|
| H1 | 3.1% (2025 to 2035) |
| H2 | 3.9% (2025 to 2035) |
| H1 | 3.0% (2025 to 2035) |
| H2 | 4.1% (2025 to 2035) |
Moving in the subsequent period, from H1 2025 to H2 2035, the CAGR is projected to decrease slightly to 3.0% and remain relatively stagnant at 4.1% in the second half. In the first half (H1), the market witness a decline of 10 BPS while in the second half (H2) the market expected to witness an increase of 20 BPS
Development of Compact Table-top Machines to be a Prominent Trend
The automated tray sealing machines are suitable for firms where the output production volume is significantly high. These machines are highly costly and low-end manufacturing firms sometimes can’t afford them. The production speed of these machines is significantly high and sometimes mid-range food and beverage producers are unable to afford them.
The high risk of maintenance further reduces the widespread adoption. The manufacturers of tray sealing machines recently initiated to overcome this dilemma and have started to emphasize their focus towards low-end firms where a major section of food and beverage producers belongs to this category.
Semi-automated tray sealing machines with tabletop sizes have attracted emerging and established low-end, end users in the tray sealing machines sector. Semi-automated machines, in comparison with automated tray-sealing machines, are highly affordable. These machines are efficient and have to spend considerably lower amounts for maintenance. Food items such as seafood, poultry, and meats are consumed daily, especially in regions such as MEA, Europe, and the Americas.
While easily perishable nature of these products and the need for fresh products from the consumer side encourage the industry towards more localization. Hence focusing on these local markets for the manufacturers of tray-sealing machines is crucial. Furthermore, Manufacturers can create various customization opportunities in the products to attract end users and can help to dominate in the competitive market.
Food Processing Industries are Implementing Automated Technologies to Improve Efficiency
Food and beverage sectors are growing rapidly across the globe. Recently, there has been a considerable rise in restaurants, grocery shops, and hotels driven by the growing consumption of food and beverages.
The rapid rise in the industry has further induced to adoption of an online food and beverage delivery culture. The rise in demand for food and beverage items enabled the industry to increase its production and supply chain strength considerably. To address the growing adoption, prominent food and beverage firms have started to adopt automation solutions in the entire production process including packaging.
Implementation of automation reduces constrain which sometimes creates constraints to manufacturers both economically and legally. These include increased wastage, human error in production and packaging, largest production time, and inconsistent production and packaging output. Adopting an automated solution will address these issues effectively and help to get rid of as mentioned issues.
Automated tray sealing machines are gaining popularity in the market, especially in the packaging of products such as meat, poultry and seafood items. These machines often come with integrated systems such as seal inspection systems and leakage inspection systems. Moreover, the adoption of real-time tracking systems and automated diagnosis solutions have also got huge traction in the market.
Food tray materials such as APECT, CPET, and PP have shown considerable adaptability in the current market, and manufacturing tray sealing machines, particularly targeting these materials can amplify sales. Asia Pacific with a leading consumption hub for food and beverage, and the tray-sealing machines sectors can target here especially emerging nations such as India and China.
Shift in Preference for Flexible Packaging Solutions over Rigid Packaging Hamper the Market
Consumers are shifting their preference in the choice of packaging from rigid packaging to flexible packaging. Growing fast-paced lifestyles and on-the-go culture across the globe have enabled this trend. Flexible packages offer benefits such as easiness of carrying and handling and convenience on commute or travel. Today, packaging is not only a system for storage but also provides various means to consumers.
Retailers and packaging end users adopt packages for brand promotion through printing and other means to promote their brand thereby increasing sales. Consumers increasingly seeking convenience and ease of use while selecting a package.
The large section of food and beverage items requires an exceptional oxygen barrier while storing and consuming. Flexible packaging is more convenient in this and causing widespread adoption. Growing flexible packaging adoption in the market considerably hamper the market of rigid packaging including the sales of treys. This trend also negatively affects the market of tray sealing machines.
The global market of tray sealing machines has recorded a CAGR of 1.9% during the historical period ie, 2020 to 2025. The market recorded a value of USD 5.2 billion in 2020 and has positively reached USD 6.1 billion in 2025.
The market of tray sealing machines encompasses a diverse array of materials specifically used for sealing trays which are used to store and transport products such as meat, poultry and seafood, bakery and confectionary, fresh produce, ready meals, sweeteners, and dry fruits.
These machines are available in diverse formats including fully automated, semi-automated and manual machines. The market of tray sealing machines growing attractively growth driven by a rise in consumption of food and beverage items across the globe, which propels the need for more convenient, efficient, and faster production lines causing the adoption of these machinery solutions.
Regions such as North America, Europe, and MEA are the leading consumers of meat, poultry, and seafood items. These food items are contaminated easily and have to be stored and packaged effectively to prevent possible damage. Tray sealing machines unlike traditional man-power packaging solutions, offer exceptional efficiency, lower wastage, minimal operational errors, and faster operation have enabled the producers to adopt them wildly.
In the forecast period, the tray sealing machines sector is anticipated to grow with a CAGR of 3.5% making it an attractive market. Consumption of tray sealing machines with up to 3 CPM operating speeds is expected to dominate in the market and can be observed in the entire course of the market. Considering end use, the sweets and dry fruits are expected to lead the market in terms of growth and are anticipated to grow at a CAGR of 4.1%.
The market is expected to cater to multiple opportunities in the current and future market trends. Especially in emerging markets such as India and China. The larger population in these locations and emerging end-user industrial presence make an attractive geography for both high-end and mid-end machines.
China’s encouraging technology adoption culture further fuels the economic dominance and manufacturers can strategically implement the business in this region. Customization is another trend that attracts both retailers and consumers. Today, offering customization is prominently seen in every industry including machinery. Understanding the specific needs of end users and offering solutions specifically targeting certain product types can help to achieve market growth ever in changing trends.
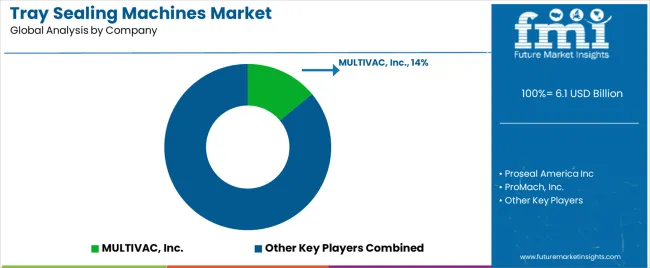
Tier 1 companies encompasses the market leaders with market revenue exceeding USD 65 million acquiring a cumulative market share of 20-25% of the global market. These market players are characterized by their high production capacity and strict focus on the development of innovative and efficient tray sealing machines. Furthermore, these market leaders are known by their substantial competence in manufacturing across multiple tray sealing machines, wider distribution network across multiple regions and countries with a strong consumer presence.
These manufacturers continuously involved in the investment in development of novel tray sealing machine and continuously updating existing tray sealing with latest industrial standards. Prominent companies within Tier 1 include AptarGroup, Inc, John Bean Technologies Corporation (JBT), Omori Machinery Co., Ltd, ISHIDA CO., LTD and others.
Tier 2 companies include mid-sized players with revenue of USD 33 to 65 million having a strong foothold in specific region and also have selected international presence. These manufacturers offer tray seal machines for multiple end use but may not be used in specialized application.
These players lack diversity in product portfolio and advanced technology offering. Considering Tier 1 companies, Tier 2 companies will have lower global reach and lesser investment in the research and development for the development of novel products. Prominent players in Tier 2 includes Mondini, MULTIVAC, INC., Italianpack S.p.A and others.
Tier 3 includes the small-scale companies or startups operating at the local presence and serving niche markets having revenue below USD 33 million. These manufacturers mainly focused on fulfilling local market demands and hence are characterized by Tier 3 companies. They are small scale players and have limited geographical reach. Tier 3, is recognized as an unorganized market, denoting a sector characterized by a lack of extensive structure and formalization when compared to organized competitors.
The contents below cover the industry analysis for the tray sealing machines market for multiple countries. Market demand analysis on key countries in multiple regions of the globe including North America, Latin America, East Asia, Western Europe and others are provided.
The United States is anticipated to be the leader in the North American tray sealing machines industry and expected to grow with a CAGR of 2.3% during the forecast period. In Europe, Germany anticipated to lead the market in terms of market share expected to grow with a CAGR of 1.2% during the forecast period.
| Countries | Value CAGR (2025 to 2035) |
|---|---|
| USA | 2.3% |
| Germany | 1.2% |
| China | 5.8% |
| UK | 1.5% |
| India | 5.7% |
| Japan | 2.1% |
| GCC Countries | 4.7% |
| Brazil | 3.6% |
The tray sealing machines market in India expected to generate USD 6.1 million growth opportunity during the forecast period. The country is expected to capture 43% of the South Asian market in 2025.
Indian Ministry of Food Processing Industries stated that the food processing industry is a prominent segment considering its contribution to the country’s GDP. Also, in terms of employment and exports, the food processing sector is an attractive market due to the rise in population and growing disposable income in the middle-class. The mentioned ministry stated that the food processing sector in India is growing at an average annual growth rate of 7.3%.
This attractive growth is expected to affect the tray sealing machines market positively in the forecast period. Growing startups and cross-cultural dominance in the Indian food sector have motivated the prominent players in the tray-sealing machine market players to invest in the country. It is expected that during the forecast period, India will experience considerable growth adhering to the growing food sector trends.
The USA market for tray seal machines expected to generate an incremental opportunity of USD 168.1 by the end of 2035 of the North American market. It is one of the attractive market for tray sealing machines due to heightened consumption of meat and poultry products.
Organisation for Economic Co-operation and Development stated that the USA average per capita consumption of poultry meat is expected to be 50.9 kilogram in 2035. The country is the second highest consumer of poultry meat after Israel considering per capita consumption. It is expected that the tray sealing machine marker in the USA will experience a positive trend due to growing consumer presence and cross-cultural trends.
The efficient food and beverage quality regulatory bodies in the region enhance consumer confidence in the region. Prominent food processing sectors in the region are adopting effective manufacturing facilities considering hygiene and quality. Tray seal machine manufacturers should adopt the mechanism and facilities to adhere to strict cleaning culture and features to adhere with the stricter FDA regulations.
The section contains information about the leading segment in the tray sealing machine market. Automatic tray sealing machines expected to grow 3.7% during the forecast period. Tray seal machines 9 to 12 CPM operating speed expected to grow at a rate of 4.1%.
| Technology | Automatic |
|---|---|
| Value Share (2035) | 73.8% |
Automatic tray seal machines among other type of tray seal machines expected to dominates the market during the forecast period. The automatic tray seal machines poised to grow at a CAGR of 3.7% during the forecast period and generating an Incremental opportunity of USD 1.8 billion by the end of the forecast period.
Automatic tray seal machines even though its cost constrain, expected to dominate the global market. Rise in need for convenient and efficient tray sealing machines shift the adoption of automated tray seal machines.
Manual tray seal machines have lower production capacity and often need larger work force to operate while the adoption of automated solution can reduce the need of larger work force and increase the production capacity. Automated machines are highly consistent considering quality while manual based machines often faces multiple issues pertaining human and machine errors.
Semi-automatic tray seal machines are expected to capture a considerable market share during the forecast period. This is due to the adoption of mid-range consumers due to cost constraints. Semi-automated tray seals have considerable production capacity and are efficient. The targeted segment is anticipated to grow with a CAGR of 2.9% during the forecast period.
| Operating Speed | 9 to 12 CPM |
|---|---|
| Value CAGR (2035) | 4.1% |
9 to 12 CPM-based tray seal machines are expected to dominate the tray seal machines market considering the growth rate. These machines are characterized by their exceptional production capacity and speed. It is expected that global food consumption will grow rapidly due to the rise in population and increase in disposable income.
The consumer sectors in the tray seal machines market have started to improve production capacity and speed to adhere to the trending market landscape. Regions such as North America and Asia Pacific are expected to adopt these machines dominantly due to the largest consumer presence.
Up to 3 CPM-based machines are expected to dominate the market in terms of market share. This is because these machines are cost-effective considering other types of machinery in this market. The mid-level and unorganized market players are focusing on the low-budget machinery which propels the adoption of the 3 CPM machineries. Up to 3 CPM-based tray seal machines are expected to grow with a CAGR of 3.2% during the forecast period.
Key players of the tray seal machines market are manufacturing and launching novel products in the market. They are collaborating with multiple end user firms to expand their geographical reach.
Key Developments in Tray Seal Machinery Industry
In terms of technology, the industry is divided into automatic, semi-automation and manual tray sealing machines.
In terms of application type, the industry is divided into meat, poultry and sea food, bakery and confectionary, fresh produce, ready meals, sweets and dry fruits, and others.
In terms of operating speed, the industry is divided into up to 3 CPM, 4 to 8 CPM, 9 to 12 CPM, and above 12 CPM.
In terms of packaging type, the industry is divided into MAP, VSP and General Sealing.
In terms of region, the industry is divided into North America, Latin America, Europe, South Asia, East Asia, Oceania and MEA.
The global tray sealing machines market is estimated to be valued at USD 6.1 billion in 2025.
The market size for the tray sealing machines market is projected to reach USD 8.5 billion by 2035.
The tray sealing machines market is expected to grow at a 3.3% CAGR between 2025 and 2035.
The key product types in tray sealing machines market are automatic, semi-automation and manual.
In terms of application type, meat, poultry and sea food segment to command 35.0% share in the tray sealing machines market in 2025.


Full Research Suite comprises of:
Market outlook & trends analysis
Interviews & case studies
Strategic recommendations
Vendor profiles & capabilities analysis
5-year forecasts
8 regions and 60+ country-level data splits
Market segment data splits
12 months of continuous data updates
DELIVERED AS:
PDF EXCEL ONLINE
Meal Tray Sealing Machines Market Size and Share Forecast Outlook 2025 to 2035
United States and Canada Tray Sealing Machines Market Size and Share Forecast Outlook 2025 to 2035
Tray Dispensers Market Size and Share Forecast Outlook 2025 to 2035
Tray Market Analysis – Growth & Forecast 2024-2034
Tray Liners Market
Tray Packing Machine Market
Tray Loader Market
Tray Former Machines Market Size and Share Forecast Outlook 2025 to 2035
Tray Sealer Machines Market Size and Share Forecast Outlook 2025 to 2035
Market Share Distribution Among Tray Former Machines Manufacturers
Industry Share & Competitive Positioning in Tray Sealer Machines
Tray and Sleeve Packing Machines Market Size and Share Forecast Outlook 2025 to 2035
ESD Trays Market Size and Share Forecast Outlook 2025 to 2035
Lab Trays Market Size and Share Forecast Outlook 2025 to 2035
Food Tray Market Size and Share Forecast Outlook 2025 to 2035
Meat Trays Market Analysis - Size and Share Forecast Outlook 2025 to 2035
Key Companies & Market Share in the Food Trays Sector
CPET Trays Market
Tilt tray sorter Market
Cable Tray Market Size and Share Forecast Outlook 2025 to 2035

Thank you!
You will receive an email from our Business Development Manager. Please be sure to check your SPAM/JUNK folder too.
Chat With
MaRIA