The demand for vapour barrier in EU is expected to grow from USD 2.6 billion in 2025 to USD 4.2 billion by 2035, at a CAGR of 4.9%. Market performance shows a stronger forecast phase compared with the more moderate historical growth during 2020–2024, when construction activity was slower. Value expansion is being driven by premium laminated products with better puncture resistance, while commodity polyethylene films continue to dominate volumes due to lower cost and wide availability. Retrofit programs and stricter moisture control regulations are ensuring long-term demand stability rather than short cyclical peaks, making vapour barrier materials a consistent procurement category.
Application dynamics reveal construction as the largest user, where vapour barriers are applied in roofs, basements, walls, and floors, particularly in northern and central Europe. Automotive demand is supported by their use in cabin moisture control and acoustic insulation, while packaging applications rely on barrier films for sensitive goods. Electronics industries employ advanced laminates in device protection, and agriculture uses silage and greenhouse covers in limited but growing applications. Healthcare contributes niche demand for cleanroom environments and isolation facilities. Across end-use industries, industrial applications including commercial real estate, warehouses, and logistics hubs account for the larger proportion of demand, while consumer applications such as residential housing and DIY refurbishments represent smaller but stable contributions.
Country-level differences highlight Germany, France, and Nordic countries as leading consumers due to cold climates and strict building codes. The Netherlands and Belgium show high usage in warehousing and food logistics, while Spain, Italy, and Portugal are expanding demand in coastal residential projects. Eastern Europe, particularly Poland, Czechia, and Romania, is witnessing rapid growth from a lower base as construction and industrial projects expand, though these regions remain import dependent. Supply flows remain concentrated in Germany, France, and Italy, with major producers supplying across EU borders through hub-based distribution systems. Imports from Asia cover low-cost commodity rolls and specialized laminates, though strict CE marking and chemical compliance standards act as barriers to entry. Exports from EU producers target non-EU neighbors where European testing standards and quality certifications enhance competitiveness.
Substitution pressure exists as polyethylene films remain cost leaders, but new materials such as cross-laminated polyolefins, metallized laminates, and smart membranes with variable permeance are gaining share in high-performance buildings. Spray-applied coatings are emerging in complex geometries but face challenges with thickness consistency and verifiable performance. The balance of demand and supply is influenced not only by construction cycles but also by regulatory standards, technological shifts in barrier materials, and trade flows that reinforce intra-EU dominance while selectively engaging with external markets.
| Metric | Value |
|---|---|
| Estimated Value in (2025E) | USD 2.6 billion |
| Forecast Value in (2035F) | USD 4.2 billion |
| Forecast CAGR (2025 to 2035) | 4.9% |
Industry expansion is being supported by the steady increase in building renovation activity across European countries and the corresponding demand for reliable, durable, and code-compliant moisture management solutions with proven functionality in diverse building envelope applications. Modern building contractors rely on vapour barriers as essential building envelope components for insulation systems, wall assemblies, and roof construction, driving demand for products that match or exceed building code requirements, including appropriate permeance ratings, air leakage control, and long-term durability characteristics. Even minor envelope requirements, such as airtightness specifications, moisture control in specific climate zones, or integration with other building systems, can drive comprehensive adoption of advanced vapour barriers to maintain optimal building performance and support regulatory compliance.
The growing awareness of building energy efficiency regulations and increasing recognition of moisture management's role in preventing building envelope failures are driving demand for vapour barriers from certified suppliers with appropriate quality credentials and technical support capabilities. Regulatory authorities are increasingly establishing clear guidelines for building envelope performance, vapour barrier specifications, and installation requirements to maintain building durability and ensure energy efficiency. Scientific research studies and building science analyses are providing evidence supporting vapour barriers' performance advantages and moisture control benefits, requiring specialized manufacturing methods and standardized installation protocols for optimal moisture management, appropriate permeance selection, and quality validation, including air leakage testing and building envelope commissioning.
Sales are segmented by product type (type), application (end use), distribution channel, nature (technology), and country. By product type, demand is divided into membranes, sheet, fluid/coatings, peel & stick, and films. Based on the application, sales are categorized into insulation, waterproofing (below/above-grade), air/vapour control layers, thermal assemblies (roofs/walls), and acoustic/sound. In terms of distribution channel, demand is segmented into direct to contractor/installer, specialty distributors, and online/indirect. By nature, sales are classified into fixed-permeance barriers, variable-permeance (smart), and integrated air+vapour systems. Regionally, demand is focused on Germany, France, Italy, Spain, the Netherlands, and the Rest of Europe.
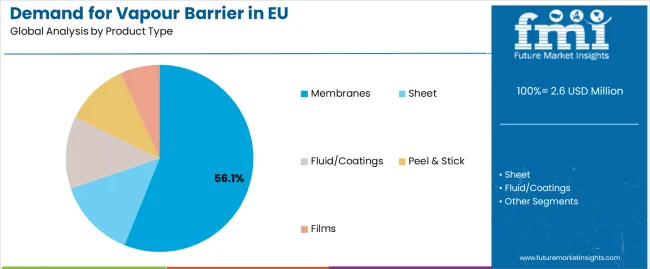
The membranes segment is projected to account for 56.1% of EU vapour barrier sales in 2025, establishing itself as the dominant product form across European markets. This commanding position is fundamentally supported by membranes' versatility in building envelope applications, comprehensive performance characteristics including controlled permeance and air leakage resistance, and superior installation flexibility supporting diverse wall, roof, and floor assemblies. The membranes format delivers exceptional reliability, providing building contractors with proven vapour control materials that facilitate insulation installation, building envelope sealing, and moisture management properties essential for energy-efficient building construction and renovation.
This segment benefits from mature manufacturing infrastructure, well-established installation methods, and extensive availability from multiple certified European building materials manufacturers who maintain rigorous quality standards and building code compliance. Membranes offer versatility across various building applications, including residential construction, commercial buildings, and institutional facilities, supported by proven installation technologies that address traditional challenges in seam sealing and penetration detailing.
The membranes segment is expected to increase to 58.0% share by 2035, demonstrating strengthening positioning as integrated membrane systems and smart vapour barriers drive adoption in high-performance building envelopes throughout the forecast period.
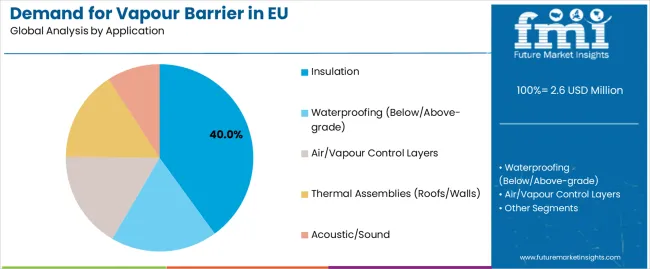
Insulation format is positioned to represent 40% of total vapour barrier demand across European markets in 2025, increasing slightly to 41.0% by 2035, reflecting the segment's dominance as the primary usage format within the industry ecosystem. This substantial share directly demonstrates that insulation represents the largest single application, with building contractors utilizing vapour barriers for insulation system protection, thermal envelope continuity, and moisture control in wall, roof, and floor insulation assemblies.
Modern building energy efficiency projects increasingly require advanced vapour barriers for insulation systems preventing moisture accumulation and condensation, driving demand for products optimized for appropriate permeance matching climate zones and insulation types, air sealing capability integrating vapour and air barrier functions, and compatibility with diverse insulation materials including fiberglass, mineral wool, and foam boards. The segment benefits from expanding building retrofit activity requiring insulation upgrades, passive house and net-zero energy building construction demanding superior envelope performance, and building code evolution requiring improved moisture management in insulated assemblies.
The segment's slightly expanding share reflects growing insulation retrofit activity and increasing insulation thickness requiring robust moisture management, with insulation maintaining dominant positioning as building energy efficiency regulations intensify throughout the forecast period.
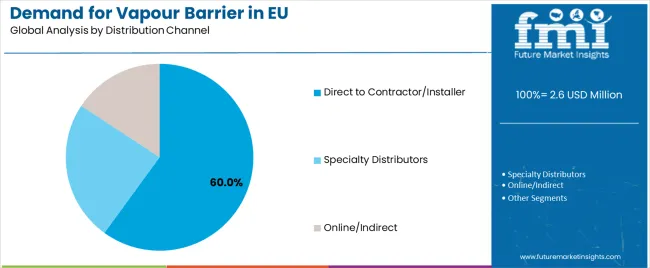
Direct to contractor/installer channels are strategically estimated to control 60% of total European vapour barrier sales in 2025, increasing to 62.0% by 2035, reflecting the critical importance of direct relationships between manufacturers and building contractors for driving product specification, technical support, and installation quality. European construction contractors, envelope specialists, and insulation installers consistently demonstrate strong preference for direct supplier relationships, delivering consistent product availability, technical support, and installation training supporting project success and building code compliance.
The segment provides essential contractor support through technical service including building science consulting, installation training programs educating contractors on proper installation methods, and product specification assistance helping contractors select appropriate products for specific applications and climate zones. Major European building contractors systematically establish direct relationships with vapour barrier manufacturers, often participating in contractor programs, receiving installation certifications, and maintaining preferred supplier status enabling consistent product sourcing and technical support access.
The segment's expanding share reflects increasing importance of technical collaboration and installation quality as building envelope performance requirements intensify, with direct contractor channels strengthening dominant positioning throughout the forecast period.
EU vapour barrier sales are advancing steadily due to expanding building renovation activity, strengthening energy efficiency regulations, and increasing adoption of high-performance building standards. The industry faces challenges, including retrofit funding uncertainty affecting project volumes, installation quality variability impacting building performance, and competing air barrier technologies offering alternative envelope solutions. Continued innovation in smart materials, integrated systems, and eco-friendly formulations remains central to industry development.
The steadily accelerating pace of European building renovation activity is fundamentally supporting vapour barrier demand as governments implement policies requiring energy efficiency improvements and building owners pursue envelope upgrades reducing energy consumption. Advanced vapour barrier technologies featuring smart permeance characteristics, integrated air sealing capabilities, and durable materials enable cost-effective building retrofits supporting European Green Deal targets and building decarbonization strategies. These renovation initiatives prove particularly important for residential building upgrades, including multi-family building envelope improvements requiring exterior insulation and vapour control systems, single-family home deep energy retrofits targeting passive house equivalent performance, and heritage building renovations balancing moisture management with preservation requirements.
Modern vapour barrier manufacturers systematically incorporate humidity-responsive technologies, including moisture-adaptive polymers, hygroscopic materials, and engineered permeance characteristics that adjust moisture diffusion rates responding to ambient conditions optimizing year-round building envelope moisture management. Strategic integration of smart technologies optimized for European climates enables manufacturers to position adaptive vapour barriers as superior solutions where seasonal moisture conditions vary significantly and fixed-permeance barriers prove suboptimal. These smart material improvements prove essential for cold climate construction where heating season vapour control must balance with summer drying potential, and for retrofit applications where existing envelope conditions create complex moisture dynamics requiring adaptive management.
European building envelope designers increasingly prioritize integrated systems combining vapour control with air barrier functionality, simplified installation details, and complete system solutions that reduce envelope complexity and improve installation quality supporting consistent building performance. This system integration trend enables vapour barrier manufacturers to develop complete envelope solutions through integrated membranes serving dual functions, coordinated accessory products including tapes and sealants, and installation systems with quality assurance protocols. System positioning proves particularly important for passive house construction where envelope airtightness directly determines certification eligibility, and for commercial building envelopes where envelope performance guarantees require coordinated system specifications.
| Country | CAGR % |
|---|---|
| Rest of Europe | 5.7% |
| Spain | 4.8% |
| Netherlands | 4.7% |
| Italy | 4.6% |
| Germany | 4.5% |
| France | 4.3% |
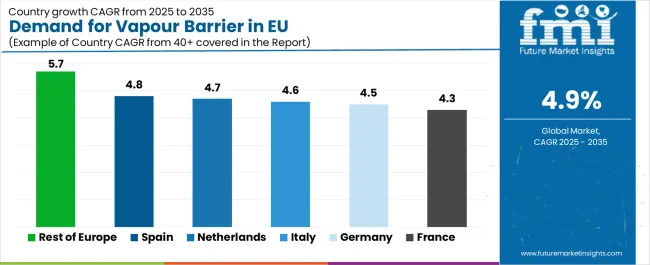
EU vapour barrier sales demonstrate steady growth across major European economies, with Rest of Europe leading expansion at 5.7% CAGR through 2035, driven by emerging renovation markets and strengthening building codes. Germany maintains leadership through established construction industry and comprehensive building standards. France benefits from renovation tax credits and growing energy efficiency awareness. Italy leverages building renovation incentives and envelope upgrade programs. Spain shows strong growth supported by construction recovery and green building initiatives. Netherlands emphasizes passive house adoption and integrated envelope systems. Sales show steady regional development reflecting EU-wide building renovation acceleration and energy efficiency regulation strengthening.
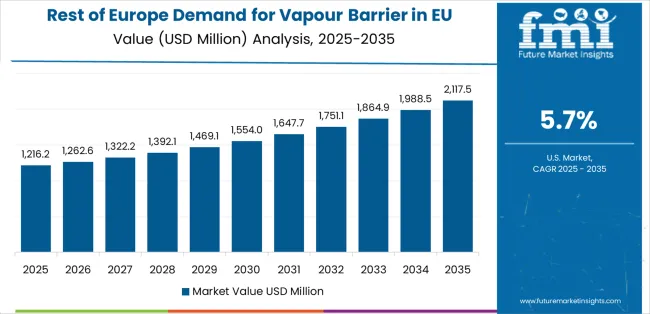
EU vapour barrier sales are projected to grow from USD 2.6 billion in 2025 to USD 4.2 billion by 2035, registering a CAGR of 4.9% over the forecast period. The Rest of Europe region is expected to demonstrate the strongest growth trajectory with a 5.7% CAGR, supported by emerging renovation activity, expanding building code requirements, and growing high-performance building adoption. Spain and the Netherlands follow with 4.8% and 4.7% CAGR each, attributed to construction market recovery and eco-friendly building emphasis, respectively.
Germany, while maintaining the largest share at 26.0% in 2025, is expected to grow at a 4.5% CAGR, reflecting market maturity and established building envelope practices. Italy and France also demonstrate 4.6% and 4.3% CAGR, respectively, supported by steady renovation activity and building energy efficiency initiatives.
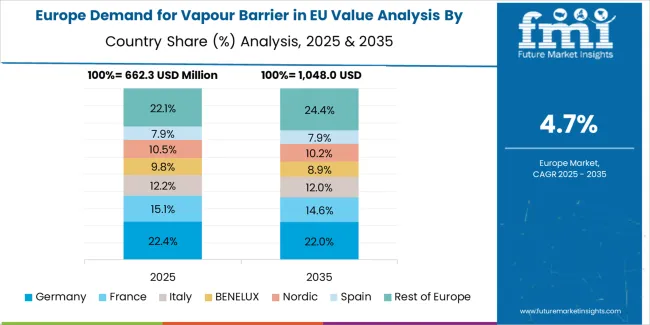
Revenue from vapour barrier in Germany is projected to exhibit steady growth with a CAGR of 4.5% through 2035, driven by exceptionally well-developed building standards, comprehensive energy efficiency regulations, and strong building science awareness throughout the country. Germany's sophisticated construction industry and internationally recognized passive house leadership are maintaining substantial demand for vapour barriers across all building envelope applications.
Major construction contractors, envelope specialists, and renovation firms systematically incorporate advanced vapour barriers into building projects, often specifying smart membranes for demanding applications and integrated systems for passive house construction. German demand benefits from extensive building retrofit programs including federal renovation funding, KfW efficiency house standards requiring superior envelope performance, and growing passive house adoption naturally supporting vapour barrier utilization across residential and commercial building sectors.
Revenue from vapour barrier in France is expanding at a CAGR of 4.3%, substantially supported by renovation tax credits emphasizing energy efficiency improvements, building energy performance requirements, and growing awareness of moisture management importance. France's evolving building regulations and energy efficiency policies are systematically driving demand for vapour barriers across renovation and new construction.
Major building contractors and renovation specialists strategically incorporate vapour barriers through RE2020 building code compliance, renovation projects utilizing MaPrimeRénov funding, and commercial building envelope upgrades supporting tertiary sector energy efficiency requirements. French sales particularly benefit from multi-family building renovation emphasis driving large-scale envelope projects, supporting vapour barrier adoption within the building envelope category. Technical education initiatives and building science advancement significantly enhance proper installation and product selection across traditional and emerging applications.
Revenue from vapour barrier in Italy is growing at a modest CAGR of 4.6%, fundamentally driven by building renovation tax incentives including Superbonus programs, growing building envelope awareness, and increasing energy efficiency requirements across Italian construction markets. Italy's substantial renovation incentive programs are systematically supporting vapour barrier adoption as building owners implement envelope upgrades qualifying for generous tax credits.
Major renovation contractors, envelope specialists, and building material distributors strategically promote vapour barriers through Superbonus-eligible envelope projects, building facade renovations incorporating exterior insulation systems, and seismic retrofits coordinating structural improvements with energy efficiency upgrades. Italian sales particularly benefit from exceptional renovation tax incentives encouraging comprehensive building envelope improvements, creating substantial demand for vapour barriers supporting insulation systems and waterproofing assemblies.
Demand for vapour barriers in Spain is projected to grow at a CAGR of 4.8%, substantially supported by the construction market recovery from previous downturns, growing eco-friendly building adoption, and strengthening building energy codes. The Spanish construction industry's gradual recovery and increasing focus on environmental performance position vapour barriers as valuable building envelope materials supporting modern construction standards.
Major construction companies and envelope contractors systematically incorporate vapour barriers through new residential construction meeting current building codes, commercial building envelope projects targeting energy efficiency certifications, and renovation activities supported by regional rehabilitation programs. Spain's recovering construction activity particularly drives vapour barrier demand through new building starts requiring code-compliant envelope systems and the growing renovation market addressing existing building stock energy performance improvements.
Demand for vapour barriers in the Netherlands is expanding at a CAGR of 4.7%, fundamentally driven by leading passive house adoption rates, comprehensive building envelope expertise, and strong environmental commitments across Dutch construction sectors. The Dutch building industry demonstrates exceptional sophistication in building science and high-performance envelope systems requiring advanced vapour barriers.
Netherlands sales significantly benefit from passive house market leadership, with the highest per-capita passive house construction rates, integrated envelope system development supporting prefabricated building solutions, and building science expertise enabling advanced moisture management system design. The country’s environmental leadership goes hand-in-hand with practical construction innovation, as Dutch contractors leverage environmental commitments while developing efficient installation methods and integrated solutions. The Netherlands also serves as a building science hub for European markets, with successful Dutch passive house and envelope innovations often expanding to broader European construction practices.
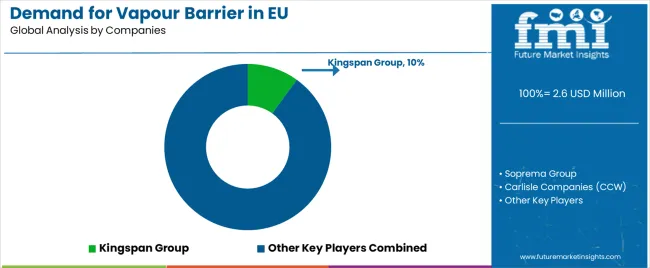
EU vapour barrier sales are defined by competition among major building materials manufacturers, specialized membrane suppliers, and integrated building envelope system providers. Companies are investing in smart material development, integrated system solutions, technical education programs, and environmental initiatives to deliver high-performance, installer-friendly, and code-compliant vapour barrier solutions. Strategic partnerships with building contractors, passive house certifications, and technical marketing emphasizing moisture management and installation quality are central to strengthening competitive position.
Major participants include Kingspan Group with an estimated 10.0% share, leveraging its integrated building envelope systems, strong specification presence, and comprehensive insulation and membrane portfolio, supporting consistent supply to contractors across Europe. Kingspan benefits from integrated product offerings combining insulation with vapour control, technical support capabilities, and the ability to provide complete envelope solutions with building science guidance, enabling customer project success and building code compliance. Soprema Group holds approximately 7.5% share, emphasizing comprehensive breadth across self-adhered membranes, fluid-applied systems, and sheet products serving diverse waterproofing and vapour barrier applications. Soprema's success in waterproofing market segments and technical product development creates strong competitive positioning across residential and commercial construction, supported by European manufacturing presence and technical service capabilities.
Carlisle Companies (CCW division) accounts for roughly 6.5% share through its position as roofing and below-grade waterproofing supplier, providing vapour barrier products integrated within waterproofing systems featuring strong contractor networks and technical support. The company benefits from waterproofing market presence, contractor relationships, and integrated system offerings supporting building envelope projects requiring coordinated moisture management solutions. Saint-Gobain (including GCP products) represents approximately 5.0% share, leveraging European distribution networks, comprehensive building materials portfolio, and certification presence supporting vapour barrier specification across diverse building types. Saint-Gobain benefits from distribution channel access, multi-product offering synergies, and technical resources supporting contractor product selection and installation guidance.
BASF SE accounts for roughly 4.0% share through its functional polymers expertise, low-VOC formulation focus, and chemical technology capabilities supporting innovative vapour barrier materials. The company benefits from polymer science leadership, environmental positioning through low-emission products, and technical collaboration supporting advanced material development. Other companies and regional suppliers collectively hold 67.5% share, reflecting the fragmented nature of European vapour barrier sales, where numerous regional building materials manufacturers, specialty membrane suppliers, waterproofing companies, and distribution-focused brands serve specific market segments, regional customers, and niche applications.
| Item | Value |
|---|---|
| Quantitative Units | USD 4.2 billion |
| Product Type (Type) | Membranes, Sheet, Fluid/Coatings, Peel & Stick, Films |
| Application (End Use) | Insulation, Waterproofing (Below/Above-grade), Air/Vapour Control Layers, Thermal Assemblies (Roofs/Walls), Acoustic/Sound |
| Distribution Channel | Direct to Contractor/Installer, Specialty Distributors, Online/Indirect |
| Nature (Technology) | Fixed-Permeance Barriers, Variable-Permeance (Smart), Integrated Air+Vapour Systems |
| Forecast Period | 2025 to 2035 |
| Base Year | 2025 |
| Historical Data | 2020 to 2024 |
| Countries Covered | Germany, France, Italy, Spain, the Netherlands, and the Rest of Europe |
| Key Companies Profiled | Kingspan Group, Soprema Group, Carlisle Companies, Saint-Gobain, BASF SE, Regional manufacturers |
| Report Pages | 180+ Pages |
| Data Tables | 50+ Tables and Figures |
| Additional Attributes | Dollar sales by product type (type), application (end use), distribution channel, and nature (technology); regional demand trends across major European markets; competitive landscape analysis with established building materials manufacturers and specialty suppliers; customer preferences for various vapour barrier types and performance characteristics; integration with building renovation programs and passive house standards; innovations in smart materials and integrated systems; adoption across residential, commercial, and institutional construction; regulatory framework analysis for building codes and energy efficiency standards; supply chain strategies; and penetration analysis for contractors and building designers across European markets. |
The global demand for vapour barrier in eu is estimated to be valued at USD 2.6 billion in 2025.
The market size for the demand for vapour barrier in eu is projected to reach USD 4.2 billion by 2035.
The demand for vapour barrier in eu is expected to grow at a 4.9% CAGR between 2025 and 2035.
The key product types in demand for vapour barrier in eu are membranes, sheet, fluid/coatings, peel & stick and films.
In terms of application, insulation segment to command 40.0% share in the demand for vapour barrier in eu in 2025.


Our Research Products

The "Full Research Suite" delivers actionable market intel, deep dives on markets or technologies, so clients act faster, cut risk, and unlock growth.

The Leaderboard benchmarks and ranks top vendors, classifying them as Established Leaders, Leading Challengers, or Disruptors & Challengers.

Locates where complements amplify value and substitutes erode it, forecasting net impact by horizon

We deliver granular, decision-grade intel: market sizing, 5-year forecasts, pricing, adoption, usage, revenue, and operational KPIs—plus competitor tracking, regulation, and value chains—across 60 countries broadly.

Spot the shifts before they hit your P&L. We track inflection points, adoption curves, pricing moves, and ecosystem plays to show where demand is heading, why it is changing, and what to do next across high-growth markets and disruptive tech

Real-time reads of user behavior. We track shifting priorities, perceptions of today’s and next-gen services, and provider experience, then pace how fast tech moves from trial to adoption, blending buyer, consumer, and channel inputs with social signals (#WhySwitch, #UX).

Partner with our analyst team to build a custom report designed around your business priorities. From analysing market trends to assessing competitors or crafting bespoke datasets, we tailor insights to your needs.
Supplier Intelligence
Discovery & Profiling
Capacity & Footprint
Performance & Risk
Compliance & Governance
Commercial Readiness
Who Supplies Whom
Scorecards & Shortlists
Playbooks & Docs
Category Intelligence
Definition & Scope
Demand & Use Cases
Cost Drivers
Market Structure
Supply Chain Map
Trade & Policy
Operating Norms
Deliverables
Buyer Intelligence
Account Basics
Spend & Scope
Procurement Model
Vendor Requirements
Terms & Policies
Entry Strategy
Pain Points & Triggers
Outputs
Pricing Analysis
Benchmarks
Trends
Should-Cost
Indexation
Landed Cost
Commercial Terms
Deliverables
Brand Analysis
Positioning & Value Prop
Share & Presence
Customer Evidence
Go-to-Market
Digital & Reputation
Compliance & Trust
KPIs & Gaps
Outputs
Full Research Suite comprises of:
Market outlook & trends analysis
Interviews & case studies
Strategic recommendations
Vendor profiles & capabilities analysis
5-year forecasts
8 regions and 60+ country-level data splits
Market segment data splits
12 months of continuous data updates
DELIVERED AS:
PDF EXCEL ONLINE
Vapour Barrier Market Size and Share Forecast Outlook 2025 to 2035
Market Share Distribution Among Europe Barrier Coated Paper Companies
Western Europe Barrier Coated Paper Market by Material, Coating, Application, End user, and Country 2025 to 2035
High Barrier Pharmaceutical Packaging Films for Blister Market Size and Share Forecast Outlook 2025 to 2035
Europe Barrier Packaging Market Growth – Demand & Forecast 2024-2034
Barrier Coated Paper Industry Analysis in Europe - Demand, Growth & Future Outlook 2025 to 2035
High Barrier Packaging Films for Pharmaceuticals Market Size and Share Forecast Outlook 2025 to 2035
Competitive Landscape of High Barrier Packaging Films for Pharmaceuticals
Europe Radiotherapy Patient Positioning Market Size and Share Forecast Outlook 2025 to 2035
Barrier System Market Forecast Outlook 2025 to 2035
Europe Polyvinyl Alcohol Industry Analysis Size and Share Forecast Outlook 2025 to 2035
Europe Cruise Market Forecast and Outlook 2025 to 2035
Europium Market Forecast and Outlook 2025 to 2035
Barrier Packaging Market Size and Share Forecast Outlook 2025 to 2035
Barrier Coated Papers Market Size and Share Forecast Outlook 2025 to 2035
Barrier Tube Packaging Market Size and Share Forecast Outlook 2025 to 2035
Vapour Recovery Units Market Size and Share Forecast Outlook 2025 to 2035
Eucommia Leaf Extract Market Size and Share Forecast Outlook 2025 to 2035
Europe Massage Therapy Service Market Size and Share Forecast Outlook 2025 to 2035
Europe Cement Market Analysis Size and Share Forecast Outlook 2025 to 2035

Thank you!
You will receive an email from our Business Development Manager. Please be sure to check your SPAM/JUNK folder too.
Chat With
MaRIA