Methodology

Barrier System Market Size and Share Forecast Outlook From 2025 to 2035

The barrier system market is expanding steadily, driven by increased infrastructure development, road safety initiatives, and growing urban transportation networks. Rising incidences of road accidents and stricter government regulations on traffic safety have accelerated demand for advanced barrier installations. Modern designs integrating high-impact resistance, corrosion protection, and modular assembly have enhanced performance and maintenance efficiency.

The market is also supported by technological innovations such as energy-absorbing mechanisms and smart monitoring features. Infrastructure investment in highways, bridges, and urban transit corridors is providing consistent growth momentum.

Additionally, public-private partnerships in infrastructure safety enhancement projects are encouraging wider adoption. With the continued prioritization of roadway safety and infrastructure resilience, the market is expected to maintain strong growth prospects globally..
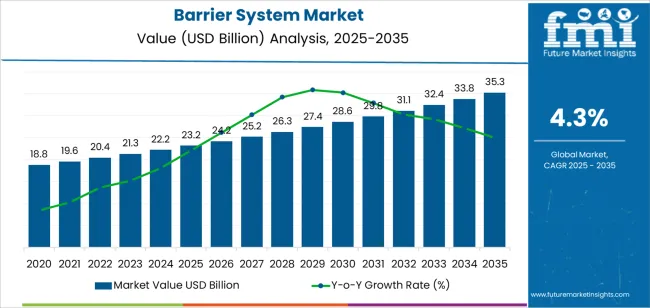
Quick Stats for Barrier System Market

  • Barrier System Market Industry Value (2025): USD 23.2 billion
  • Barrier System Market Forecast Value (2035): USD 35.3 billion
  • Barrier System Market Forecast CAGR: 4.3%
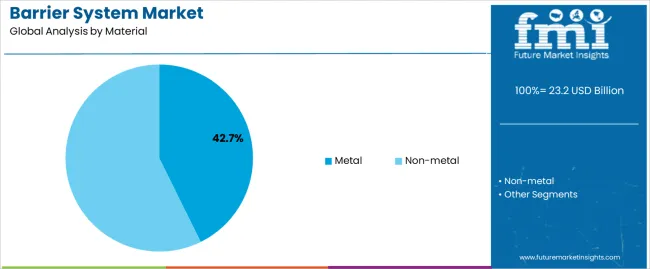
  • Leading Segment in Barrier System Market in 2025: Metal (42.7%)
  • Key Growth Region in Barrier System Market: North America, Asia-Pacific, Europe
  • Top Key Players in Barrier System Market: Richel Group SA, Valmont Structures Pvt Ltd, Lindsay Corporation, Avon Barriers Corporation Limited, Barrier 1 Systems, Hill & Smith Ltd, Deltabloc International GmbH, Global Grab Technologies Inc, Tata Steel Group, Bekaert

Barrier System Market Market Value Analysis

Metric Value
Barrier System Market Estimated Value in (2025 E) USD 23.2 billion
Barrier System Market Forecast Value in (2035 F) USD 35.3 billion
Forecast CAGR (2025 to 2035) 4.3%

Segmental Analysis

The market is segmented by Material, Application, Device Type, and Technology and region. By Material, the market is divided into Metal and Non-metal. In terms of Application, the market is classified into Roadways, Airports, Railways, and Others. Based on Device Type, the market is segmented into Crash Barrier Systems, Fences, Bollards, Gate, and Drop Arms. By Technology, the market is divided into Semi-rigid, Rigid, and Flexible. Regionally, the market is classified into North America, Latin America, Western Europe, Eastern Europe, Balkan & Baltic Countries, Russia & Belarus, Central Asia, East Asia, South Asia & Pacific, and the Middle East & Africa.
Insights into the Metal Segment

Barrier System Market Analysis By Material

The metal segment leads the material category with approximately 42.7% share, driven by its superior strength, durability, and cost-effectiveness. Metal barriers, particularly galvanized steel and aluminum, are widely used due to their ability to withstand high-impact collisions and environmental stress.

The segment’s popularity is reinforced by established standards for road safety compliance and widespread contractor familiarity. Manufacturers are focusing on corrosion-resistant coatings and modular assembly systems to enhance service life and reduce maintenance costs.

The recyclability of metal barriers also contributes to sustainability objectives, making them favorable in public infrastructure projects. With ongoing highway expansion and bridge reinforcement initiatives worldwide, the metal segment is projected to sustain its dominance over the forecast period..
Insights into the Roadways Segment

Barrier System Market Analysis By Application

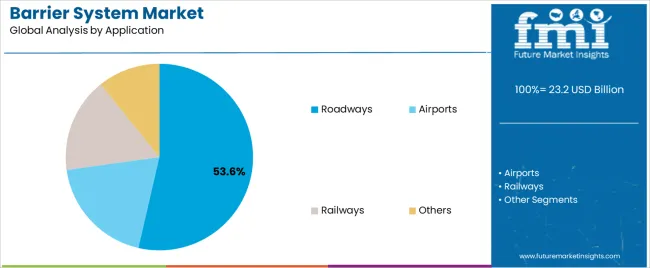
The roadways segment dominates the application category, accounting for approximately 53.6% share of the barrier system market. This segment’s growth is underpinned by increasing investments in road expansion, maintenance, and safety improvement programs.

Government policies prioritizing the reduction of vehicular fatalities have driven large-scale installations of crash barriers, guardrails, and median separators. The segment benefits from continuous technological improvements that enhance energy absorption and minimize post-impact damage.

Urbanization and rising vehicular density have further strengthened the need for advanced roadway safety infrastructure. With the expansion of expressways and urban corridors, the roadways segment is expected to remain the principal application area for barrier systems globally..
Insights into the Crash Barrier Systems Segment

Barrier System Market Analysis By Device Type

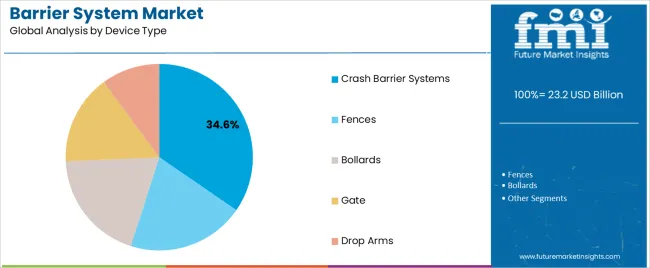
The crash barrier systems segment holds approximately 34.6% share in the device type category, supported by its essential role in preventing vehicle run-offs and reducing collision severity. These systems are extensively deployed along highways, bridges, and tunnels to enhance occupant safety.

The segment benefits from continuous design innovations, including flexible and semi-rigid configurations that improve energy dissipation during impacts. Regulatory emphasis on standardized crash performance testing has ensured consistent quality across deployments.

Moreover, the integration of smart sensors and connected monitoring systems is improving real-time safety management. With growing infrastructure development and increasing road traffic volumes, crash barrier systems are expected to sustain their leading market position through the forecast period..

Top Market Trends and Industry Highlights in the Barrier System Sector

  • Rapid urbanization and infrastructure development projects worldwide are driving the adoption of barrier systems for traffic management, crowd control, and protection of public spaces.
  • Barrier system manufacturers offer customizable and modular solutions catering to diverse application requirements.
  • Growing environmental awareness is prompting manufacturers to develop eco-friendly barrier materials and energy-efficient operation modes.

Comparison of Historical vs Future Outlook on Changing Consumer Trends for Barrier Systems

Between 2020 and 2025, the barrier system market ecosystem experienced a CAGR of 6%. This robust growth can be attributed to several factors, including increasing industrialization, stringent safety regulations, and technological advancements driving the adoption of more sophisticated barrier systems. Industries sought to enhance workplace safety and security, leading to a significant demand for these solutions during this period.

Looking ahead to the forecasted period of 2025 to 2035, the market is anticipated to exhibit a slightly lower CAGR of 4.3%. Several factors contribute to this moderated growth rate.

These may include market saturation in certain regions or industries, a slowdown in industrial growth rates, or a shift in focus towards other areas of industrial automation.

Advancements in alternative security technologies or economic factors could influence the demand for barrier systems during this period. Despite the slightly reduced growth rate, the market is still expected to expand steadily, driven by ongoing industrialization efforts and continued emphasis on safety and security in industrial environments.

Historical CAGR from 2020 to 2025 6%
Forecast CAGR from 2025 to 2035 4.3%

Factors Driving the Demand for Barrier System Installations

  • Increasing industrial activities drive the demand for barrier system to ensure safety and security in manufacturing plants, warehouses, and other industrial settings.
  • Innovations in barrier system technology, such as remote monitoring capabilities and integration with automation systems, enhance their effectiveness and utility in industrial environments.
  • Urban development and infrastructure projects drive the need for traffic management solutions, including barriers, to regulate vehicular and pedestrian movement efficiently.

Factors Restraining the Growth of the Barrier System Market

  • The initial investment and ongoing maintenance costs associated with barrier systems can be prohibitive for some businesses, especially small and medium-sized enterprises (SMEs).
  • Integrating opportunities of barrier systems with existing infrastructure and automation systems may pose technical challenges and require specialized expertise, potentially slowing adoption.
  • Some industries may lack awareness regarding the benefits of barrier systems or may underestimate the importance of investing in adequate security measures, hindering market growth.

Analysis of Top Countries, Implementing and Regulating Barrier Systems

The provided table highlights the top five countries in terms of revenue, with South Korea leading the list.

The country boasts a robust technology sector and is home to several leading manufacturers specializing in barrier system technology. This proximity allows the companies of South Korea to leverage the latest materials, sensors, automation, and software advancements.

It gives them a competitive edge in developing cutting-edge barrier solutions that meet the evolving needs of industries worldwide.

Countries Forecast CAGRs from 2025 to 2035
The United States 4.6%
China 4.9%
Japan 6%
South Korea 6.6%
The United Kingdom 5.5%

Industrial Facilities and Transportation Drive the United States Market

In the United States, the market finds extensive use across various sectors, including industrial facilities, transportation infrastructure, commercial properties, and public spaces.

Manufacturing, logistics, and warehousing industries rely on barrier systems for access control, perimeter security, and worker safety. Barrier systems are widely deployed in transportation hubs, parking facilities, and event venues to manage traffic flow, enhance security, and ensure crowd control.

Urban Infrastructure and Commercial Properties Boosts the Market in China

The rapid urbanization and infrastructure development of the country drive the market. Barrier systems are extensively utilized in transportation infrastructure projects, including highways, railways, airports, and urban metro systems, to regulate traffic flow, enhance road safety, and manage vehicle access.

Barrier systems are deployed in commercial and residential properties for perimeter security, access control, and crowd management.
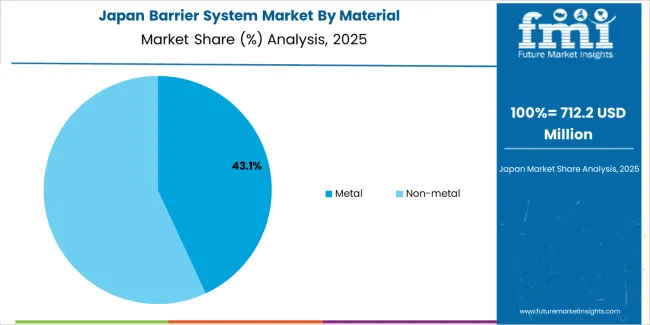
Industrial Safety and Technological Innovation Inhibits Growth in Japan

Barrier System Market Japan Market Share Analysis By Material

The market in Japan is primarily used in industrial facilities, manufacturing plants, and logistics centers to ensure workplace safety, control access to restricted areas, and protect assets.

With a focus on technological innovation and automation, barrier systems incorporate advanced features such as IoT integration, automated operation, and real-time monitoring. Barrier systems are employed in public spaces, parking facilities, and transportation hubs to manage traffic and control crowds.
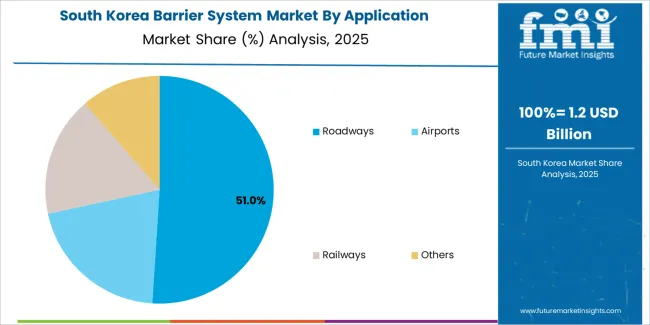
Technological Advancements and Industrial Automation Fuels the Market in South Korea

Barrier System Market South Korea Market Share Analysis By Application

The advanced technological capabilities drive the market in South Korea and focus on innovation. Barrier systems are extensively utilized in industrial automation, manufacturing facilities, and logistics centers to ensure workplace safety, regulate access, and optimize operational efficiency.

The manufacturers lead the development of cutting-edge barrier solutions incorporating AI, IoT, and automation technologies. For traffic management and security, barriers are deployed in public infrastructure projects, including transportation hubs and smart city initiatives.

Transportation Networks and Public Venues Surge the Market Growth in the United Kingdom

In the United Kingdom, the market is widely used across diverse sectors, including transportation, retail, hospitality, and critical infrastructure. Barrier systems are employed in transportation networks, including roads, railways, and airports, to manage traffic flow, enhance safety, and mitigate security risks.

Barrier systems are utilized in commercial properties, public venues, and events for access control, crowd management, and perimeter security. With the increasing emphasis on smart city initiatives and urban development projects, barrier systems are crucial in enhancing public safety and security in the United Kingdom.Top of Form

Barrier System Industry Analysis by Top Investment Segments

The below section shows the leading segment. Based on material, the metal segment is projected to register at a CAGR of 4.1% by 2035. Based on application, the roadways segment is anticipated to expand at a CAGR of 3.8% by 2035.

Metal barriers offer robust protection against various threats such as vehicle impacts, unauthorized access, and vandalism. Barrier systems deployed along roadways play a crucial role in achieving these objectives by providing physical separation between opposing traffic lanes, guiding vehicles safely through construction zones, and protecting vulnerable road users such as pedestrians and cyclists.

Category CAGR from 2025 to 2035
Metal 4.1%
Roadways 3.8%

Metal Segment to Hold a Significant Share in the Market

The metal segment, which pertains to barriers constructed primarily from metal materials, is projected to lead with a CAGR of 4.1% by 2035. This growth is attributed to the durability, strength, and versatility of metal barriers, making them ideal for various industrial, commercial, and infrastructure applications.

Metal barriers offer robust protection against unauthorized access, vehicular collisions, and security threats, thus witnessing sustained demand across manufacturing, transportation, and utilities.

Roadways Segment to Hold a Dominant Share in the Market

In terms of application, the roadways segment is expected to be the leading segment, with an anticipated CAGR of 3.8% by 2035. This growth can be attributed to increasing investments in transportation infrastructure projects globally and growing concerns regarding road safety and traffic management.

Barrier systems deployed along roadways mitigate the risk of accidents, control traffic flow, and enhance overall road safety for motorists and pedestrians. Roadway barriers are essential for delineating lanes, directing traffic during construction activities, and providing protection against roadside hazards, contributing to their significant market demand and expansion.
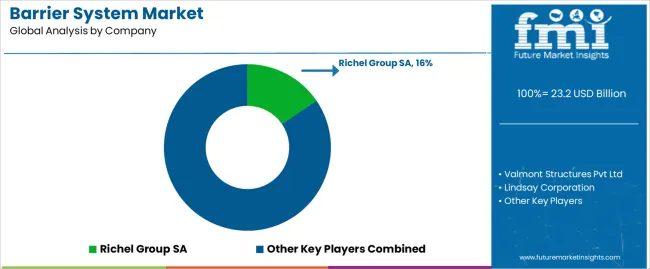
Key Players and Market Concentration in the Barrier System Market

Barrier System Market Analysis By Company

The competitive landscape of the barrier system market is characterized by the presence of several key players competing for market share. Leading companies in the market focus on product innovation, strategic partnerships, and expansion into emerging markets to gain a competitive edge. These companies offer diverse barrier solutions tailored to specific industry requirements, including industrial, transportation, commercial, and residential sectors.

Some of the Key Developments

  • In 2024, a leading Perimeter protection group acquired Avon Barrier, a global provider of vehicle barrier solutions, to bolster its access control and perimeter security offerings. This strategic move aims to expand the Perimeter Protection Group's global market presence.
  • In 2024, Lindsay Corporation introduced ABSORB-M, an innovative water-filled and non-redirected crash barrier system. This solution is ideal for narrow areas with limited roads and workspace.

Scope and Coverage of the Barrier System Market Report

  • Adjacent Study on Barrier System Market, Crash Barrier System Market
  • Opportunity Analysis of Barrier System Market
  • Barrier System Market Trends
  • United States Industrial Barrier System Market
  • Competitive Analysis of Top Barrier Systems and Support Companies

Key Shifting Preferences Covered in the Barrier System Market Report

Attributes Details
Estimated Market Size in 2025 USD 23.2 billion
Projected Market Valuation in 2035 USD 35.3 billion
Value-based CAGR 2025 to 2035 4.3%
Forecast Period 2025 to 2035
Historical Data Available for 2020 to 2025
Market Analysis Value in USD billion
Key Regions Covered North America; Latin America; Europe; East Asia; South Asia; Oceania; Middle East and Africa
Key Market Segments Covered Material, Application, Device Type, Technology, Region
Key Countries Profiled The United States, Canada, Brazil, Mexico, Germany, Italy, France, United Kingdom, Spain, Russia, BENELUX, China, Japan, South Korea, India, Thailand, Malaysia, Indonesia, Australia, New Zealand, GCC countries
Key Companies Profiled Gramm Barriers Systems Limited; Valmont Structures Pvt Ltd; Lindsay Corporation; Avon Barriers Corporation Limited; Barrier 1 Systems; Hill & Smith Ltd; Deltabloc International GmbH; Global Grab Technologies Inc; Tata Steel Group; Bekaert

Top Segments Studied in the Barrier System Market

By Material:

  • Metal
  • Non-metal

By Application:

  • Roadways
  • Airports
  • Railways
  • Others

By Device Type:

  • Fences
  • Bollards
  • Gate
  • Crash Barrier Systems
  • Drop arms

By Technology:

  • Rigid
  • Semi-rigid
  • Flexible

By Region:

  • North America
  • Latin America
  • Europe
  • East Asia
  • South Asia
  • Oceania
  • Middle East and Africa

Frequently Asked Questions

How big is the barrier system market in 2025?

The global barrier system market is estimated to be valued at USD 23.2 billion in 2025.

What will be the size of barrier system market in 2035?

The market size for the barrier system market is projected to reach USD 35.3 billion by 2035.

How much will be the barrier system market growth between 2025 and 2035?

The barrier system market is expected to grow at a 4.3% CAGR between 2025 and 2035.

What are the key product types in the barrier system market?

The key product types in barrier system market are metal and non-metal.

Which application segment to contribute significant share in the barrier system market in 2025?

In terms of application, roadways segment to command 53.6% share in the barrier system market in 2025.

Table of Content

  1. Executive Summary
    • Global Market Outlook
    • Demand to side Trends
    • Supply to side Trends
    • Technology Roadmap Analysis
    • Analysis and Recommendations
  2. Market Overview
    • Market Coverage / Taxonomy
    • Market Definition / Scope / Limitations
  3. Market Background
    • Market Dynamics
      • Drivers
      • Restraints
      • Opportunity
      • Trends
    • Scenario Forecast
      • Demand in Optimistic Scenario
      • Demand in Likely Scenario
      • Demand in Conservative Scenario
    • Opportunity Map Analysis
    • Product Life Cycle Analysis
    • Supply Chain Analysis
    • Investment Feasibility Matrix
    • Value Chain Analysis
    • PESTLE and Porter’s Analysis
    • Regulatory Landscape
    • Regional Parent Market Outlook
    • Production and Consumption Statistics
    • Import and Export Statistics
  4. Global Market Analysis 2020 to 2024 and Forecast, 2025 to 2035
    • Historical Market Size Value (USD Million) Analysis, 2020 to 2024
    • Current and Future Market Size Value (USD Million) Projections, 2025 to 2035
      • Y to o to Y Growth Trend Analysis
      • Absolute $ Opportunity Analysis
  5. Global Market Pricing Analysis 2020 to 2024 and Forecast 2025 to 2035
  6. Global Market Analysis 2020 to 2024 and Forecast 2025 to 2035, By Material
    • Introduction / Key Findings
    • Historical Market Size Value (USD Million) Analysis By Material , 2020 to 2024
    • Current and Future Market Size Value (USD Million) Analysis and Forecast By Material , 2025 to 2035
      • Metal
      • Non-metal
    • Y to o to Y Growth Trend Analysis By Material , 2020 to 2024
    • Absolute $ Opportunity Analysis By Material , 2025 to 2035
  7. Global Market Analysis 2020 to 2024 and Forecast 2025 to 2035, By Application
    • Introduction / Key Findings
    • Historical Market Size Value (USD Million) Analysis By Application, 2020 to 2024
    • Current and Future Market Size Value (USD Million) Analysis and Forecast By Application, 2025 to 2035
      • Roadways
      • Airports
      • Railways
      • Others
    • Y to o to Y Growth Trend Analysis By Application, 2020 to 2024
    • Absolute $ Opportunity Analysis By Application, 2025 to 2035
  8. Global Market Analysis 2020 to 2024 and Forecast 2025 to 2035, By Device Type
    • Introduction / Key Findings
    • Historical Market Size Value (USD Million) Analysis By Device Type, 2020 to 2024
    • Current and Future Market Size Value (USD Million) Analysis and Forecast By Device Type, 2025 to 2035
      • Crash Barrier Systems
      • Fences
      • Bollards
      • Gate
      • Drop Arms
    • Y to o to Y Growth Trend Analysis By Device Type, 2020 to 2024
    • Absolute $ Opportunity Analysis By Device Type, 2025 to 2035
  9. Global Market Analysis 2020 to 2024 and Forecast 2025 to 2035, By Technology
    • Introduction / Key Findings
    • Historical Market Size Value (USD Million) Analysis By Technology, 2020 to 2024
    • Current and Future Market Size Value (USD Million) Analysis and Forecast By Technology, 2025 to 2035
      • Semi-rigid
      • Rigid
      • Flexible
    • Y to o to Y Growth Trend Analysis By Technology, 2020 to 2024
    • Absolute $ Opportunity Analysis By Technology, 2025 to 2035
  10. Global Market Analysis 2020 to 2024 and Forecast 2025 to 2035, By Region
    • Introduction
    • Historical Market Size Value (USD Million) Analysis By Region, 2020 to 2024
    • Current Market Size Value (USD Million) Analysis and Forecast By Region, 2025 to 2035
      • North America
      • Latin America
      • Western Europe
      • Eastern Europe
      • East Asia
      • South Asia and Pacific
      • Middle East & Africa
    • Market Attractiveness Analysis By Region
  11. North America Market Analysis 2020 to 2024 and Forecast 2025 to 2035, By Country
    • Historical Market Size Value (USD Million) Trend Analysis By Market Taxonomy, 2020 to 2024
    • Market Size Value (USD Million) Forecast By Market Taxonomy, 2025 to 2035
      • By Country
        • USA
        • Canada
        • Mexico
      • By Material
      • By Application
      • By Device Type
      • By Technology
    • Market Attractiveness Analysis
      • By Country
      • By Material
      • By Application
      • By Device Type
      • By Technology
    • Key Takeaways
  12. Latin America Market Analysis 2020 to 2024 and Forecast 2025 to 2035, By Country
    • Historical Market Size Value (USD Million) Trend Analysis By Market Taxonomy, 2020 to 2024
    • Market Size Value (USD Million) Forecast By Market Taxonomy, 2025 to 2035
      • By Country
        • Brazil
        • Chile
        • Rest of Latin America
      • By Material
      • By Application
      • By Device Type
      • By Technology
    • Market Attractiveness Analysis
      • By Country
      • By Material
      • By Application
      • By Device Type
      • By Technology
    • Key Takeaways
  13. Western Europe Market Analysis 2020 to 2024 and Forecast 2025 to 2035, By Country
    • Historical Market Size Value (USD Million) Trend Analysis By Market Taxonomy, 2020 to 2024
    • Market Size Value (USD Million) Forecast By Market Taxonomy, 2025 to 2035
      • By Country
        • Germany
        • UK
        • Italy
        • Spain
        • France
        • Nordic
        • BENELUX
        • Rest of Western Europe
      • By Material
      • By Application
      • By Device Type
      • By Technology
    • Market Attractiveness Analysis
      • By Country
      • By Material
      • By Application
      • By Device Type
      • By Technology
    • Key Takeaways
  14. Eastern Europe Market Analysis 2020 to 2024 and Forecast 2025 to 2035, By Country
    • Historical Market Size Value (USD Million) Trend Analysis By Market Taxonomy, 2020 to 2024
    • Market Size Value (USD Million) Forecast By Market Taxonomy, 2025 to 2035
      • By Country
        • Russia
        • Poland
        • Hungary
        • Balkan & Baltic
        • Rest of Eastern Europe
      • By Material
      • By Application
      • By Device Type
      • By Technology
    • Market Attractiveness Analysis
      • By Country
      • By Material
      • By Application
      • By Device Type
      • By Technology
    • Key Takeaways
  15. East Asia Market Analysis 2020 to 2024 and Forecast 2025 to 2035, By Country
    • Historical Market Size Value (USD Million) Trend Analysis By Market Taxonomy, 2020 to 2024
    • Market Size Value (USD Million) Forecast By Market Taxonomy, 2025 to 2035
      • By Country
        • China
        • Japan
        • South Korea
      • By Material
      • By Application
      • By Device Type
      • By Technology
    • Market Attractiveness Analysis
      • By Country
      • By Material
      • By Application
      • By Device Type
      • By Technology
    • Key Takeaways
  16. South Asia and Pacific Market Analysis 2020 to 2024 and Forecast 2025 to 2035, By Country
    • Historical Market Size Value (USD Million) Trend Analysis By Market Taxonomy, 2020 to 2024
    • Market Size Value (USD Million) Forecast By Market Taxonomy, 2025 to 2035
      • By Country
        • India
        • ASEAN
        • Australia & New Zealand
        • Rest of South Asia and Pacific
      • By Material
      • By Application
      • By Device Type
      • By Technology
    • Market Attractiveness Analysis
      • By Country
      • By Material
      • By Application
      • By Device Type
      • By Technology
    • Key Takeaways
  17. Middle East & Africa Market Analysis 2020 to 2024 and Forecast 2025 to 2035, By Country
    • Historical Market Size Value (USD Million) Trend Analysis By Market Taxonomy, 2020 to 2024
    • Market Size Value (USD Million) Forecast By Market Taxonomy, 2025 to 2035
      • By Country
        • Kingdom of Saudi Arabia
        • Other GCC Countries
        • Turkiye
        • South Africa
        • Other African Union
        • Rest of Middle East & Africa
      • By Material
      • By Application
      • By Device Type
      • By Technology
    • Market Attractiveness Analysis
      • By Country
      • By Material
      • By Application
      • By Device Type
      • By Technology
    • Key Takeaways
  18. Key Countries Market Analysis
    • USA
      • Pricing Analysis
      • Market Share Analysis, 2024
        • By Material
        • By Application
        • By Device Type
        • By Technology
    • Canada
      • Pricing Analysis
      • Market Share Analysis, 2024
        • By Material
        • By Application
        • By Device Type
        • By Technology
    • Mexico
      • Pricing Analysis
      • Market Share Analysis, 2024
        • By Material
        • By Application
        • By Device Type
        • By Technology
    • Brazil
      • Pricing Analysis
      • Market Share Analysis, 2024
        • By Material
        • By Application
        • By Device Type
        • By Technology
    • Chile
      • Pricing Analysis
      • Market Share Analysis, 2024
        • By Material
        • By Application
        • By Device Type
        • By Technology
    • Germany
      • Pricing Analysis
      • Market Share Analysis, 2024
        • By Material
        • By Application
        • By Device Type
        • By Technology
    • UK
      • Pricing Analysis
      • Market Share Analysis, 2024
        • By Material
        • By Application
        • By Device Type
        • By Technology
    • Italy
      • Pricing Analysis
      • Market Share Analysis, 2024
        • By Material
        • By Application
        • By Device Type
        • By Technology
    • Spain
      • Pricing Analysis
      • Market Share Analysis, 2024
        • By Material
        • By Application
        • By Device Type
        • By Technology
    • France
      • Pricing Analysis
      • Market Share Analysis, 2024
        • By Material
        • By Application
        • By Device Type
        • By Technology
    • India
      • Pricing Analysis
      • Market Share Analysis, 2024
        • By Material
        • By Application
        • By Device Type
        • By Technology
    • ASEAN
      • Pricing Analysis
      • Market Share Analysis, 2024
        • By Material
        • By Application
        • By Device Type
        • By Technology
    • Australia & New Zealand
      • Pricing Analysis
      • Market Share Analysis, 2024
        • By Material
        • By Application
        • By Device Type
        • By Technology
    • China
      • Pricing Analysis
      • Market Share Analysis, 2024
        • By Material
        • By Application
        • By Device Type
        • By Technology
    • Japan
      • Pricing Analysis
      • Market Share Analysis, 2024
        • By Material
        • By Application
        • By Device Type
        • By Technology
    • South Korea
      • Pricing Analysis
      • Market Share Analysis, 2024
        • By Material
        • By Application
        • By Device Type
        • By Technology
    • Russia
      • Pricing Analysis
      • Market Share Analysis, 2024
        • By Material
        • By Application
        • By Device Type
        • By Technology
    • Poland
      • Pricing Analysis
      • Market Share Analysis, 2024
        • By Material
        • By Application
        • By Device Type
        • By Technology
    • Hungary
      • Pricing Analysis
      • Market Share Analysis, 2024
        • By Material
        • By Application
        • By Device Type
        • By Technology
    • Kingdom of Saudi Arabia
      • Pricing Analysis
      • Market Share Analysis, 2024
        • By Material
        • By Application
        • By Device Type
        • By Technology
    • Turkiye
      • Pricing Analysis
      • Market Share Analysis, 2024
        • By Material
        • By Application
        • By Device Type
        • By Technology
    • South Africa
      • Pricing Analysis
      • Market Share Analysis, 2024
        • By Material
        • By Application
        • By Device Type
        • By Technology
  19. Market Structure Analysis
    • Competition Dashboard
    • Competition Benchmarking
    • Market Share Analysis of Top Players
      • By Regional
      • By Material
      • By Application
      • By Device Type
      • By Technology
  20. Competition Analysis
    • Competition Deep Dive
      • Richel Group SA
        • Overview
        • Product Portfolio
        • Profitability by Market Segments (Product/Age /Sales Channel/Region)
        • Sales Footprint
        • Strategy Overview
          • Marketing Strategy
          • Product Strategy
          • Channel Strategy
      • Valmont Structures Pvt Ltd
      • Lindsay Corporation
      • Avon Barriers Corporation Limited
      • Barrier 1 Systems
      • Hill & Smith Ltd
      • Deltabloc International GmbH
      • Global Grab Technologies Inc
      • Tata Steel Group
      • Bekaert
  21. Assumptions & Acronyms Used
  22. Research Methodology

List of Tables

  • Table 1: Global Market Value (USD Million) Forecast by Region, 2020 to 2035
  • Table 2: Global Market Value (USD Million) Forecast by Material , 2020 to 2035
  • Table 3: Global Market Value (USD Million) Forecast by Application, 2020 to 2035
  • Table 4: Global Market Value (USD Million) Forecast by Device Type, 2020 to 2035
  • Table 5: Global Market Value (USD Million) Forecast by Technology, 2020 to 2035
  • Table 6: North America Market Value (USD Million) Forecast by Country, 2020 to 2035
  • Table 7: North America Market Value (USD Million) Forecast by Material , 2020 to 2035
  • Table 8: North America Market Value (USD Million) Forecast by Application, 2020 to 2035
  • Table 9: North America Market Value (USD Million) Forecast by Device Type, 2020 to 2035
  • Table 10: North America Market Value (USD Million) Forecast by Technology, 2020 to 2035
  • Table 11: Latin America Market Value (USD Million) Forecast by Country, 2020 to 2035
  • Table 12: Latin America Market Value (USD Million) Forecast by Material , 2020 to 2035
  • Table 13: Latin America Market Value (USD Million) Forecast by Application, 2020 to 2035
  • Table 14: Latin America Market Value (USD Million) Forecast by Device Type, 2020 to 2035
  • Table 15: Latin America Market Value (USD Million) Forecast by Technology, 2020 to 2035
  • Table 16: Western Europe Market Value (USD Million) Forecast by Country, 2020 to 2035
  • Table 17: Western Europe Market Value (USD Million) Forecast by Material , 2020 to 2035
  • Table 18: Western Europe Market Value (USD Million) Forecast by Application, 2020 to 2035
  • Table 19: Western Europe Market Value (USD Million) Forecast by Device Type, 2020 to 2035
  • Table 20: Western Europe Market Value (USD Million) Forecast by Technology, 2020 to 2035
  • Table 21: Eastern Europe Market Value (USD Million) Forecast by Country, 2020 to 2035
  • Table 22: Eastern Europe Market Value (USD Million) Forecast by Material , 2020 to 2035
  • Table 23: Eastern Europe Market Value (USD Million) Forecast by Application, 2020 to 2035
  • Table 24: Eastern Europe Market Value (USD Million) Forecast by Device Type, 2020 to 2035
  • Table 25: Eastern Europe Market Value (USD Million) Forecast by Technology, 2020 to 2035
  • Table 26: East Asia Market Value (USD Million) Forecast by Country, 2020 to 2035
  • Table 27: East Asia Market Value (USD Million) Forecast by Material , 2020 to 2035
  • Table 28: East Asia Market Value (USD Million) Forecast by Application, 2020 to 2035
  • Table 29: East Asia Market Value (USD Million) Forecast by Device Type, 2020 to 2035
  • Table 30: East Asia Market Value (USD Million) Forecast by Technology, 2020 to 2035
  • Table 31: South Asia and Pacific Market Value (USD Million) Forecast by Country, 2020 to 2035
  • Table 32: South Asia and Pacific Market Value (USD Million) Forecast by Material , 2020 to 2035
  • Table 33: South Asia and Pacific Market Value (USD Million) Forecast by Application, 2020 to 2035
  • Table 34: South Asia and Pacific Market Value (USD Million) Forecast by Device Type, 2020 to 2035
  • Table 35: South Asia and Pacific Market Value (USD Million) Forecast by Technology, 2020 to 2035
  • Table 36: Middle East & Africa Market Value (USD Million) Forecast by Country, 2020 to 2035
  • Table 37: Middle East & Africa Market Value (USD Million) Forecast by Material , 2020 to 2035
  • Table 38: Middle East & Africa Market Value (USD Million) Forecast by Application, 2020 to 2035
  • Table 39: Middle East & Africa Market Value (USD Million) Forecast by Device Type, 2020 to 2035
  • Table 40: Middle East & Africa Market Value (USD Million) Forecast by Technology, 2020 to 2035

List of Figures

  • Figure 1: Global Market Pricing Analysis
  • Figure 2: Global Market Value (USD Million) Forecast 2020-2035
  • Figure 3: Global Market Value Share and BPS Analysis by Material , 2025 and 2035
  • Figure 4: Global Market Y to o to Y Growth Comparison by Material , 2025-2035
  • Figure 5: Global Market Attractiveness Analysis by Material
  • Figure 6: Global Market Value Share and BPS Analysis by Application, 2025 and 2035
  • Figure 7: Global Market Y to o to Y Growth Comparison by Application, 2025-2035
  • Figure 8: Global Market Attractiveness Analysis by Application
  • Figure 9: Global Market Value Share and BPS Analysis by Device Type, 2025 and 2035
  • Figure 10: Global Market Y to o to Y Growth Comparison by Device Type, 2025-2035
  • Figure 11: Global Market Attractiveness Analysis by Device Type
  • Figure 12: Global Market Value Share and BPS Analysis by Technology, 2025 and 2035
  • Figure 13: Global Market Y to o to Y Growth Comparison by Technology, 2025-2035
  • Figure 14: Global Market Attractiveness Analysis by Technology
  • Figure 15: Global Market Value (USD Million) Share and BPS Analysis by Region, 2025 and 2035
  • Figure 16: Global Market Y to o to Y Growth Comparison by Region, 2025-2035
  • Figure 17: Global Market Attractiveness Analysis by Region
  • Figure 18: North America Market Incremental Dollar Opportunity, 2025-2035
  • Figure 19: Latin America Market Incremental Dollar Opportunity, 2025-2035
  • Figure 20: Western Europe Market Incremental Dollar Opportunity, 2025-2035
  • Figure 21: Eastern Europe Market Incremental Dollar Opportunity, 2025-2035
  • Figure 22: East Asia Market Incremental Dollar Opportunity, 2025-2035
  • Figure 23: South Asia and Pacific Market Incremental Dollar Opportunity, 2025-2035
  • Figure 24: Middle East & Africa Market Incremental Dollar Opportunity, 2025-2035
  • Figure 25: North America Market Value Share and BPS Analysis by Country, 2025 and 2035
  • Figure 26: North America Market Value Share and BPS Analysis by Material , 2025 and 2035
  • Figure 27: North America Market Y to o to Y Growth Comparison by Material , 2025-2035
  • Figure 28: North America Market Attractiveness Analysis by Material
  • Figure 29: North America Market Value Share and BPS Analysis by Application, 2025 and 2035
  • Figure 30: North America Market Y to o to Y Growth Comparison by Application, 2025-2035
  • Figure 31: North America Market Attractiveness Analysis by Application
  • Figure 32: North America Market Value Share and BPS Analysis by Device Type, 2025 and 2035
  • Figure 33: North America Market Y to o to Y Growth Comparison by Device Type, 2025-2035
  • Figure 34: North America Market Attractiveness Analysis by Device Type
  • Figure 35: North America Market Value Share and BPS Analysis by Technology, 2025 and 2035
  • Figure 36: North America Market Y to o to Y Growth Comparison by Technology, 2025-2035
  • Figure 37: North America Market Attractiveness Analysis by Technology
  • Figure 38: Latin America Market Value Share and BPS Analysis by Country, 2025 and 2035
  • Figure 39: Latin America Market Value Share and BPS Analysis by Material , 2025 and 2035
  • Figure 40: Latin America Market Y to o to Y Growth Comparison by Material , 2025-2035
  • Figure 41: Latin America Market Attractiveness Analysis by Material
  • Figure 42: Latin America Market Value Share and BPS Analysis by Application, 2025 and 2035
  • Figure 43: Latin America Market Y to o to Y Growth Comparison by Application, 2025-2035
  • Figure 44: Latin America Market Attractiveness Analysis by Application
  • Figure 45: Latin America Market Value Share and BPS Analysis by Device Type, 2025 and 2035
  • Figure 46: Latin America Market Y to o to Y Growth Comparison by Device Type, 2025-2035
  • Figure 47: Latin America Market Attractiveness Analysis by Device Type
  • Figure 48: Latin America Market Value Share and BPS Analysis by Technology, 2025 and 2035
  • Figure 49: Latin America Market Y to o to Y Growth Comparison by Technology, 2025-2035
  • Figure 50: Latin America Market Attractiveness Analysis by Technology
  • Figure 51: Western Europe Market Value Share and BPS Analysis by Country, 2025 and 2035
  • Figure 52: Western Europe Market Value Share and BPS Analysis by Material , 2025 and 2035
  • Figure 53: Western Europe Market Y to o to Y Growth Comparison by Material , 2025-2035
  • Figure 54: Western Europe Market Attractiveness Analysis by Material
  • Figure 55: Western Europe Market Value Share and BPS Analysis by Application, 2025 and 2035
  • Figure 56: Western Europe Market Y to o to Y Growth Comparison by Application, 2025-2035
  • Figure 57: Western Europe Market Attractiveness Analysis by Application
  • Figure 58: Western Europe Market Value Share and BPS Analysis by Device Type, 2025 and 2035
  • Figure 59: Western Europe Market Y to o to Y Growth Comparison by Device Type, 2025-2035
  • Figure 60: Western Europe Market Attractiveness Analysis by Device Type
  • Figure 61: Western Europe Market Value Share and BPS Analysis by Technology, 2025 and 2035
  • Figure 62: Western Europe Market Y to o to Y Growth Comparison by Technology, 2025-2035
  • Figure 63: Western Europe Market Attractiveness Analysis by Technology
  • Figure 64: Eastern Europe Market Value Share and BPS Analysis by Country, 2025 and 2035
  • Figure 65: Eastern Europe Market Value Share and BPS Analysis by Material , 2025 and 2035
  • Figure 66: Eastern Europe Market Y to o to Y Growth Comparison by Material , 2025-2035
  • Figure 67: Eastern Europe Market Attractiveness Analysis by Material
  • Figure 68: Eastern Europe Market Value Share and BPS Analysis by Application, 2025 and 2035
  • Figure 69: Eastern Europe Market Y to o to Y Growth Comparison by Application, 2025-2035
  • Figure 70: Eastern Europe Market Attractiveness Analysis by Application
  • Figure 71: Eastern Europe Market Value Share and BPS Analysis by Device Type, 2025 and 2035
  • Figure 72: Eastern Europe Market Y to o to Y Growth Comparison by Device Type, 2025-2035
  • Figure 73: Eastern Europe Market Attractiveness Analysis by Device Type
  • Figure 74: Eastern Europe Market Value Share and BPS Analysis by Technology, 2025 and 2035
  • Figure 75: Eastern Europe Market Y to o to Y Growth Comparison by Technology, 2025-2035
  • Figure 76: Eastern Europe Market Attractiveness Analysis by Technology
  • Figure 77: East Asia Market Value Share and BPS Analysis by Country, 2025 and 2035
  • Figure 78: East Asia Market Value Share and BPS Analysis by Material , 2025 and 2035
  • Figure 79: East Asia Market Y to o to Y Growth Comparison by Material , 2025-2035
  • Figure 80: East Asia Market Attractiveness Analysis by Material
  • Figure 81: East Asia Market Value Share and BPS Analysis by Application, 2025 and 2035
  • Figure 82: East Asia Market Y to o to Y Growth Comparison by Application, 2025-2035
  • Figure 83: East Asia Market Attractiveness Analysis by Application
  • Figure 84: East Asia Market Value Share and BPS Analysis by Device Type, 2025 and 2035
  • Figure 85: East Asia Market Y to o to Y Growth Comparison by Device Type, 2025-2035
  • Figure 86: East Asia Market Attractiveness Analysis by Device Type
  • Figure 87: East Asia Market Value Share and BPS Analysis by Technology, 2025 and 2035
  • Figure 88: East Asia Market Y to o to Y Growth Comparison by Technology, 2025-2035
  • Figure 89: East Asia Market Attractiveness Analysis by Technology
  • Figure 90: South Asia and Pacific Market Value Share and BPS Analysis by Country, 2025 and 2035
  • Figure 91: South Asia and Pacific Market Value Share and BPS Analysis by Material , 2025 and 2035
  • Figure 92: South Asia and Pacific Market Y to o to Y Growth Comparison by Material , 2025-2035
  • Figure 93: South Asia and Pacific Market Attractiveness Analysis by Material
  • Figure 94: South Asia and Pacific Market Value Share and BPS Analysis by Application, 2025 and 2035
  • Figure 95: South Asia and Pacific Market Y to o to Y Growth Comparison by Application, 2025-2035
  • Figure 96: South Asia and Pacific Market Attractiveness Analysis by Application
  • Figure 97: South Asia and Pacific Market Value Share and BPS Analysis by Device Type, 2025 and 2035
  • Figure 98: South Asia and Pacific Market Y to o to Y Growth Comparison by Device Type, 2025-2035
  • Figure 99: South Asia and Pacific Market Attractiveness Analysis by Device Type
  • Figure 100: South Asia and Pacific Market Value Share and BPS Analysis by Technology, 2025 and 2035
  • Figure 101: South Asia and Pacific Market Y to o to Y Growth Comparison by Technology, 2025-2035
  • Figure 102: South Asia and Pacific Market Attractiveness Analysis by Technology
  • Figure 103: Middle East & Africa Market Value Share and BPS Analysis by Country, 2025 and 2035
  • Figure 104: Middle East & Africa Market Value Share and BPS Analysis by Material , 2025 and 2035
  • Figure 105: Middle East & Africa Market Y to o to Y Growth Comparison by Material , 2025-2035
  • Figure 106: Middle East & Africa Market Attractiveness Analysis by Material
  • Figure 107: Middle East & Africa Market Value Share and BPS Analysis by Application, 2025 and 2035
  • Figure 108: Middle East & Africa Market Y to o to Y Growth Comparison by Application, 2025-2035
  • Figure 109: Middle East & Africa Market Attractiveness Analysis by Application
  • Figure 110: Middle East & Africa Market Value Share and BPS Analysis by Device Type, 2025 and 2035
  • Figure 111: Middle East & Africa Market Y to o to Y Growth Comparison by Device Type, 2025-2035
  • Figure 112: Middle East & Africa Market Attractiveness Analysis by Device Type
  • Figure 113: Middle East & Africa Market Value Share and BPS Analysis by Technology, 2025 and 2035
  • Figure 114: Middle East & Africa Market Y to o to Y Growth Comparison by Technology, 2025-2035
  • Figure 115: Middle East & Africa Market Attractiveness Analysis by Technology
  • Figure 116: Global Market - Tier Structure Analysis
  • Figure 117: Global Market - Company Share Analysis
Dashboard
Dashboard
Dashboard
Dashboard
Dashboard
Dashboard

Our Research Products

Full Research Suite

The "Full Research Suite" delivers actionable market intel, deep dives on markets or technologies, so clients act faster, cut risk, and unlock growth.

Competitor Leaderboard Report

The Leaderboard benchmarks and ranks top vendors, classifying them as Established Leaders, Leading Challengers, or Disruptors & Challengers.

Future Leaders Index

Locates where complements amplify value and substitutes erode it, forecasting net impact by horizon

Market Data & Forecasts

We deliver granular, decision-grade intel: market sizing, 5-year forecasts, pricing, adoption, usage, revenue, and operational KPIs—plus competitor tracking, regulation, and value chains—across 60 countries broadly.

Market Focus Report

Spot the shifts before they hit your P&L. We track inflection points, adoption curves, pricing moves, and ecosystem plays to show where demand is heading, why it is changing, and what to do next across high-growth markets and disruptive tech

Survey Report

Real-time reads of user behavior. We track shifting priorities, perceptions of today’s and next-gen services, and provider experience, then pace how fast tech moves from trial to adoption, blending buyer, consumer, and channel inputs with social signals (#WhySwitch, #UX).

Bespoke Reports

Partner with our analyst team to build a custom report designed around your business priorities. From analysing market trends to assessing competitors or crafting bespoke datasets, we tailor insights to your needs.

Supplier Intelligence

Discovery & Profiling

Capacity & Footprint

Performance & Risk

Compliance & Governance

Commercial Readiness

Who Supplies Whom

Scorecards & Shortlists

Playbooks & Docs

Category Intelligence

Definition & Scope

Demand & Use Cases

Cost Drivers

Market Structure

Supply Chain Map

Trade & Policy

Operating Norms

Deliverables

Buyer Intelligence

Account Basics

Spend & Scope

Procurement Model

Vendor Requirements

Terms & Policies

Entry Strategy

Pain Points & Triggers

Outputs

Pricing Analysis

Benchmarks

Trends

Should-Cost

Indexation

Landed Cost

Commercial Terms

Deliverables

Brand Analysis

Positioning & Value Prop

Share & Presence

Customer Evidence

Go-to-Market

Digital & Reputation

Compliance & Trust

KPIs & Gaps

Outputs

Full Research Suite comprises of:

Market outlook & trends analysis

Market outlook & trends analysis

Interviews & case studies

Interviews & case studies

Strategic recommendations

Strategic recommendations

Vendor profiles & capabilities analysis

Vendor profiles & capabilities analysis

5-year forecasts

5-year forecasts

8 regions and 60+ country-level data splits

8 regions and 60+ country-level data splits

Market segment data splits

Market segment data splits

12 months of continuous data updates

12 months of continuous data updates

DELIVERED AS:

PDF EXCEL ONLINE

Full Research Suite


$5000

$7500

$10000

Buy Report Now
Similar Industry Reports

Similar Industry Reports

Vehicle Barrier System Market

Vehicle Barrier System Market Size and Share Forecast Outlook 2025 to 2035

Barrier Packaging Market

Barrier Packaging Market Size and Share Forecast Outlook 2025 to 2035

Barrier Coated Papers Market

Barrier Coated Papers Market Size and Share Forecast Outlook 2025 to 2035

Barrier Tube Packaging Market

Barrier Tube Packaging Market Size and Share Forecast Outlook 2025 to 2035

Barrier Resins Market

Barrier Resins Market Size and Share Forecast Outlook 2025 to 2035

System-On-Package Market

System-On-Package Market Size and Share Forecast Outlook 2025 to 2035

Barrier Material Market

Barrier Material Market Size and Share Forecast Outlook 2025 to 2035

Systems Administration Management Tools Market

Systems Administration Management Tools Market Size and Share Forecast Outlook 2025 to 2035

Barrier Shrink Bags Market

Barrier Shrink Bags Market Analysis - Size, Share, and Forecast 2025 to 2035

Barrier Coated Paper Industry Analysis in Europe

Barrier Coated Paper Industry Analysis in Europe - Demand, Growth & Future Outlook 2025 to 2035

Systemic Sclerosis Treatment Market

Systemic Sclerosis Treatment Market - Trends & Forecast 2025 to 2035

System on Module Market

System on Module Market Growth – Trends & Forecast 2025 to 2035

Barrier Shrink Bags Market Share Analysis

Market Share Insights for Barrier Shrink Bag Providers

Barrier Coated Papers Market Share Analysis

Key Players & Market Share in the Barrier Coated Paper Industry

Barrier Coatings for Packaging Market

Barrier Coatings for Packaging Market Trends - Growth & Forecast 2025 to 2035

Barrier Packaging Market Share Analysis

Competitive Landscape of Barrier Packaging Providers

Barrier Film Market
Barrier Film Market

Barrier Film Market Trends & Industry Growth Forecast 2025 to 2035

Systemic Lupus Erythematosus SLE Drugs Market

SLE Drugs Market Insights - Growth & Forecast 2025 to 2035

Barrier Packaging Industry Analysis in Europe

Europe Barrier Packaging Market Growth – Demand & Forecast 2024-2034

Barrier Coated Paper Industry Analysis in Japan

Japan Barrier Coated Paper Market Growth – Trends & Forecast 2023-2033

Future Market Insights

Barrier System Market

Chat With MaRIA

Chat With

MaRIA

Hi There, I am MaRIA, Your Market Research Intelligence Assistant. How may I help you?