The barrier tube packaging market is valued at USD 3.8 billion in 2025 and is projected to reach USD 7.9 billion by 2035, rising at a 7.8% CAGR, with growth accelerating as pharmaceutical, cosmetic, and oral care formulations become more sensitive to oxygen, moisture, and contamination risks. As manufacturers introduce more dermatological treatments, premium skincare products, nutraceutical gels, and active oral care formulations, the need for packaging that preserves potency and prevents ingredient degradation intensifies.
Barrier tubes gain preference because multilayer laminate structures, often integrating aluminum foil or metallized films, provide strong protection while supporting hygienic dispensing, portability, and compatibility with automated filling lines. Plastic laminate tubes hold the leading material share at 46%, driven by their balance of barrier strength, cost-efficiency, and suitability for high-volume healthcare and personal care production. Pharmaceuticals and healthcare applications represent 39% of total demand, as topical drugs, ointments, medicated gels, and dermaceutical products require packaging that maintains active ingredient stability across extended shelf-life periods.
Geographically, India (9.8%) and China (8.7%) lead expansion due to large-scale pharmaceutical output, rising cosmetic consumption, and domestic production capabilities supporting laminate tube manufacturing. The United States (7.2%), Germany (6.4%), and Japan (5.9%) demonstrate steady adoption driven by strict packaging integrity standards, premium cosmetic product launches, and the need for validated barrier performance in regulated healthcare markets.
Competitive dynamics are shaped by companies with deep expertise in lamination, foil barrier integration, and closure engineering, Albéa Group, Essel Propack, CCL Industries, Montebello Packaging, and Hoffmann Neopac maintain advantage through advanced multilayer structures, validated pharmaceutical-grade tubes, and specialized child-resistant and tamper-evident closure systems. The emerging competitive focus is shifting toward recyclable mono-material tube development, high-barrier laminate innovation, and closures engineered for both safety and user-controlled dispensing rather than simple cost competition.
Material trends show plastic laminate tubes holding the largest share at 46%, reflecting their balance of strength, design flexibility, and cost-effectiveness. These tubes, often incorporating aluminum foil or metallized layers, remain the preferred option for medicines, premium cosmetics, and toothpastes requiring tight barrier control. On the application side, pharmaceuticals and healthcare continue to dominate with a 39% share due to the growing need for topical formulations, medicated creams, and prescription dermatology products packaged in hygienic, protective formats.
Companies like Albéa, Essel Propack, Montebello Packaging, and Hoffmann Neopac are investing in advanced laminates, precision closures, and recyclable material innovations to differentiate their offerings. As product formulations become more sensitive and regulatory expectations increase, the value proposition of barrier tubes is shifting from simple containment to an essential enabler of product safety, shelf stability, and brand positioning.
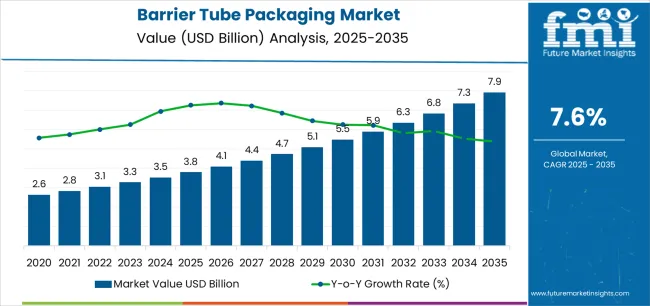
| Metric | Value |
|---|---|
| Estimated Value in (2025E) | USD 3.8 billion |
| Forecast Value in (2035F) | USD 7.9 billion |
| Forecast CAGR (2025 to 2035) | 7.8% |
Market expansion is being supported by the increasing global demand for pharmaceutical topical formulations and the corresponding need for packaging solutions that can provide superior moisture and oxygen barrier properties while enabling precise dosing and hygienic dispensing across various healthcare and personal care applications.
Modern pharmaceutical and cosmetic manufacturers are increasingly focused on implementing packaging solutions that can protect sensitive active ingredients, prevent contamination, and provide consistent product performance throughout extended shelf life requirements.
Barrier tube packaging's proven ability to deliver exceptional protection against environmental factors, enable controlled product release, and support brand differentiation make it essential packaging formats for contemporary pharmaceutical and premium cosmetic product launches.
The growing emphasis on product quality preservation and consumer convenience is driving demand for barrier tubes that can support extended shelf life requirements, improve product stability, and enable user-friendly application formats. Manufacturers' preference for packaging that combines high barrier performance with processing efficiency and design flexibility is creating opportunities for innovative barrier tube implementations. The rising influence of dermatological product development and specialty oral care formulation is also contributing to increased demand for barrier tubes that can provide moisture protection, flavor preservation, and active ingredient stability.
The barrier tube packaging market is poised for rapid growth and transformation. As industries across pharmaceuticals, cosmetics, oral care, food supplements, and personal care seek packaging that delivers exceptional barrier protection, product preservation, and consumer convenience, barrier tubes are gaining prominence not just as commodity packaging but as strategic enablers of product differentiation and formulation protection.
Rising pharmaceutical consumption in Asia-Pacific and expanding premium cosmetics markets globally amplify demand, while manufacturers are leveraging innovations in multi-layer laminate structures, metallized film technologies, and functional closure development.
Pathways like specialty barrier coatings, child-resistant closures, and application-specific customization promise strong margin uplift, especially in high-value segments. Geographic expansion and vertical integration will capture volume, particularly where local manufacturing capabilities and supply chain proximity are critical. Regulatory pressures around pharmaceutical packaging integrity, cosmetic product safety, oral care product efficacy, and food supplement preservation give structural support.
The market is segmented by material type, application, capacity, barrier type, closure type, and region. By material type, the market is divided into plastic (laminate tubes), aluminum, and others. By application, it covers pharmaceuticals & healthcare, cosmetics & personal care, oral care, food & nutraceuticals, and others.
By capacity, the market is segmented into small (below 50ml), medium (50-100ml), and large (above 100ml). The barrier type includes aluminum foil barrier, metallized barrier, and polymer barrier. By closure type, it is categorized into screw caps, flip-top caps, nozzle caps, and others.
By distribution channel, the market includes direct sales, distributors, and contract manufacturers. Regionally, the market is divided into North America, Europe, East Asia, South Asia & Pacific, Latin America, and the Middle East & Africa.
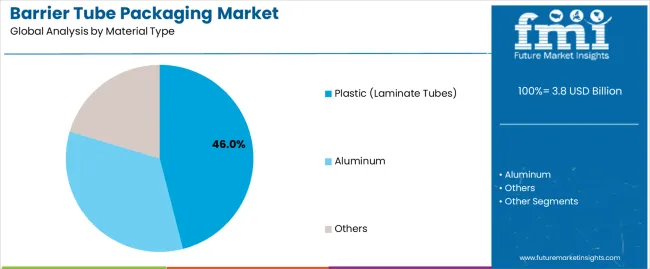
The plastic tubes segment is projected to account for 46% of the barrier tube packaging market in 2025, reaffirming its position as the leading material category. Pharmaceutical and cosmetic manufacturers increasingly utilize plastic laminate tubes for their superior barrier properties when combined with aluminum foil or metallized layers, excellent formulation compatibility, and cost-effectiveness in applications ranging from topical medications to premium skincare products. Plastic tube technology's advanced lamination capabilities and consistent quality output directly address the industrial requirements for reliable moisture and oxygen protection in high-volume production environments.
This material segment forms the foundation of modern pharmaceutical and cosmetic packaging operations, as it represents the tube type with the greatest versatility and established market demand across multiple application categories and industry sectors. Manufacturer investments in enhanced barrier layer technologies and closure system capabilities continue to strengthen adoption among pharmaceutical and cosmetic producers.
With companies prioritizing product preservation and dispensing convenience, plastic laminate tubes align with both protective performance requirements and cost optimization objectives, making them the central component of comprehensive packaging strategies.
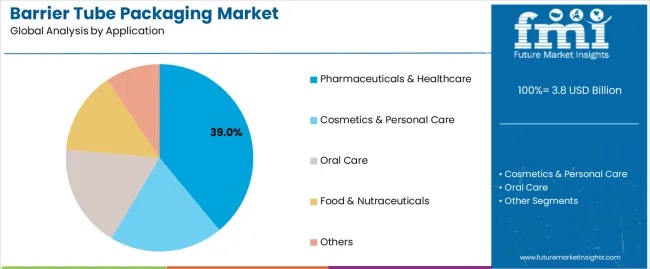
Pharmaceuticals & healthcare applications are projected to represent 39.0% of barrier tube demand in 2025, underscoring their critical role as the primary industrial consumers of specialized barrier tube packaging for topical medications, dermatological preparations, and therapeutic formulations.
Pharmaceutical manufacturers prefer barrier tubes for their exceptional moisture protection capabilities, oxygen barrier performance, and ability to maintain product stability while ensuring hygienic dispensing. Positioned as essential packaging formats for modern pharmaceutical product launches, barrier tubes offer both preservation advantages and patient convenience benefits.
The segment is supported by continuous innovation in multi-layer laminate technologies and the growing availability of specialized closure systems that enable child-resistant packaging with enhanced product protection and tamper-evidence. Additionally, pharmaceutical manufacturers are investing in supply chain partnerships to support large-volume tube procurement and quality assurance.
As specialty dermatological products demand becomes more prevalent and pharmaceutical formulation complexity increases, pharmaceuticals & healthcare applications will continue to dominate the end-use market while supporting advanced barrier technology utilization and product innovation strategies.
The barrier tube packaging market is advancing rapidly due to increasing demand for pharmaceutical topical formulations and growing adoption of high-barrier packaging solutions that provide superior moisture and oxygen protection while enabling convenient product dispensing across diverse healthcare and personal care applications.
However, the market faces challenges, including raw material cost fluctuations, stringent regulatory requirements for pharmaceutical contact materials, and the need for specialized lamination equipment investments. Innovation in barrier layer technologies and recyclable tube development continues to influence product development and market expansion patterns.
The growing adoption of five-layer and seven-layer tube structures, aluminum foil integration, and metallized film technologies is enabling tube manufacturers to produce premium barrier tubes with superior oxygen transmission rate control, enhanced moisture protection, and specialized chemical resistance functionalities.
Advanced laminate systems provide improved product preservation while allowing more efficient processing and consistent output across various tube sizes and applications. Manufacturers are increasingly recognizing the competitive advantages of sophisticated barrier layer capabilities for product differentiation and premium market positioning.
Modern barrier tube producers are incorporating child-resistant screw caps, tamper-evident seals, and controlled dispensing mechanisms to enhance product safety, enable regulatory compliance, and deliver value-added solutions to pharmaceutical and healthcare customers.
These technologies improve consumer protection while enabling new market segments, including prescription topical medications, therapeutic oral care products, and regulated pharmaceutical preparations. Advanced closure integration also allows manufacturers to support premium product positioning and application development beyond traditional commodity tube supply.
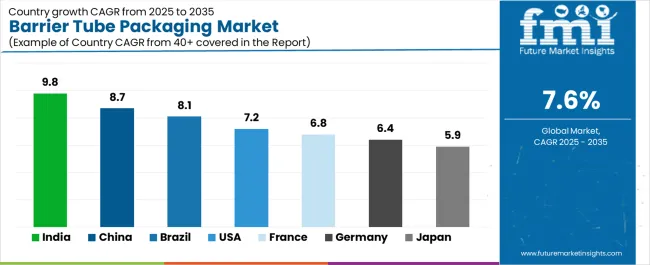
| Country | CAGR (2025 to 2035) |
|---|---|
| India | 9.8% |
| China | 8.7% |
| USA | 7.2% |
| Brazil | 8.1% |
| Germany | 6.4% |
| Japan | 5.9% |
| France | 6.8% |
The barrier tube packaging market is experiencing strong growth globally, with India leading at a 9.8% CAGR through 2035, driven by the expanding pharmaceutical manufacturing sector, growing cosmetics consumption, and significant investment in personal care product development infrastructure. China follows at 8.7%, supported by rapid pharmaceutical production growth, increasing premium cosmetics demand, and growing domestic manufacturing capabilities.
The USA shows growth at 7.2%, emphasizing pharmaceutical innovation and specialty dermatological product development. Brazil records 8.1%, focusing on cosmetics market expansion and oral care product manufacturing. Germany demonstrates 6.4% growth, prioritizing pharmaceutical quality standards and advanced packaging technology excellence.
Japan exhibits 5.9% growth, emphasizing precision manufacturing and quality tube production. France shows 6.8% growth, supported by luxury cosmetics demand and pharmaceutical manufacturing concentration.
The report covers an in-depth analysis of 40+ countries top-performing countries are highlighted below.
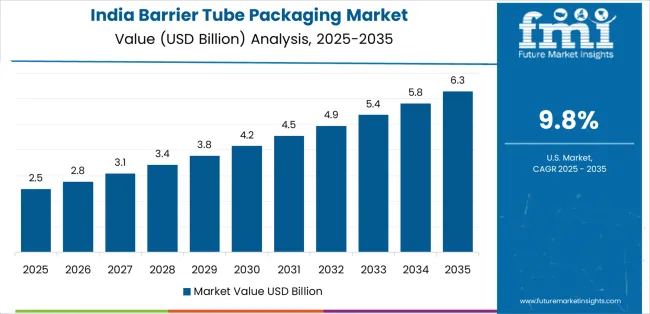
Revenue from barrier tube packaging in India is projected to exhibit exceptional growth with a CAGR of 9.8% through 2035, driven by expanding pharmaceutical production capacity and rapidly growing cosmetics consumption supported by government initiatives promoting domestic manufacturing development. The country's strong position in global generic pharmaceutical production and increasing investment in personal care manufacturing are creating substantial demand for high-barrier tube solutions. Major pharmaceutical companies and cosmetic manufacturers are establishing comprehensive barrier tube sourcing capabilities to serve both domestic demand and export markets.
Revenue from barrier tube packaging in China is expanding at a CAGR of 8.7%, supported by the country's growing pharmaceutical production sector, expanding cosmetics manufacturing capacity, and increasing adoption of premium packaging solutions.
The country's government initiatives promoting quality manufacturing and growing middle-class consumption are driving requirements for sophisticated barrier tube capabilities. International suppliers and domestic manufacturers are establishing extensive production and distribution capabilities to address the growing demand for barrier tube products.
Revenue from barrier tube packaging in the USA is expanding at a CAGR of 7.2%, supported by the country's advanced pharmaceutical development capabilities, strong emphasis on specialty dermatological products, and robust demand for high-performance packaging in healthcare and premium cosmetics applications.
The nation's mature pharmaceutical sector and high-value product focus are driving sophisticated barrier tube capabilities throughout the supply chain. Leading manufacturers and technology providers are investing extensively in advanced laminate technologies and closure system development to serve both domestic and export markets.
Revenue from barrier tube packaging in Brazil is growing at a CAGR of 8.1%, driven by the country's vibrant cosmetics industry, expanding oral care product manufacturing, and growing investment in personal care product development. Brazil's strong beauty culture and commitment to cosmetics innovation are supporting demand for premium barrier tube solutions across multiple consumer segments. Manufacturers are establishing comprehensive production capabilities to serve the large domestic market and growing regional export opportunities.
Revenue from barrier tube packaging in Germany is expanding at a CAGR of 6.4%, supported by the country's pharmaceutical industry leadership, advanced manufacturing capabilities, and strategic focus on high-quality specialty tubes.
Germany's engineering excellence and pharmaceutical innovation are driving demand for barrier tubes in prescription medications, dermatological preparations, and premium healthcare products. Manufacturers are investing in comprehensive quality management capabilities to serve both domestic pharmaceutical producers and international specialty markets.
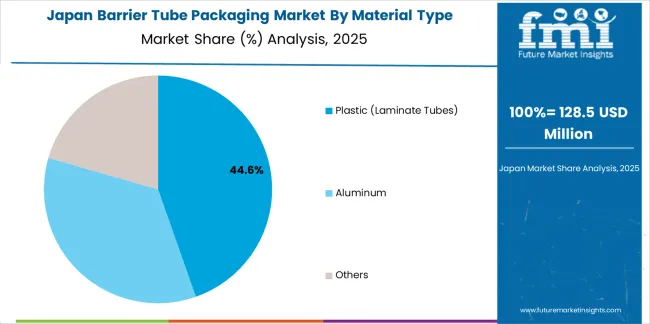
Revenue from barrier tube packaging in Japan is growing at a CAGR of 5.9%, driven by the country's expertise in precision manufacturing, emphasis on quality control, and strong position in specialty pharmaceutical and cosmetics packaging. Japan's established packaging technology capabilities and commitment to continuous improvement are supporting investment in advanced production technologies throughout major manufacturing centers. Industry leaders are establishing comprehensive quality assurance systems to serve domestic pharmaceutical producers and premium cosmetics brands.
Revenue from barrier tube packaging in France is expanding at a CAGR of 6.8%, supported by the country's luxury cosmetics manufacturing concentration, growing pharmaceutical production, and strategic position in global beauty and healthcare supply chains.
France's prestige cosmetics capabilities and integrated manufacturing ecosystem are driving demand for high-performance barrier tubes in skincare formulations, luxury personal care products, and specialty pharmaceutical applications. Leading manufacturers are investing in specialized capabilities to serve the stringent requirements of luxury cosmetics and pharmaceutical industries.
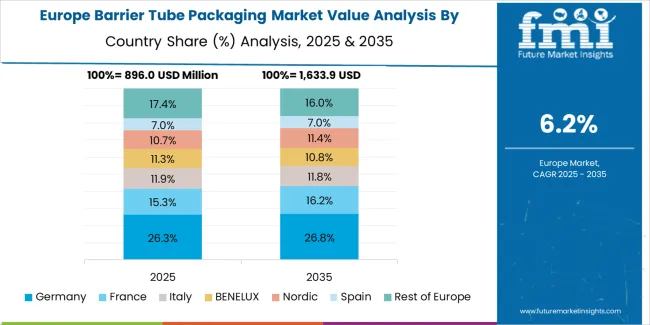
The barrier tube packaging market in Europe is projected to grow from USD 1.1 billion in 2025 to USD 2.3 billion by 2035, registering a CAGR of 7.7% over the forecast period. Germany is expected to maintain its leadership position with a 28.0% market share in 2025, declining slightly to 27.5% by 2035, supported by its strong pharmaceutical industry, advanced packaging manufacturing capabilities, and comprehensive healthcare sector serving diverse barrier tube applications across Europe.
France follows with a 22.0% share in 2025, projected to reach 22.5% by 2035, driven by robust demand for barrier tubes in luxury cosmetics packaging, pharmaceutical preparations, and personal care products, combined with established packaging technology capabilities and specialty tube production expertise.
The United Kingdom holds a 16.0% share in 2025, expected to maintain 16.0% through 2035, supported by strong pharmaceutical manufacturing and growing cosmetics production activities. Italy commands a 14.0% share in 2025, projected to reach 14.2% by 2035, while Spain accounts for 9.0% in 2025, expected to reach 9.3% by 2035.
The Netherlands maintains a 3.5% share in 2025, growing to 3.7% by 2035. The Rest of Europe region, including Nordic countries, Eastern Europe, Belgium, Switzerland, Austria, and Poland, is anticipated to gain momentum, expanding its collective share from 7.5% to 6.8% by 2035, attributed to increasing pharmaceutical manufacturing in Eastern Europe and growing specialty cosmetics production in Nordic countries implementing advanced packaging programs.
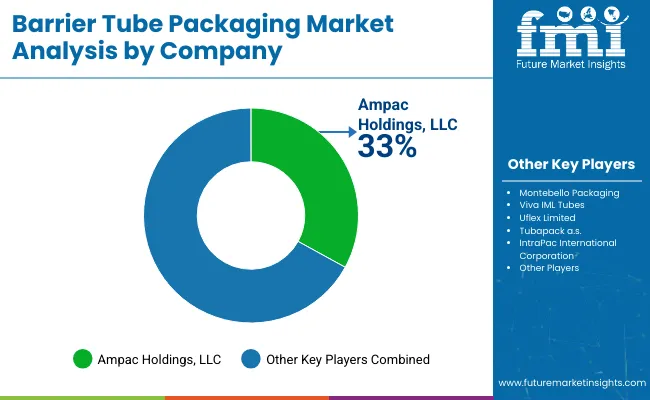
The barrier tube packaging market features 10–15 players with moderate concentration, where the top three companies collectively hold around 44–50% of global market share, driven by strong capabilities in multilayer extrusion, laminate engineering, and long-term partnerships with personal care, cosmetics, pharmaceutical, and food brands. The leading company, Albéa Group, commands 20% of the market share, supported by its extensive portfolio of laminated and extruded barrier tubes featuring EVOH, aluminum, and high-barrier polymer layers. Competition centers on barrier performance, print quality, recyclability, and customization flexibility rather than price-focused strategies.
Market leaders such as Albéa Group, Essel Propack Limited (EPL Global), and CCL Industries Inc. maintain dominant positions through advanced multilayer tube technologies, high-speed manufacturing, and strong relationships with global FMCG and cosmetic brands. Their strengths include sophisticated decoration capabilities, lightweighting innovations, and recyclable barrier structures that align with sustainability requirements.
Challenger companies including Montebello Packaging, Tuboplast Hispania (Alpla Group), and Hoffmann Neopac AG compete by offering premium aluminum and hybrid barrier tubes designed for sensitive formulations, dermatological products, and high-end cosmetics.
Additional competitive pressure arises from World Wide Packaging LLC, Alltub Group, Linhardt GmbH & Co. KG, and Huhtamaki Oyj, which enhance their market presence through regional manufacturing strength, specialty barrier solutions, and tailored tube designs for niche personal care and healthcare applications.
| Items | Values |
|---|---|
| Quantitative Units (2025) | USD 3.8 billion |
| Material Type | Plastic (Laminate Tubes), Aluminum, Others |
| Application | Pharmaceuticals & Healthcare, Cosmetics & Personal Care, Oral Care, Food & Nutraceuticals, Others |
| Capacity | Small (Below 50ml), Medium (50-100ml), Large (Above 100ml) |
| Barrier Type | Aluminum Foil Barrier, Metallized Barrier, Polymer Barrier |
| Closure Type | Screw Caps, Flip-Top Caps, Nozzle Caps, Others |
| Distribution Channel | Direct Sales, Distributors, Contract Manufacturers |
| Regions Covered | North America, Europe, East Asia, South Asia & Pacific, Latin America, Middle East & Africa |
| Countries Covered | United States, Canada, United Kingdom, Germany, France, China, Japan, South Korea, India, Brazil, Australia and 40+ countries |
| Key Companies Profiled | Albéa Group, Essel Propack Limited (EPL Global), CCL Industries Inc., Montebello Packaging, Tuboplast Hispania (Alpla Group), Hoffmann Neopac AG, World Wide Packaging LLC, Alltub Group, Linhardt GmbH & Co. KG, and Huhtamaki Oyj |
| Additional Attributes | Dollar sales by material type and application category, regional demand trends, competitive landscape, technological advancements in lamination systems, barrier layer development, closure system innovation, and supply chain integration |
The global barrier tube packaging market is estimated to be valued at USD 3.8 billion in 2025.
The market size for the barrier tube packaging market is projected to reach USD 7.9 billion by 2035.
The barrier tube packaging market is expected to grow at a 7.6% CAGR between 2025 and 2035.
The key product types in barrier tube packaging market are plastic (laminate tubes), aluminum and others.
In terms of application, pharmaceuticals & healthcare segment to command 39.0% share in the barrier tube packaging market in 2025.


Our Research Products

The "Full Research Suite" delivers actionable market intel, deep dives on markets or technologies, so clients act faster, cut risk, and unlock growth.

The Leaderboard benchmarks and ranks top vendors, classifying them as Established Leaders, Leading Challengers, or Disruptors & Challengers.

Locates where complements amplify value and substitutes erode it, forecasting net impact by horizon

We deliver granular, decision-grade intel: market sizing, 5-year forecasts, pricing, adoption, usage, revenue, and operational KPIs—plus competitor tracking, regulation, and value chains—across 60 countries broadly.

Spot the shifts before they hit your P&L. We track inflection points, adoption curves, pricing moves, and ecosystem plays to show where demand is heading, why it is changing, and what to do next across high-growth markets and disruptive tech

Real-time reads of user behavior. We track shifting priorities, perceptions of today’s and next-gen services, and provider experience, then pace how fast tech moves from trial to adoption, blending buyer, consumer, and channel inputs with social signals (#WhySwitch, #UX).

Partner with our analyst team to build a custom report designed around your business priorities. From analysing market trends to assessing competitors or crafting bespoke datasets, we tailor insights to your needs.
Supplier Intelligence
Discovery & Profiling
Capacity & Footprint
Performance & Risk
Compliance & Governance
Commercial Readiness
Who Supplies Whom
Scorecards & Shortlists
Playbooks & Docs
Category Intelligence
Definition & Scope
Demand & Use Cases
Cost Drivers
Market Structure
Supply Chain Map
Trade & Policy
Operating Norms
Deliverables
Buyer Intelligence
Account Basics
Spend & Scope
Procurement Model
Vendor Requirements
Terms & Policies
Entry Strategy
Pain Points & Triggers
Outputs
Pricing Analysis
Benchmarks
Trends
Should-Cost
Indexation
Landed Cost
Commercial Terms
Deliverables
Brand Analysis
Positioning & Value Prop
Share & Presence
Customer Evidence
Go-to-Market
Digital & Reputation
Compliance & Trust
KPIs & Gaps
Outputs
Full Research Suite comprises of:
Market outlook & trends analysis
Interviews & case studies
Strategic recommendations
Vendor profiles & capabilities analysis
5-year forecasts
8 regions and 60+ country-level data splits
Market segment data splits
12 months of continuous data updates
DELIVERED AS:
PDF EXCEL ONLINE
Barrier Packaging Market Size and Share Forecast Outlook 2025 to 2035
Competitive Landscape of Barrier Packaging Providers
Europe Barrier Packaging Market Growth – Demand & Forecast 2024-2034
Packaging Tubes Market Size and Share Forecast Outlook 2025 to 2035
Packaging Barrier Film Market Size and Share Forecast Outlook 2025 to 2035
Market Share Insights of Leading Packaging Tube Providers
USA Barrier Packaging Market Analysis – Trends & Forecast 2024-2034
High Barrier Packaging Films for Pharmaceuticals Market Size and Share Forecast Outlook 2025 to 2035
High Barrier Packaging Films Market Size and Share Forecast Outlook 2025 to 2035
Competitive Landscape of High Barrier Packaging Films for Pharmaceuticals
Market Share Breakdown of High Barrier Packaging Films Suppliers
Plastic Tube Packaging Market Size and Share Forecast Outlook 2025 to 2035
Barrier Coatings for Packaging Market Trends - Growth & Forecast 2025 to 2035
Cosmetic Tube Packaging Market Size and Share Forecast Outlook 2025 to 2035
Sterile Barrier Packaging Market Growth - Demand & Forecast 2025 to 2035
Recyclable Barrier Packaging Market Size and Share Forecast Outlook 2025 to 2035
Demand for Packaging Tubes in USA Size and Share Forecast Outlook 2025 to 2035
Demand for Packaging Tubes in Japan Size and Share Forecast Outlook 2025 to 2035
High Barrier Pharmaceutical Packaging Films for Blister Market Size and Share Forecast Outlook 2025 to 2035
Competitive Landscape of Metalized Barrier Film Packaging Providers

Thank you!
You will receive an email from our Business Development Manager. Please be sure to check your SPAM/JUNK folder too.
Chat With
MaRIA