The global barrier coated papers market is valued at USD 3.8 billion in 2025 and is slated to reach USD 7.1 billion by 2035, recording an absolute increase of USD 3.3 billion over the forecast period. This translates into a total growth of 86.8%, with the market forecast to expand at a CAGR of 6.4% between 2025 and 2035. As per FMI’s comprehensive packaging sector study, reflecting shifts in barrier materials and eco-design strategies, the overall market size is expected to grow by nearly 1.87 times during the same period, supported by increasing demand for grease-resistant packaging solutions in food service applications, the growing adoption of moisture barrier technologies in pharmaceutical packaging, and a rising preference for recyclable alternatives to plastic-coated materials across consumer goods distribution and flexible packaging applications.
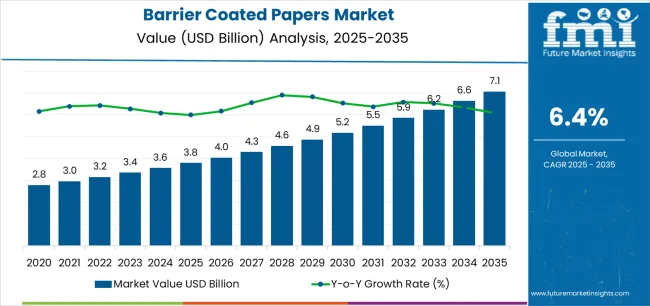
Between 2025 and 2030, the barrier coated papers market is projected to expand from USD 3.8 billion to USD 5.3 billion, resulting in a value increase of USD 1.5 billion, which represents 45.5% of the total forecast growth for the decade. This phase of development will be shaped by increasing demand for compostable food packaging materials, rising adoption of water-based barrier coating formulations, and growing demand for oil and grease resistant papers with enhanced barrier characteristics. Food service operators are expanding their barrier coated paper sourcing capabilities to address the growing demand for quick-service restaurant packaging, bakery product wrapping, and specialty food container requirements.
| Metric | Value |
|---|---|
| Estimated Value in (2025E) | USD 3.8 billion |
| Forecast Value in (2035F) | USD 7.1 billion |
| Forecast CAGR (2025 to 2035) | 6.4% |
Demand growth is supported by the shift toward eco-friendly packaging solutions across the food, beverage, and pharmaceutical industries. Food packaging accounts for about 50% of total consumption, while cosmetics and personal care contribute nearly 20%. These coatings help prevent moisture, grease, and oxygen penetration, improving shelf life and maintaining product integrity. Rising demand for recyclable and biodegradable paper packaging materials is reshaping the global packaging landscape.
Water-based and wax-coated papers collectively hold around 60% market share, as manufacturers prioritize adaptable and cost-effective barrier layers. The Asia-Pacific region dominates with more than 40% share, fueled by strong manufacturing and packaging activity in countries such as China, India, and Indonesia. Europe and North America continue to advance product innovation through high-performance coating technologies and recyclable paper composites. Key producers are focusing on lightweight designs, printable coatings, and hybrid materials to enhance performance efficiency. Ongoing R&D investments and capacity expansions by packaging converters are expected to further elevate market competitiveness through 2035.
Market expansion is being supported by the increasing global demand for fiber-based packaging solutions and the corresponding need for paper materials that can provide superior grease resistance and moisture barrier protection while enabling recyclable packaging and regulatory compliance across various food service and pharmaceutical packaging applications. Modern food service operators and brand owners are increasingly focused on implementing packaging materials that can protect product quality, prevent oil and grease migration, and provide consistent barrier performance throughout complex distribution and consumer handling environments. Barrier coated papers' proven ability to deliver exceptional functional performance against liquid penetration, enable fiber-based packaging alternatives, and support environmentally-preferred material choices make them essential substrates for contemporary food packaging and pharmaceutical applications.
The growing emphasis on plastic reduction and packaging recyclability is driving demand for barrier coated papers that can support high-performance packaging requirements, improve material circularity, and enable fiber-based packaging formats. Brand owners' preference for materials that combine effective barrier protection with environmental benefits and regulatory compliance is creating opportunities for innovative barrier coating implementations. The rising influence of quick-service restaurant expansion and takeaway food consumption is also contributing to increased demand for barrier coated papers that can provide grease resistance, moisture protection, and reliable performance across various food contact applications.
The barrier coated papers market is poised for rapid growth and transformation. As industries across food service, pharmaceuticals, consumer goods, personal care, and industrial products seek packaging that delivers exceptional barrier performance, grease resistance, and environmental benefits, barrier coated papers are gaining prominence not just as commodity materials but as strategic enablers of plastic reduction and circular economy initiatives.
Rising demand for fiber-based packaging in Asia-Pacific and expanding food service markets globally amplify demand, while manufacturers are leveraging innovations in aqueous barrier coatings, mineral-based dispersions, and multi-layer coating systems.
Pathways like specialty high-barrier formulations, compostable coating technologies, and application-specific customization promise strong margin uplift, especially in high-value segments. Geographic expansion and vertical integration will capture volume, particularly where local coating capabilities and substrate availability are critical. Regulatory pressures around plastic waste reduction, fiber-based packaging requirements, food contact compliance, and recyclability standards give structural support.
The market is segmented by coating type, application, barrier property, paper weight, end-use industry, and region. By coating type, the market is divided into water-based coatings, wax coatings, dispersion coatings, and others. By application, it covers food & beverage packaging, pharmaceutical packaging, personal care packaging, industrial packaging, and others. By barrier property, the market is segmented into grease resistance, moisture resistance, oil resistance, and vapor barrier. The paper weight includes lightweight (40-80 GSM), medium weight (80-120 GSM), and heavyweight (above 120 GSM). By end-use industry, it is categorized into food service, pharmaceuticals, consumer goods, industrial, and others. Regionally, the market is divided into North America, Europe, East Asia, South Asia & Pacific, Latin America, and the Middle East & Africa.

The water-based coatings segment is projected to account for 54.0% of the barrier coated papers market in 2025, reaffirming its position as the leading coating technology category. Food service operators and packaging converters increasingly utilize water-based barrier coatings for their superior environmental profile when processed through aqueous application systems, excellent recyclability characteristics, and regulatory compliance in applications ranging from food contact packaging to pharmaceutical materials. Water-based coating technology's advanced barrier formulation capabilities and consistent coating application directly address the industrial requirements for reliable grease resistance in high-volume packaging manufacturing environments.
This coating segment forms the foundation of modern fiber-based packaging operations, as it represents the coating type with the greatest environmental advantages and established market demand across multiple application categories and industry sectors. Manufacturer investments in enhanced dispersion technologies and high-speed coating compatibility continue to strengthen adoption among food service operators and packaging converters. With companies prioritizing plastic reduction and material recyclability, water-based barrier coatings align with both functional performance requirements and environmental responsibility objectives, making them the central component of comprehensive packaging material strategies.

Food & beverage packaging applications are projected to represent 47.0% of barrier coated papers demand in 2025, underscoring their critical role as the primary industrial consumers of barrier coated materials for quick-service restaurant packaging, bakery product wrapping, and consumer food packaging. Food service operators prefer barrier coated papers for their exceptional grease resistance capabilities, recyclable material characteristics, and ability to prevent oil migration while ensuring food safety compliance with regulated contact standards. Positioned as essential materials for modern food packaging operations, barrier coated papers offer both functional advantages and environmental benefits.
The segment is supported by continuous innovation in coating formulation technologies and the growing availability of specialized barrier systems that enable compostable certification with enhanced moisture resistance and rapid processing throughput. The food service operators are investing in packaging format diversification to support large-volume barrier coated paper utilization and operational efficiency. As takeaway consumption becomes more prevalent and quick-service restaurant demand increases, food & beverage packaging applications will continue to dominate the end-use market while supporting advanced barrier coating utilization and packaging innovation strategies.
The barrier coated papers market is advancing rapidly due to increasing demand for plastic-free packaging alternatives and growing adoption of fiber-based materials that provide superior grease resistance and moisture barrier protection while enabling recyclable packaging across diverse food service and pharmaceutical packaging applications. The market faces challenges, including coating technology complexity, performance limitations compared to plastic laminates, and the need for specialized coating equipment investments. Innovation in bio-based barrier formulations and mineral coating development continues to influence product development and market expansion patterns.
The growing adoption of plant-based barrier formulations, mineral dispersion coatings, and chitosan-based barrier systems is enabling manufacturers to produce barrier coated papers with superior environmental profiles, enhanced recyclability characteristics, and compostability certifications while maintaining functional grease resistance. Advanced bio-based systems provide improved moisture barrier performance while allowing more efficient material circularity and consistent performance across various food contact conditions and applications. Manufacturers are increasingly recognizing the competitive advantages of bio-based coating capabilities for market differentiation and premium positioning.
Modern barrier coated paper producers are incorporating precision coating application systems, integrated drying technologies, and inline quality monitoring mechanisms to enhance production efficiency, enable cost optimization, and deliver value-added solutions to food service and pharmaceutical customers. These technologies improve manufacturing throughput while enabling new coating capabilities, including multi-layer barrier structures, ultra-thin coating weights, and reduced material consumption. Advanced equipment integration also allows manufacturers to support large-scale packaging operations and converter modernization beyond traditional coating approaches.
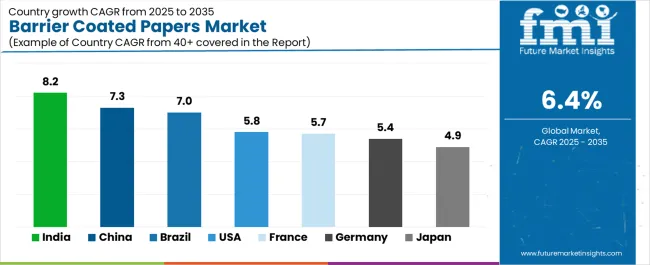
| Country | CAGR (2025-2035) |
|---|---|
| India | 8.2 |
| China | 7.3 |
| USA | 5.8 |
| Brazil | 7.0 |
| Germany | 5.4 |
| Japan | 4.9 |
| France | 5.7 |
The barrier coated papers market is experiencing strong growth globally, with India leading at an 8.2% CAGR through 2035, driven by the expanding food service sector, growing pharmaceutical manufacturing, and significant investment in packaging infrastructure development. China follows at 7.3%, supported by rapid quick-service restaurant expansion, increasing food delivery demand, and growing domestic paper coating capabilities.
The USA shows growth at 5.8%, emphasizing plastic reduction initiatives and fiber-based packaging innovation. Brazil records 7.0%, focusing on food service market expansion and takeaway consumption growth. Germany demonstrates 5.4% growth, prioritizing circular economy standards and advanced coating technology excellence. Japan exhibits 4.9% growth, emphasizing precision coating and quality barrier paper production. France shows 5.7% growth, supported by bakery packaging demand and food service logistics concentration.
The report covers an in-depth analysis of 40+ countries, Top-performing countries are highlighted below.

The barrier coated papers industry in India is projected to exhibit exceptional growth with a CAGR of 8.2% through 2035, driven by expanding quick-service restaurant penetration and rapidly growing takeaway food consumption supported by government initiatives promoting food processing sector development. The country's strong position in pharmaceutical manufacturing and increasing investment in packaging infrastructure are creating substantial demand for barrier coated paper solutions. Major food service chains and pharmaceutical companies are establishing comprehensive barrier coated paper sourcing capabilities to serve both domestic packaging demand and export markets.
The barrier coated papers industry in China is expanding at a CAGR of 7.3%, supported by the country's massive food service market, expanding takeaway delivery activities, and increasing adoption of fiber-based packaging solutions. The country's government initiatives promoting plastic reduction and growing middle-class consumption are driving requirements for sophisticated barrier coating capabilities. International suppliers and domestic manufacturers are establishing extensive coating and converting capabilities to address the growing demand for barrier coated paper products.
The barrier coated papers industry in the USA is expanding at a CAGR of 5.8%, supported by the country's advanced coating technology capabilities, strong emphasis on plastic reduction initiatives, and robust demand for high-performance barrier papers in food service and pharmaceutical packaging applications. The nation's mature paper industry and innovation-focused operations are driving sophisticated barrier coating systems throughout the supply chain. Leading manufacturers and technology providers are investing extensively in bio-based coating formulations and compostable barrier papers to serve both domestic and international markets.
The barrier coated papers industry in Brazil is growing at a CAGR of 7.0%, driven by the country's expanding quick-service restaurant sector, growing takeaway food consumption, and increasing investment in packaging manufacturing infrastructure. Brazil's large consumer base and commitment to food service expansion are supporting demand for barrier coated paper solutions across multiple packaging segments. Manufacturers are establishing comprehensive coating capabilities to serve the growing domestic market and regional distribution opportunities.
The barrier coated papers industry in Germany is expanding at a CAGR of 5.4%, supported by the country's packaging industry leadership, advanced coating capabilities, and strategic focus on high-performance recyclable materials. Germany's engineering excellence and circular economy innovation are driving demand for barrier coated papers in food service packaging, pharmaceutical materials, and industrial packaging applications. Manufacturers are investing in comprehensive coating technology capabilities to serve both domestic brand owners and international specialty markets.
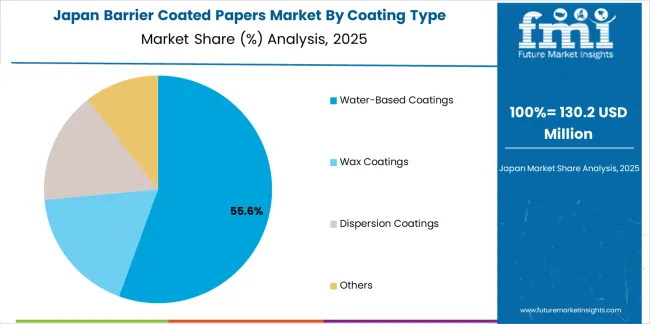
The barrier coated papers industry in Japan is growing at a CAGR of 4.9%, driven by the country's expertise in precision coating, emphasis on quality control, and strong position in food service and pharmaceutical packaging. Japan's established paper manufacturing capabilities and commitment to continuous improvement are supporting investment in advanced coating technologies throughout major production centers. Industry leaders are establishing comprehensive quality assurance systems to serve domestic food service operators and pharmaceutical manufacturers.
Demand for barrier coated papers in France is expanding at a CAGR of 5.7%, supported by the country's bakery product manufacturing concentration, growing food service sector, and strategic position in European food packaging networks. France's culinary heritage and integrated food distribution infrastructure are driving demand for high-quality barrier coated papers in artisan bakery packaging, pastry wrapping, and specialty food service applications. Leading manufacturers are investing in specialized capabilities to serve the stringent requirements of bakery and food service industries.
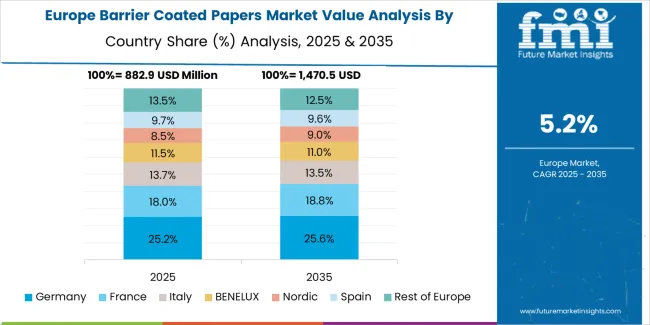
The market in Europe is projected to grow from USD 1.1 billion in 2025 to USD 2.1 billion by 2035, registering a CAGR of 6.7% over the forecast period. Germany is expected to maintain its leadership position with a 29.0% market share in 2025, declining slightly to 28.5% by 2035, supported by its strong packaging industry, advanced coating technology capabilities, and comprehensive food service sector serving diverse barrier coated paper applications across Europe.
France follows with a 21.0% share in 2025, projected to reach 21.5% by 2035, driven by robust demand for barrier coated papers in bakery packaging, food service applications, and pharmaceutical materials, combined with established paper manufacturing infrastructure and specialty coating expertise. The United Kingdom holds an 17.0% share in 2025, expected to reach 17.5% by 2035, supported by strong quick-service restaurant market and growing takeaway food activities. Italy commands a 14.0% share in 2025, projected to reach 14.5% by 2035, while Spain accounts for 9.0% in 2025, expected to reach 9.5% by 2035.
The Netherlands maintains a 4.0% share in 2025, growing to 4.2% by 2035. The Rest of Europe region, including Nordic countries, Eastern Europe, Belgium, Poland, and other nations, is anticipated to maintain momentum, with its collective share moving from 5.5% to 4.3% by 2035, attributed to increasing food service expansion in Eastern Europe and growing plastic reduction initiatives in Nordic countries implementing advanced barrier coating programs.
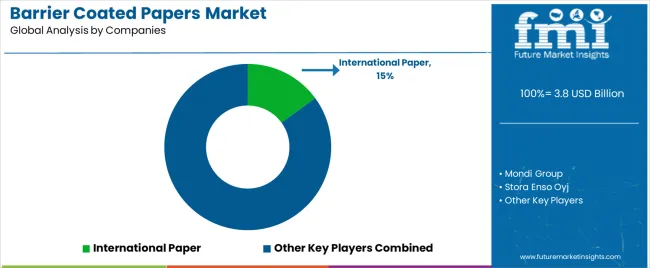
The barrier coated papers market is characterized by competition among established paper manufacturers, specialized coating technology providers, and integrated packaging solutions suppliers. Companies are investing in barrier formulation research, coating application optimization, multi-layer coating system development, and comprehensive product portfolios to deliver consistent, high-performance, and application-specific barrier coated paper solutions. Innovation in bio-based materials, compostable certifications, and recyclability enhancement is central to strengthening market position and competitive advantage.
International Paper leads the market with a strong market share, offering comprehensive barrier coated paper solutions with a focus on food service and pharmaceutical applications. Mondi Group provides specialized packaging paper capabilities with an emphasis on high-barrier coating technologies and customized paper grades. Stora Enso delivers innovative fiber-based materials with a focus on renewable barriers and compostable alternatives. Sappi Limited specializes in specialty paper grades and advanced coating formulations for food contact applications. Ahlstrom-Munksjö focuses on specialty barrier papers and release coating technologies. Cascades Inc. offers fiber-based packaging solutions with emphasis on recycled content and environmental performance.
| Items | Values |
|---|---|
| Quantitative Units (2025) | USD 3.8 billion |
| Coating Type | Water-Based Coatings, Wax Coatings, Dispersion Coatings, Others |
| Application | Food & Beverage Packaging, Pharmaceutical Packaging, Personal Care Packaging, Industrial Packaging, Others |
| Barrier Property | Grease Resistance, Moisture Resistance, Oil Resistance, Vapor Barrier |
| Paper Weight | Lightweight (40-80 GSM), Medium Weight (80-120 GSM), Heavyweight (Above 120 GSM) |
| End-Use Industry | Food Service, Pharmaceuticals, Consumer Goods, Industrial, Others |
| Regions Covered | North America, Europe, East Asia, South Asia & Pacific, Latin America, Middle East & Africa |
| Countries Covered | United States, Canada, United Kingdom, Germany, France, China, Japan, South Korea, India, Brazil, Australia and 40+ countries |
| Key Companies Profiled | International Paper, Mondi Group, Stora Enso, Sappi Limited, Ahlstrom-Munksjö, and Cascades Inc. |
| Additional Attributes | Dollar sales by coating type and application category, regional demand trends, competitive landscape, technological advancements in barrier formulation systems, coating application development, bio-based material innovation, and supply chain integration |
The global barrier coated papers market is estimated to be valued at USD 3.8 billion in 2025.
The market size for the barrier coated papers market is projected to reach USD 7.1 billion by 2035.
The barrier coated papers market is expected to grow at a 6.4% CAGR between 2025 and 2035.
The key product types in barrier coated papers market are water-based coatings, wax coatings, dispersion coatings and others.
In terms of application, food & beverage packaging segment to command 47.0% share in the barrier coated papers market in 2025.


Full Research Suite comprises of:
Market outlook & trends analysis
Interviews & case studies
Strategic recommendations
Vendor profiles & capabilities analysis
5-year forecasts
8 regions and 60+ country-level data splits
Market segment data splits
12 months of continuous data updates
DELIVERED AS:
PDF EXCEL ONLINE
Key Players & Market Share in the Barrier Coated Paper Industry
Barrier System Market Forecast Outlook 2025 to 2035
Barrier Packaging Market Size and Share Forecast Outlook 2025 to 2035
Barrier Tube Packaging Market Size and Share Forecast Outlook 2025 to 2035
Barrier Resins Market Size and Share Forecast Outlook 2025 to 2035
Barrier Material Market Size and Share Forecast Outlook 2025 to 2035
Barrier Shrink Bags Market Analysis - Size, Share, and Forecast 2025 to 2035
Market Share Insights for Barrier Shrink Bag Providers
Barrier Coatings for Packaging Market Trends - Growth & Forecast 2025 to 2035
Competitive Landscape of Barrier Packaging Providers
Barrier Film Market Trends & Industry Growth Forecast 2025 to 2035
Europe Barrier Packaging Market Growth – Demand & Forecast 2024-2034
Barrier Bags Market
Barrier Coated Paper Industry Analysis in Europe - Demand, Growth & Future Outlook 2025 to 2035
Japan Barrier Coated Paper Market Growth – Trends & Forecast 2023-2033
Korea Barrier Coated Paper Market Growth – Trends & Forecast 2023-2033
Air Barrier Market Size and Share Forecast Outlook 2025 to 2035
Non-Barrier Bag Market Size and Share Forecast Outlook 2025 to 2035
Market Share Distribution Among Non-Barrier Bag Providers
USA Barrier Packaging Market Analysis – Trends & Forecast 2024-2034

Thank you!
You will receive an email from our Business Development Manager. Please be sure to check your SPAM/JUNK folder too.
Chat With
MaRIA