Access Control Market Size, Share, and Forecast (Outlook 2025 to 2035)

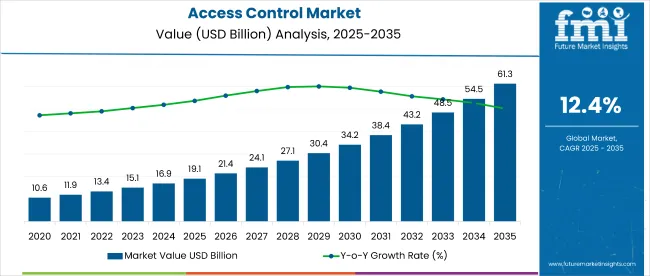
The global access control market is projected to grow from USD 19.05 Billion in 2025 to USD 61.31 Billion by 2035, expanding at a compound annual growth rate (CAGR) of 12.4% during the forecast period. This growth is fueled by increasing demand for security solutions across various sectors, including commercial buildings, residential complexes, government facilities, and industrial sites.

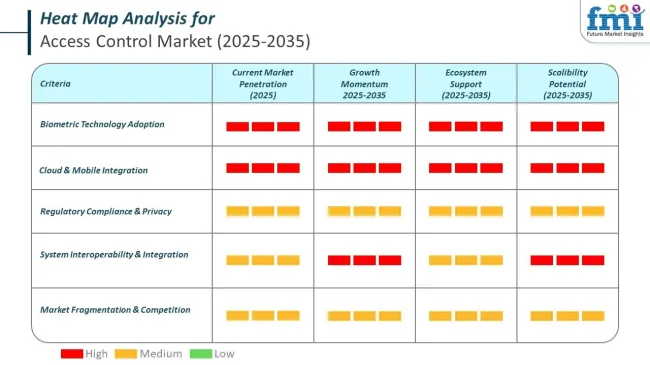
The rising need for enhanced security and the adoption of advanced technologies such as biometric systems, smart locks, and cloud-based access control are key drivers of this market.

Access control systems are becoming increasingly sophisticated, offering more robust security features that go beyond traditional lock-and-key solutions.

These systems allow organizations to manage who has access to specific areas in real time, track movements, and integrate with other security technologies such as surveillance cameras, alarms, and intrusion detection systems. With the growing focus on workplace safety, data protection, and reducing security breaches, the demand for advanced access control solutions is surging.

The transition from physical keys to digital solutions, including mobile credentials and biometric identification systems, is contributing to the market’s growth.

Biometric systems, such as fingerprint recognition, facial recognition, and iris scanning, are gaining popularity due to their high level of accuracy and convenience. These technologies are being integrated into access control systems to provide a higher level of security, ensuring only authorized individuals are granted access to sensitive areas.

Vimal Kapur, CEO of Honeywell Security, emphasized the pivotal role access control systems play in meeting the demands of today’s rapidly evolving security landscape. He noted,

“As security requirements evolve, access control systems are at the forefront of providing advanced protection. We are committed to driving innovation in this space to meet the growing need for secure, scalable, and efficient solutions.”

His statement highlights Honeywell’s focus on developing cutting-edge technologies that address the increasing complexity of modern threats. As businesses and institutions prioritize safeguarding physical and digital assets, access control solutions are becoming central to their security strategy.

With advancements in technology and growing concerns over safety and privacy, the access control market is expected to experience sustained growth through 2035, supported by both technological innovations and rising demand for enhanced security.
Key Industry Attributes

Attribute Detail
Market Size (2025) USD 19.05 billion
Market Size (2035) USD 61.31 billion
CAGR (2025-2035) 12.4%

Analyzing Access Control Systems Market by Top Investment Segments

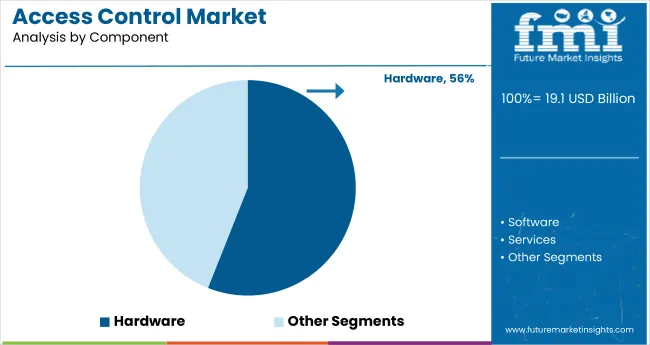
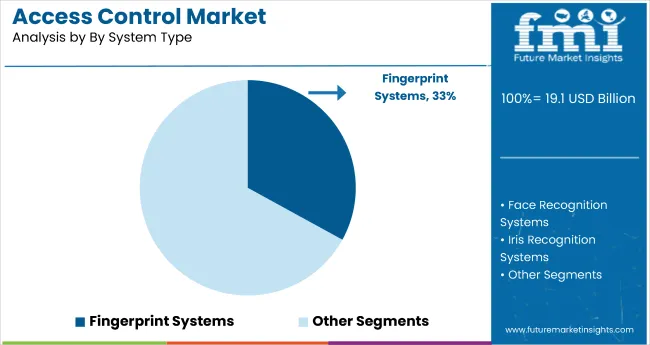
Hardware components will dominate the market, holding a 56% share, while iris recognition access control systems will capture 35% of the market share by 2035, driven by security concerns and advanced technology.
Hardware Components Lead the Access Control Systems Market

Hardware components are projected to capture a 56% share of the access control systems market by 2035. These components include physical devices such as card readers, biometric scanners, controllers, locks, and software that enable access to secure areas. The increasing demand for advanced physical security systems across various sectors, including commercial, government, and healthcare, is driving the growth of hardware-based solutions.

Major companies like Honeywell, Johnson Controls, and Assa Abloy lead this segment by providing highly reliable and customizable access control solutions. The demand for hardware components is expected to continue growing due to security concerns and the rise of smart buildings and IoT.
Iris Recognition Access Control Systems Gain Popularity

Iris recognition access control systems are expected to capture 35% of the market share by 2035. These systems use advanced biometric technology to scan the unique patterns in a person’s iris for secure and accurate identification. Iris recognition offers high levels of security as it is difficult to forge, ensuring restricted access to sensitive areas.

This technology is becoming increasingly popular in high-security environments, such as government facilities, airports, and healthcare institutions. Companies like ZKTeco, Suprema, and Iris ID are key players in this space, developing innovative and highly efficient iris recognition solutions for enhanced security in access control.

How are Surging Applications of Contactless Biometric Technology Affecting Growth?

Traditionally, contactless biometrics were used for applications predominantly initiated by military access control, and civil, or criminal identification under a tightly regulated technical and legal framework. But nowadays, all industrial sectors including BFSI, healthcare, education, military and defense, and many others have started adopting contactless biometrics.

Most importantly, acceptance and awareness of this technology have increased among industrial users in the past few years. This increasing ubiquity of biometric authentication using a range of different identification methods makes mobile biometrics accessible in the industrial workplace. Moreover, facial recognition technology is also being used by companies to identify their employees as soon as they enter the organization.
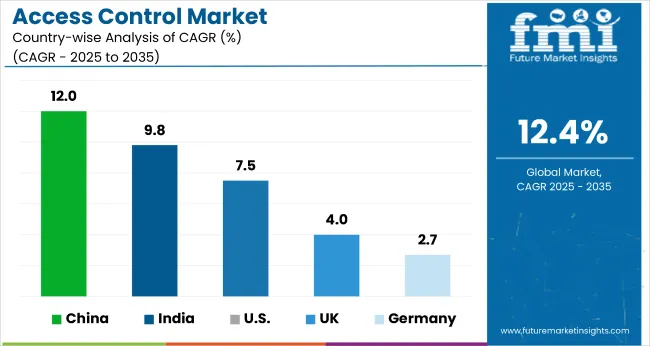
Country-wise Insights

Region CAGR (2023 to 2033)
The United States 7.5%
China 4.7%
India 6.6%
Germany 2.7%
The United Kingdom 4.0%

How does the United States Access Control Market lead in terms of Market Share?

High Demand from Healthcare and Manufacturing Technology is likely to Flourish the Demand for Access Control Market in the Region

The United States Market CAGR (2023 to 2033) 7.5%
The United States Market Sales Volume (2023) 4,328.4

As per FMI’s analysis, the United States access control market is thriving at an average CAGR of 7.5% between 2023 and 2033. The market is anticipated to hold a sales volume of 4,328.4 units in 2023. North America is predicted to remain one of the most attractive markets during the forecast period, according to Future Market Insights. The United States accounted for close to 79% of the North America market through 2031.

In February 2021, Honeywell entered into a strategic alliance with IDEMIA, to create and cultivate an intelligent building ecosystem that provides a seamless and enhanced experience for operators and occupants alike. The alliance integrated Honeywell’s security and building management systems with IDEMIA’s biometric-based access control systems to create frictionless, safe, and efficient buildings.

What makes China another Significant market for Access Control Solutions?

Increase in Tech Startups and a New Wave of Cyberattacks have pushed China Government to Make Access Control Solutions Mandatory

China Market CAGR (2023 to 2033) 12%
China Market Sales Volume (2023) 1,605.8

Demand in China access control market is expected to rise at a CAGR of 12% over the forecast period. Increasing government investments in infrastructural development projects such as the construction and expansion of the Beijing International Airport, and the China-Pakistan Economic Corridor (CPEC), is anticipated to spur the demand for access control solutions. The regional market is expected to hold a sales volume of 1,605.8 units.

Increased terror threats and growing government spending to enhance security are some key factors driving the sales of access control solutions in China. In addition, the growing economy of China creates a significant requirement for security systems.

As per the report, China is recognized as a primary market, and it held a notable revenue share of 43.3% in 2021.

Why is India Considered One of the Lucrative Markets for Access Control?

India Market CAGR (2023 to 2033) 9.8%
India Market Sales Volume (2023) (Units) 890.4

In 2031, the demand for access control solutions in India is estimated to witness sales value of 890.4 units. India market thrives on a CAGR of 9.8% between 2023 and 2033. Several government and private entities have been investing in advanced security systems for workplace solutions and data protection. Factors such as the rapid deployment of access control systems across defense and commercial sectors are driving the demand in India.

The introduction of technologically enriched, contactless smart cards for diversified applications, is expected to propel the access control demand. Moreover, the urbanized areas of the country, including Chennai, Hyderabad, Mumbai, Delhi-NCR, and Bangalore have made remarkable progress in advancing security systems, pertaining to IT hubs, commercial spaces, and government buildings. Additionally, escalating criminal activities in the country, are driving IT companies to install access control systems for recording employee entry and exit timings to protect personnel and minimize data breaches.

Competition Scenario

Key vendors of access control solutions are focusing on evolving their existing product and service portfolio. Companies are launching industry-specific solutions to meet industry-specific needs.

Market Developments:

  • For instance, In February 2021, Honeywell announced the expansion of capabilities of its MAXPRO Cloud portfolio with the launch of MPA1 and MPA2, access control panels that offer cloud, web-based, or on-premise hosting options.
  • In April 2021, NEC Corporation announced the provision of an electronic customs procedure system utilizing facial recognition at the customs inspection areas of Naha Airport, the busiest airport in Okinawa, Japan.
  • Nedap’s AEOS physical access control system received CPNI certification, making it suitable for the United Kingdom’s technical authority standards.

Key Players

  • Identiv
  • Honeywell International Inc.
  • NEC Corporation
  • Johnson Controls
  • Bosch Security and Safety Systems
  • Assa Abloy AB
  • Thales Group
  • STANLEY Convergent Security Solutions, Inc.
  • 3M
  • Secom Co., Ltd
  • Dormakaba Holding AG
  • HID Global
  • Matrix Comsec Pvt. Ltd.
  • Paxton Access Ltd.
  • BioEnable Technologies Pvt Ltd.
  • Spectra Technovision (India) Pvt. Ltd.
  • ZKTeco India
  • Intellicon Private

Access Control Market - Report Scope

Report Attributes Details
Market Size (2025) USD 19.05 billion
Projected Market Size (2035) USD 61.31 billion
CAGR (2025 to 2035) 12.4%
Base Year for Estimation 2024
Historical Period 2020 to 2024
Projections Period 2025 to 2035
Quantitative Units USD billion for value
Components Analyzed Hardware (Fingerprint Scanners, Facial Recognition Devices, Iris Scanners, Smart Cards, Others), Software (Integrated Access Control Software, Standalone Software/Middleware, Facial Recognition Software, Iris Recognition Software, Others), Services (Professional Services, System Integration & Installation, Security Consulting, Support & Maintenance, Managed Services)
System Types Analyzed Fingerprint Access Control Systems, Face Recognition Access Control Systems, Iris Recognition Access Control Systems, Card-Based Access Control Systems, Others
Industries Analyzed IT & Telecom, BFSI, Military & Defense, Manufacturing, Healthcare, Transportation & Logistics, Government, Education, Others
Regions Covered North America, Latin America, Europe, Asia Pacific excluding Japan, The Middle East and Africa
Countries Covered United States, Canada, Brazil, Mexico, Germany, United Kingdom, France, Spain, Russia, China, India, Malaysia, Singapore, Australia, GCC Countries, Israel, South Africa
Key Players Influencing the Market Identiv, Honeywell International Inc., NEC Corporation, Johnson Controls, Bosch Security and Safety Systems, Assa Abloy, STANLEY Convergent Security Solutions, Inc., 3M, Secom Co., Ltd., Dormakaba Holding AG, HID Global, Matrix Comsec Pvt. Ltd., Paxton Access Ltd., BioEnable Technologies Pvt Ltd., ZKTeco India
Additional Attributes Dollar sales growth by component (hardware/software/services), industry demand trends (IT/BFSI/defense/healthcare), regional market shares, competitive landscape, pricing strategies, technology innovations, adoption of advanced access control systems

Key Segments

By Component:

  • Hardware
    • Fingerprint Scanners
    • Facial Recognition Devices
    • Iris Scanners
    • Smart Cards
    • Others
  • Software
    • Integrated Access Control Software
    • Standalone Software/Middleware
    • Facial Recognition Software
    • Iris Recognition Software
    • Others
  • Services
    • Professional Services
      • System Integration & Installation
      • Security Consulting
      • Support & Maintenance
    • Managed Services

By System Type:

  • Fingerprint Access Control Systems
  • Face Recognition Access Control Systems
  • Iris Recognition Access Control Systems
  • Card-Based Access Control Systems
  • Others

By Industry:

  • IT & Telecom
  • BFSI
  • Military & Defense
  • Manufacturing
  • Healthcare
  • Transportation & Logistics
  • Government
  • Education
  • Others

Key Regions Covered:

  • North America
    • The United States
    • Canada
  • Latin America
    • Brazil
    • Mexico
    • Rest of Latin America
  • Europe
    • Germany
    • The United Kingdom
    • France
    • Spain
    • Russia
    • Rest of Europe
  • Japan
  • Asia Pacific excluding Japan
    • China
    • India
    • Malaysia
    • Singapore
    • Australia
    • Rest of Asia Pacific excluding Japan
  • The Middle East and Africa
    • GCC Countries
    • Israel
    • South Africa
    • Rest of The Middle East and Africa

Table of Content

  • 1. Executive Summary
  • 2. Market Overview
  • 3. Market Background
  • 4. Global Market Analysis 2020 to 2024 and Forecast, 2025 to 2035
  • 5. Global Market Analysis 2020 to 2024 and Forecast 2025 to 2035, By Component
    • 5.1. Hardware
    • 5.2. Software
    • 5.3. Services
  • 6. Global Market Analysis 2020 to 2024 and Forecast 2025 to 2035, By System Type
    • 6.1. Fingerprint Systems
    • 6.2. Face Recognition Systems
    • 6.3. Iris Recognition Systems
    • 6.4. Card-Based Systems
    • 6.5. Others
  • 7. Global Market Analysis 2020 to 2024 and Forecast 2025 to 2035, By Industry
    • 7.1. IT & Telecom
    • 7.2. BFSI
    • 7.3. Military & Defence
    • 7.4. Manufacturing
    • 7.5. Healthcare
    • 7.6. Transportation & Logistics
    • 7.7. Government
    • 7.8. Education
    • 7.9. Others
  • 8. Global Market Analysis 2020 to 2024 and Forecast 2025 to 2035, By Region
    • 8.1. North America
    • 8.2. Latin America
    • 8.3. Europe
    • 8.4. South Asia
    • 8.5. East Asia
    • 8.6. Oceania
    • 8.7. MEA
  • 9. North America Market Analysis 2020 to 2024 and Forecast 2025 to 2035, By Country
  • 10. Latin America Market Analysis 2020 to 2024 and Forecast 2025 to 2035, By Country
  • 11. Europe Market Analysis 2020 to 2024 and Forecast 2025 to 2035, By Country
  • 12. South Asia Market Analysis 2020 to 2024 and Forecast 2025 to 2035, By Country
  • 13. East Asia Market Analysis 2020 to 2024 and Forecast 2025 to 2035, By Country
  • 14. Oceania Market Analysis 2020 to 2024 and Forecast 2025 to 2035, By Country
  • 15. MEA Market Analysis 2020 to 2024 and Forecast 2025 to 2035, By Country
  • 16. Key Countries Market Analysis
  • 17. Market Structure Analysis
  • 18. Competition Analysis
    • 18.1. Identiv
    • 18.2. Honeywell International Inc.
    • 18.3. NEC Corporation
    • 18.4. Johnson Controls
    • 18.5. Bosch Security and Safety Systems
    • 18.6. Assa Abloy
    • 18.8. STANLEY Convergent Security Solutions, Inc.
    • 18.9. 3M
    • 18.10. Secom Co., Ltd.
    • 18.11. Dormakaba Holding AG
    • 18.12. HID Global
    • 18.13. Matrix Comsec Pvt. Ltd.
    • 18.14. Paxton Access Ltd.
    • 18.15. BioEnable Technologies Pvt Ltd.
    • 18.16. ZKTeco India
  • 19. Assumptions & Acronyms Used
  • 20. Research Methodology

List of Tables

  • Table 1: Global Market Value (USD Million) Forecast by Region, 2020 to 2035
  • Table 2: Global Market Value (USD Million) Forecast by Component, 2020 to 2035
  • Table 3: Global Market Value (USD Million) Forecast by System Type, 2020 to 2035
  • Table 4: Global Market Value (USD Million) Forecast by Industry, 2020 to 2035
  • Table 5: North America Market Value (USD Million) Forecast by Country, 2020 to 2035
  • Table 6: North America Market Value (USD Million) Forecast by Component, 2020 to 2035
  • Table 7: North America Market Value (USD Million) Forecast by System Type, 2020 to 2035
  • Table 8: North America Market Value (USD Million) Forecast by Industry, 2020 to 2035
  • Table 9: Latin America Market Value (USD Million) Forecast by Country, 2020 to 2035
  • Table 10: Latin America Market Value (USD Million) Forecast by Component, 2020 to 2035
  • Table 11: Latin America Market Value (USD Million) Forecast by System Type, 2020 to 2035
  • Table 12: Latin America Market Value (USD Million) Forecast by Industry, 2020 to 2035
  • Table 13: Europe Market Value (USD Million) Forecast by Country, 2020 to 2035
  • Table 14: Europe Market Value (USD Million) Forecast by Component, 2020 to 2035
  • Table 15: Europe Market Value (USD Million) Forecast by System Type, 2020 to 2035
  • Table 16: Europe Market Value (USD Million) Forecast by Industry, 2020 to 2035
  • Table 17: South Asia Market Value (USD Million) Forecast by Country, 2020 to 2035
  • Table 18: South Asia Market Value (USD Million) Forecast by Component, 2020 to 2035
  • Table 19: South Asia Market Value (USD Million) Forecast by System Type, 2020 to 2035
  • Table 20: South Asia Market Value (USD Million) Forecast by Industry, 2020 to 2035
  • Table 21: East Asia Market Value (USD Million) Forecast by Country, 2020 to 2035
  • Table 22: East Asia Market Value (USD Million) Forecast by Component, 2020 to 2035
  • Table 23: East Asia Market Value (USD Million) Forecast by System Type, 2020 to 2035
  • Table 24: East Asia Market Value (USD Million) Forecast by Industry, 2020 to 2035
  • Table 25: Oceania Market Value (USD Million) Forecast by Country, 2020 to 2035
  • Table 26: Oceania Market Value (USD Million) Forecast by Component, 2020 to 2035
  • Table 27: Oceania Market Value (USD Million) Forecast by System Type, 2020 to 2035
  • Table 28: Oceania Market Value (USD Million) Forecast by Industry, 2020 to 2035
  • Table 29: MEA Market Value (USD Million) Forecast by Country, 2020 to 2035
  • Table 30: MEA Market Value (USD Million) Forecast by Component, 2020 to 2035
  • Table 31: MEA Market Value (USD Million) Forecast by System Type, 2020 to 2035
  • Table 32: MEA Market Value (USD Million) Forecast by Industry, 2020 to 2035

List of Figures

  • Figure 1: Global Market Value (USD Million) by Component, 2025 to 2035
  • Figure 2: Global Market Value (USD Million) by System Type, 2025 to 2035
  • Figure 3: Global Market Value (USD Million) by Industry, 2025 to 2035
  • Figure 4: Global Market Value (USD Million) by Region, 2025 to 2035
  • Figure 5: Global Market Value (USD Million) Analysis by Region, 2020 to 2035
  • Figure 6: Global Market Value Share (%) and BPS Analysis by Region, 2025 to 2035
  • Figure 7: Global Market Y-o-Y Growth (%) Projections by Region, 2025 to 2035
  • Figure 8: Global Market Value (USD Million) Analysis by Component, 2020 to 2035
  • Figure 9: Global Market Value Share (%) and BPS Analysis by Component, 2025 to 2035
  • Figure 10: Global Market Y-o-Y Growth (%) Projections by Component, 2025 to 2035
  • Figure 11: Global Market Value (USD Million) Analysis by System Type, 2020 to 2035
  • Figure 12: Global Market Value Share (%) and BPS Analysis by System Type, 2025 to 2035
  • Figure 13: Global Market Y-o-Y Growth (%) Projections by System Type, 2025 to 2035
  • Figure 14: Global Market Value (USD Million) Analysis by Industry, 2020 to 2035
  • Figure 15: Global Market Value Share (%) and BPS Analysis by Industry, 2025 to 2035
  • Figure 16: Global Market Y-o-Y Growth (%) Projections by Industry, 2025 to 2035
  • Figure 17: Global Market Attractiveness by Component, 2025 to 2035
  • Figure 18: Global Market Attractiveness by System Type, 2025 to 2035
  • Figure 19: Global Market Attractiveness by Industry, 2025 to 2035
  • Figure 20: Global Market Attractiveness by Region, 2025 to 2035
  • Figure 21: North America Market Value (USD Million) by Component, 2025 to 2035
  • Figure 22: North America Market Value (USD Million) by System Type, 2025 to 2035
  • Figure 23: North America Market Value (USD Million) by Industry, 2025 to 2035
  • Figure 24: North America Market Value (USD Million) by Country, 2025 to 2035
  • Figure 25: North America Market Value (USD Million) Analysis by Country, 2020 to 2035
  • Figure 26: North America Market Value Share (%) and BPS Analysis by Country, 2025 to 2035
  • Figure 27: North America Market Y-o-Y Growth (%) Projections by Country, 2025 to 2035
  • Figure 28: North America Market Value (USD Million) Analysis by Component, 2020 to 2035
  • Figure 29: North America Market Value Share (%) and BPS Analysis by Component, 2025 to 2035
  • Figure 30: North America Market Y-o-Y Growth (%) Projections by Component, 2025 to 2035
  • Figure 31: North America Market Value (USD Million) Analysis by System Type, 2020 to 2035
  • Figure 32: North America Market Value Share (%) and BPS Analysis by System Type, 2025 to 2035
  • Figure 33: North America Market Y-o-Y Growth (%) Projections by System Type, 2025 to 2035
  • Figure 34: North America Market Value (USD Million) Analysis by Industry, 2020 to 2035
  • Figure 35: North America Market Value Share (%) and BPS Analysis by Industry, 2025 to 2035
  • Figure 36: North America Market Y-o-Y Growth (%) Projections by Industry, 2025 to 2035
  • Figure 37: North America Market Attractiveness by Component, 2025 to 2035
  • Figure 38: North America Market Attractiveness by System Type, 2025 to 2035
  • Figure 39: North America Market Attractiveness by Industry, 2025 to 2035
  • Figure 40: North America Market Attractiveness by Country, 2025 to 2035
  • Figure 41: Latin America Market Value (USD Million) by Component, 2025 to 2035
  • Figure 42: Latin America Market Value (USD Million) by System Type, 2025 to 2035
  • Figure 43: Latin America Market Value (USD Million) by Industry, 2025 to 2035
  • Figure 44: Latin America Market Value (USD Million) by Country, 2025 to 2035
  • Figure 45: Latin America Market Value (USD Million) Analysis by Country, 2020 to 2035
  • Figure 46: Latin America Market Value Share (%) and BPS Analysis by Country, 2025 to 2035
  • Figure 47: Latin America Market Y-o-Y Growth (%) Projections by Country, 2025 to 2035
  • Figure 48: Latin America Market Value (USD Million) Analysis by Component, 2020 to 2035
  • Figure 49: Latin America Market Value Share (%) and BPS Analysis by Component, 2025 to 2035
  • Figure 50: Latin America Market Y-o-Y Growth (%) Projections by Component, 2025 to 2035
  • Figure 51: Latin America Market Value (USD Million) Analysis by System Type, 2020 to 2035
  • Figure 52: Latin America Market Value Share (%) and BPS Analysis by System Type, 2025 to 2035
  • Figure 53: Latin America Market Y-o-Y Growth (%) Projections by System Type, 2025 to 2035
  • Figure 54: Latin America Market Value (USD Million) Analysis by Industry, 2020 to 2035
  • Figure 55: Latin America Market Value Share (%) and BPS Analysis by Industry, 2025 to 2035
  • Figure 56: Latin America Market Y-o-Y Growth (%) Projections by Industry, 2025 to 2035
  • Figure 57: Latin America Market Attractiveness by Component, 2025 to 2035
  • Figure 58: Latin America Market Attractiveness by System Type, 2025 to 2035
  • Figure 59: Latin America Market Attractiveness by Industry, 2025 to 2035
  • Figure 60: Latin America Market Attractiveness by Country, 2025 to 2035
  • Figure 61: Europe Market Value (USD Million) by Component, 2025 to 2035
  • Figure 62: Europe Market Value (USD Million) by System Type, 2025 to 2035
  • Figure 63: Europe Market Value (USD Million) by Industry, 2025 to 2035
  • Figure 64: Europe Market Value (USD Million) by Country, 2025 to 2035
  • Figure 65: Europe Market Value (USD Million) Analysis by Country, 2020 to 2035
  • Figure 66: Europe Market Value Share (%) and BPS Analysis by Country, 2025 to 2035
  • Figure 67: Europe Market Y-o-Y Growth (%) Projections by Country, 2025 to 2035
  • Figure 68: Europe Market Value (USD Million) Analysis by Component, 2020 to 2035
  • Figure 69: Europe Market Value Share (%) and BPS Analysis by Component, 2025 to 2035
  • Figure 70: Europe Market Y-o-Y Growth (%) Projections by Component, 2025 to 2035
  • Figure 71: Europe Market Value (USD Million) Analysis by System Type, 2020 to 2035
  • Figure 72: Europe Market Value Share (%) and BPS Analysis by System Type, 2025 to 2035
  • Figure 73: Europe Market Y-o-Y Growth (%) Projections by System Type, 2025 to 2035
  • Figure 74: Europe Market Value (USD Million) Analysis by Industry, 2020 to 2035
  • Figure 75: Europe Market Value Share (%) and BPS Analysis by Industry, 2025 to 2035
  • Figure 76: Europe Market Y-o-Y Growth (%) Projections by Industry, 2025 to 2035
  • Figure 77: Europe Market Attractiveness by Component, 2025 to 2035
  • Figure 78: Europe Market Attractiveness by System Type, 2025 to 2035
  • Figure 79: Europe Market Attractiveness by Industry, 2025 to 2035
  • Figure 80: Europe Market Attractiveness by Country, 2025 to 2035
  • Figure 81: South Asia Market Value (USD Million) by Component, 2025 to 2035
  • Figure 82: South Asia Market Value (USD Million) by System Type, 2025 to 2035
  • Figure 83: South Asia Market Value (USD Million) by Industry, 2025 to 2035
  • Figure 84: South Asia Market Value (USD Million) by Country, 2025 to 2035
  • Figure 85: South Asia Market Value (USD Million) Analysis by Country, 2020 to 2035
  • Figure 86: South Asia Market Value Share (%) and BPS Analysis by Country, 2025 to 2035
  • Figure 87: South Asia Market Y-o-Y Growth (%) Projections by Country, 2025 to 2035
  • Figure 88: South Asia Market Value (USD Million) Analysis by Component, 2020 to 2035
  • Figure 89: South Asia Market Value Share (%) and BPS Analysis by Component, 2025 to 2035
  • Figure 90: South Asia Market Y-o-Y Growth (%) Projections by Component, 2025 to 2035
  • Figure 91: South Asia Market Value (USD Million) Analysis by System Type, 2020 to 2035
  • Figure 92: South Asia Market Value Share (%) and BPS Analysis by System Type, 2025 to 2035
  • Figure 93: South Asia Market Y-o-Y Growth (%) Projections by System Type, 2025 to 2035
  • Figure 94: South Asia Market Value (USD Million) Analysis by Industry, 2020 to 2035
  • Figure 95: South Asia Market Value Share (%) and BPS Analysis by Industry, 2025 to 2035
  • Figure 96: South Asia Market Y-o-Y Growth (%) Projections by Industry, 2025 to 2035
  • Figure 97: South Asia Market Attractiveness by Component, 2025 to 2035
  • Figure 98: South Asia Market Attractiveness by System Type, 2025 to 2035
  • Figure 99: South Asia Market Attractiveness by Industry, 2025 to 2035
  • Figure 100: South Asia Market Attractiveness by Country, 2025 to 2035
  • Figure 101: East Asia Market Value (USD Million) by Component, 2025 to 2035
  • Figure 102: East Asia Market Value (USD Million) by System Type, 2025 to 2035
  • Figure 103: East Asia Market Value (USD Million) by Industry, 2025 to 2035
  • Figure 104: East Asia Market Value (USD Million) by Country, 2025 to 2035
  • Figure 105: East Asia Market Value (USD Million) Analysis by Country, 2020 to 2035
  • Figure 106: East Asia Market Value Share (%) and BPS Analysis by Country, 2025 to 2035
  • Figure 107: East Asia Market Y-o-Y Growth (%) Projections by Country, 2025 to 2035
  • Figure 108: East Asia Market Value (USD Million) Analysis by Component, 2020 to 2035
  • Figure 109: East Asia Market Value Share (%) and BPS Analysis by Component, 2025 to 2035
  • Figure 110: East Asia Market Y-o-Y Growth (%) Projections by Component, 2025 to 2035
  • Figure 111: East Asia Market Value (USD Million) Analysis by System Type, 2020 to 2035
  • Figure 112: East Asia Market Value Share (%) and BPS Analysis by System Type, 2025 to 2035
  • Figure 113: East Asia Market Y-o-Y Growth (%) Projections by System Type, 2025 to 2035
  • Figure 114: East Asia Market Value (USD Million) Analysis by Industry, 2020 to 2035
  • Figure 115: East Asia Market Value Share (%) and BPS Analysis by Industry, 2025 to 2035
  • Figure 116: East Asia Market Y-o-Y Growth (%) Projections by Industry, 2025 to 2035
  • Figure 117: East Asia Market Attractiveness by Component, 2025 to 2035
  • Figure 118: East Asia Market Attractiveness by System Type, 2025 to 2035
  • Figure 119: East Asia Market Attractiveness by Industry, 2025 to 2035
  • Figure 120: East Asia Market Attractiveness by Country, 2025 to 2035
  • Figure 121: Oceania Market Value (USD Million) by Component, 2025 to 2035
  • Figure 122: Oceania Market Value (USD Million) by System Type, 2025 to 2035
  • Figure 123: Oceania Market Value (USD Million) by Industry, 2025 to 2035
  • Figure 124: Oceania Market Value (USD Million) by Country, 2025 to 2035
  • Figure 125: Oceania Market Value (USD Million) Analysis by Country, 2020 to 2035
  • Figure 126: Oceania Market Value Share (%) and BPS Analysis by Country, 2025 to 2035
  • Figure 127: Oceania Market Y-o-Y Growth (%) Projections by Country, 2025 to 2035
  • Figure 128: Oceania Market Value (USD Million) Analysis by Component, 2020 to 2035
  • Figure 129: Oceania Market Value Share (%) and BPS Analysis by Component, 2025 to 2035
  • Figure 130: Oceania Market Y-o-Y Growth (%) Projections by Component, 2025 to 2035
  • Figure 131: Oceania Market Value (USD Million) Analysis by System Type, 2020 to 2035
  • Figure 132: Oceania Market Value Share (%) and BPS Analysis by System Type, 2025 to 2035
  • Figure 133: Oceania Market Y-o-Y Growth (%) Projections by System Type, 2025 to 2035
  • Figure 134: Oceania Market Value (USD Million) Analysis by Industry, 2020 to 2035
  • Figure 135: Oceania Market Value Share (%) and BPS Analysis by Industry, 2025 to 2035
  • Figure 136: Oceania Market Y-o-Y Growth (%) Projections by Industry, 2025 to 2035
  • Figure 137: Oceania Market Attractiveness by Component, 2025 to 2035
  • Figure 138: Oceania Market Attractiveness by System Type, 2025 to 2035
  • Figure 139: Oceania Market Attractiveness by Industry, 2025 to 2035
  • Figure 140: Oceania Market Attractiveness by Country, 2025 to 2035
  • Figure 141: MEA Market Value (USD Million) by Component, 2025 to 2035
  • Figure 142: MEA Market Value (USD Million) by System Type, 2025 to 2035
  • Figure 143: MEA Market Value (USD Million) by Industry, 2025 to 2035
  • Figure 144: MEA Market Value (USD Million) by Country, 2025 to 2035
  • Figure 145: MEA Market Value (USD Million) Analysis by Country, 2020 to 2035
  • Figure 146: MEA Market Value Share (%) and BPS Analysis by Country, 2025 to 2035
  • Figure 147: MEA Market Y-o-Y Growth (%) Projections by Country, 2025 to 2035
  • Figure 148: MEA Market Value (USD Million) Analysis by Component, 2020 to 2035
  • Figure 149: MEA Market Value Share (%) and BPS Analysis by Component, 2025 to 2035
  • Figure 150: MEA Market Y-o-Y Growth (%) Projections by Component, 2025 to 2035
  • Figure 151: MEA Market Value (USD Million) Analysis by System Type, 2020 to 2035
  • Figure 152: MEA Market Value Share (%) and BPS Analysis by System Type, 2025 to 2035
  • Figure 153: MEA Market Y-o-Y Growth (%) Projections by System Type, 2025 to 2035
  • Figure 154: MEA Market Value (USD Million) Analysis by Industry, 2020 to 2035
  • Figure 155: MEA Market Value Share (%) and BPS Analysis by Industry, 2025 to 2035
  • Figure 156: MEA Market Y-o-Y Growth (%) Projections by Industry, 2025 to 2035
  • Figure 157: MEA Market Attractiveness by Component, 2025 to 2035
  • Figure 158: MEA Market Attractiveness by System Type, 2025 to 2035
  • Figure 159: MEA Market Attractiveness by Industry, 2025 to 2035
  • Figure 160: MEA Market Attractiveness by Country, 2025 to 2035

Frequently Asked Questions

What will be the Growth Rate for the Overall Global Access Control Market?

The global market could be developed at an impressive 12.4% CAGR until 2035.

Which is the Leading Market for Sales of Access Control Systems?

The United States is the leading market and could achieve a sales volume of 4,328.4 units in 2023.

How China will Progress its Access Control Market in the Coming Days?

Government investments are expected to drive the China market at 12% CAGR through 2033.

Which System Type Segment Can Create a Higher Access Control Market Potential?

The Iris recognition access control system segment is projected to grow at 16% CAGR through 2033.

Why India is Considered a Lucrative Market for Access Control Systems in Recent Years?

IT boom in India is projected to drive its Access Control market at 9.8% CAGR up till 2033.

Explore Similar Insights

Future Market Insights

Access Control Market