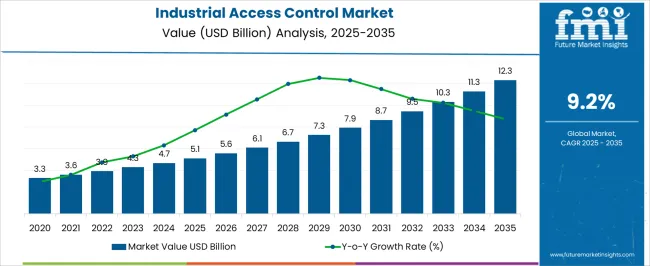
The Industrial Access Control Market is estimated to be valued at USD 5.1 billion in 2025 and is projected to reach USD 12.3 billion by 2035, registering a compound annual growth rate (CAGR) of 9.2% over the forecast period.
| Metric | Value |
|---|---|
| Industrial Access Control Market Estimated Value in (2025 E) | USD 5.1 billion |
| Industrial Access Control Market Forecast Value in (2035 F) | USD 12.3 billion |
| Forecast CAGR (2025 to 2035) | 9.2% |
The industrial access control market is expanding steadily due to heightened requirements for workplace security, regulatory compliance, and the protection of critical infrastructure. Growing concerns over unauthorized entry, theft, and sabotage have encouraged industries to adopt advanced access control systems that ensure real time monitoring and secure authentication.
Advancements in biometric technologies, integration with IoT platforms, and the use of AI driven analytics are further enhancing system reliability and efficiency. The emphasis on energy efficient, scalable, and interoperable security systems is also influencing adoption patterns across industrial environments.
With regulatory mandates and rising awareness regarding cybersecurity and physical safety, the outlook remains positive as enterprises continue to invest in sophisticated access control solutions to safeguard operations and personnel.
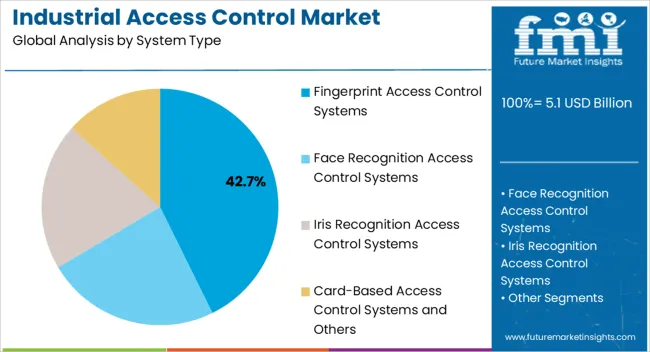
The fingerprint access control systems segment is projected to account for 42.70% of the total revenue by 2025 within the system type category, establishing it as the leading segment. The growth is attributed to the accuracy, convenience, and reliability offered by biometric authentication.
Fingerprint systems eliminate the risk of lost or stolen credentials while providing quick and secure access. Their integration into industrial facilities has been accelerated by increasing cost efficiency and technological advancements that allow seamless scalability.
The demand for strong identity verification methods across industries with high security requirements has further reinforced the position of this segment as the most preferred system type.
The hardware segment is expected to represent 54.30% of the total revenue by 2025 within the component category, making it the dominant segment. This leadership is driven by the essential role of physical devices such as biometric scanners, card readers, and control panels in industrial security infrastructure.
Continuous innovations in sensor technology, durability, and system compatibility have strengthened the relevance of hardware solutions. Investments in upgrading existing security frameworks and the requirement for reliable physical access points have contributed to this segment’s dominance.
Hardware remains a fundamental enabler of industrial access control systems, underpinning secure and efficient operations across diverse industrial facilities.
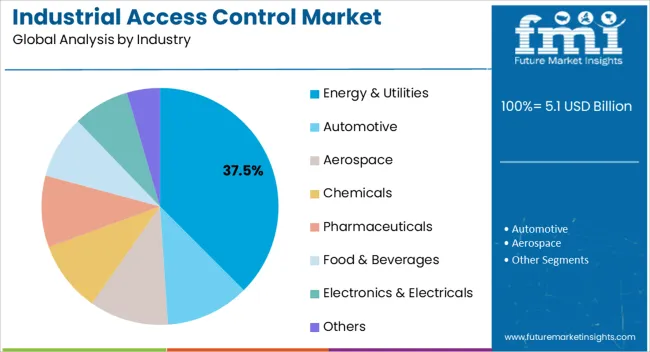
The energy and utilities segment is estimated to hold 37.50% of the total market revenue by 2025 within the industry category, making it the leading vertical. This prominence is driven by the need to secure critical infrastructure, protect assets, and comply with stringent safety and regulatory standards.
Facilities in this sector are highly vulnerable to both physical and cyber threats, necessitating robust access control systems. Biometric and smart card based solutions are increasingly deployed in power plants, substations, and utility facilities to ensure only authorized personnel gain access to sensitive areas.
The rising global focus on securing energy supply chains and reducing operational risks has reinforced the adoption of access control systems in this sector, securing its leadership within the market.
Evolving security threats and concerns related to data security and privacy are likely to drive the market over the coming years. The industrial access control demand will rise at 9.2% CAGR between 2025 and 2035.
Cyber threats on cyberspace evolve through time capitalizing on new approaches. Concerns regarding cyber threats are rapidly growing on critical infrastructure such as electricity grids, manufacturing sectors, automotive industries and healthcare systems to use in terrorism, sabotage and information warfare.
| Period | Market Size (in USD billion) |
|---|---|
| 2020 | 1600.5 |
| 2025 | 3,653.5 |
| 2025 | 4,285.0 |
| 2035 | 10,363.1 |
As the range of potential threats continues to expand, organizations are increasingly find themselves in a position having to make security decisions, by configuring their security-related settings, responding to security-related events and messages, or enforced to specify security policy and access rights.
Examples of threats that access control system protects against are unauthorized access into areas and theft of mobile devices. Attackers can gain entry into secured areas through tailgating, hacking into access control smart cards or breaking in through doors. Defenses for these threats include physical intrusion detection systems, biometrics, and alarm systems.
Access control is an effective method to ensure the safety and security of humans, industrial assets and data. These systems are based on authentication and authorization and are the most widely used strategy for data security prevention and protection in data systems. It can restrict access to key resources and prevent intrusion of illegal users or inadvertent operation of legitimate users.
Owing to the various initiatives undertaken by companies across various countries, awareness about cybercrime and security data is increasing significantly. Companies are taking steps to secure their data and enterprise information from various internal and external digital attacks on the cloud as well as on-premise.
Increasing awareness about cybercrimes and data security is expected to drive the industrial access control systems during the forecast period. Furthermore, the digitization of workloads is growing steadily in various countries, such as India, China, the USA, France, Germany, and Japan, and enterprises are adopting advance access control technologies such as biometrics and access control solutions.
While this exposes new endpoints to cyber-attacks and digital frauds, it also provides significant opportunities for the adoption of access control solutions.
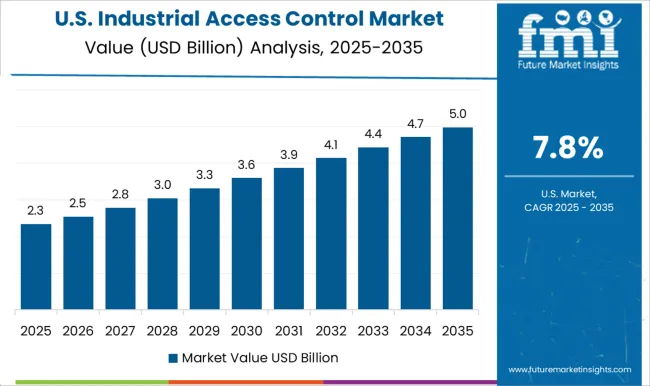
United States is a leading market for industrial access control system in North America according to Future Market Insights. Government of the United States. has adopted various initiatives to ascertain advanced security of United States residents.
It also has adopted access control systems to securely enroll, issue, and verify physical and digital identity credentials for millions of United States residents. According to the study, the United States is expected to account for over 29.4% of the North America market through 2035.
The industrial sector is among the largest and most influential sectors of the United States economy. According to ACS estimates, the number of people employed in the United States manufacturing industry and sub-sectors has been growing at a rate of 0.41%, from 15.4M people in 2020 to 15.5M people in 2020.
The country also exhibits the presence of several key vendors such as Honeywell International Inc., NEC Corporation, Identiv, Inc., and 3M Company who develops advanced access control technology for industrial sectors. Over the years, the country’s spending on access control has greatly increased, which is ultimately propelling the demand of access control systems.
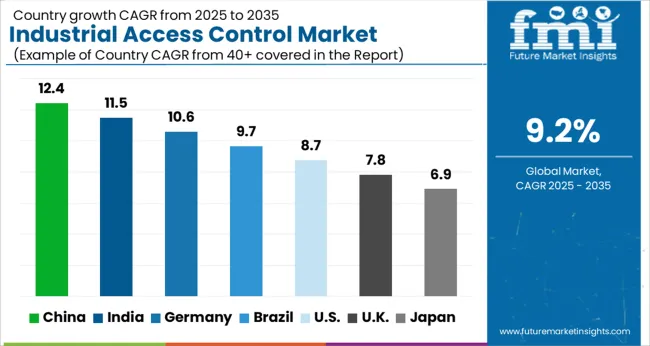
Demand in the United Kingdom market is expected to rise at nearly 8.9% CAGR over the forecast period. In the United Kingdom critical infrastructures such as manufacturing plants, power & energy plants, and oil & gas sectors have become increasingly dependent on digital technologies to run their core business. Cybercrime and internal threats are increasing in number and sophistication across United Kingdom and other major countries in Europe.
The ransomware attack on Colonial Pipeline Co. in the month of May 2024, ignited concerns about cybersecurity in Europe, where lawmakers are drafting laws that will apply to energy firms and other critical infrastructure. Such attacks on critical infrastructure demonstrate why cyber security is increasingly on the national agenda for governments and firms in the United Kingdom and Europe.
Due to the rise in digital transformation, coupled with increasing cyber threats and attacks on critical infrastructures in the United Kingdom. and other countries of Europe propels the demand for access control solutions in the country.
India is expected to rise at nearly 10.4% CAGR over the forecast period. Industrial facilities in India, particularly the power sector, are showing early signs of higher demand for cyber security systems as operations increasingly turn digital. Digitally connected industries across India have become more vulnerable to attackers who are looking to exploit resources and data.
Most of the industrial organizations have lack of effective cyber security measures within their IoT-enabled production environments which is posing a serious threat to the future of cyber security in the world and India.
The prominent factor contributing to the high growth rate for access control solutions in India is increasing industrialization in India. The country has many established small as well as large industrial organizations, which are growing at an exponential rate to cater to large customer bases.
Based on system type, fingerprint access control systems segment is expected to grow at a high pace, accounting market share of nearly 34.2% of the market in 2035. The rapid growth of the fingerprint access control systems segment can be attributed to its superior security, accuracy, and user-friendly experience. With increasing demand for robust authentication solutions, fingerprint access control systems offer a reliable and efficient method for access management. Their widespread adoption across various industries and applications is projected to drive significant market share, making them a key player in the industrial access control market by 2035.
In the industrial access control research study, automotive, electronics & electrical, and energy & utilities industries revenue totaled USD 2,000 million for 2025.
By industry segment, electronics & electrical segment is dominating the global industrial access control system market. The segment is estimated to account for a market share of 23.5% by the end of 2025.
However, the automotive segment is estimated to grow the fastest during the forecast period. The segment is projected to witness a CAGR of 10.6% during the forecast period 2025 to 33.
Information and data security is becoming the top priority for industrial organizations to secure their information and other digital assets from insider as well as outside threats. The latter goal largely depends on guaranteeing a safe and secure place for workers, visitors, plant managers, and other leaders.
An order to create the most secure environment across the industrial plant, it has become highly necessary for organizations to implement integrated access control solutions that layer several different technologies and work in conjunction with a comprehensive contingency plan to help increase overall human and asset protection.
Access Control is, therefore, a best way to seamlessly fuse these solutions and assist the industrial organizations by providing highest level of safety, security and productivity with greater efficiency. Several industrial organizations such as automotive, healthcare, energy & utilities, manufacturing, are continuously adopting access management solutions to ensure that only authorized individuals have access to their resources at the right time and for the right reasons.
The fingerprint biometrics systems are expected to contribute maximum revenue share of 36.1% in the global market of industrial access control in the year 2025.
Biometrics systems are automated methods of recognizing an individual based on their physiological or behavioral characteristic. Fingerprint biometrics is a major segment of biometrics systems. Fingerprint biometric technology is used to match the fingerprint patterns of an individual with the internal database to verify individual’s identity.
The technology is used in numerous applications including physical access control, time and attendance, smart devices, law enforcement, and among other. The rise in document and identity theft, along with increasing threats such as terrorism or cybercrime, and the changes in international regulations are some of the major factors that would drive the demand of fingerprint biometric solution in industrial access control market.
The competitive landscape of the industrial access control market is characterized by the presence of several key players and a mix of large multinational companies, regional players, and niche solution providers.
Companies such as Honeywell, Bosch Security Systems, and Johnson Controls, dominate the market with their extensive product portfolios and global presence. These established players leverage their brand reputation, technological expertise, and strong customer relationships to maintain a competitive edge.
There are also emerging players that focus on niche segments, offering specialized access control solutions tailored to specific industries or unique customer requirements. The competitive dynamics are driven by factors like product innovation, strategic partnerships, mergers and acquisitions, and the ability to provide comprehensive and scalable solutions that address evolving security challenges.
Continuous technological advancements and a customer-centric approach will be crucial for companies to gain a competitive advantage in this rapidly evolving market.
Strategies for Industrial Access Control Manufacturers to Expand in the Market
Recent Developments in the Industrial Access Control Industry:
| Attribute | Details |
|---|---|
| Market Value in 2025 | USD 5.1 billion |
| Market Value in 2035 | USD 12.3 billion |
| Growth Rate | CAGR of 9.2% from 2025 to 2035 |
| Base Year for Estimation | 2025 |
| Historical Data | 2020 to 2025 |
| Forecast Period | 2025 to 2035 |
| Quantitative Units | Revenue in US Billion and CAGR from 2025 to 2035 |
| Report Coverage | Revenue Forecast, Company Ranking, Competitive Landscape, Growth Factors, Trends and Pricing Analysis |
| Segments Covered | System Type, Component, Industry, Region |
| Regions Covered | North America; Latin America; Europe; Asia Pacific; Middle East and Africa |
| Key Countries Profiled | United States, Canada, Brazil, Mexico, Germany, United Kingdom, France, Spain, Italy, China, Japan, South Korea, Singapore, Thailand, Indonesia, Australia, New Zealand, GCC Countries, South Africa, Israel |
| Key Companies Profiled | Honeywell International Inc.; Bosch Security and Safety Systems; Matrix Comsec Pvt. Ltd.; HID Global; BioEnable Technologies Pvt Ltd.; Paxton Access Ltd.; Assa Abloy AB; NEC Corporation; 3M; Johnson Controls; Thales Group; Dormakaba Holding AG; Identiv; STANLEY Convergent Security Solutions, Inc.; Secom Co., Ltd. |
| Customization | Available Upon Request |
The global industrial access control market is estimated to be valued at USD 5.1 billion in 2025.
The market size for the industrial access control market is projected to reach USD 12.3 billion by 2035.
The industrial access control market is expected to grow at a 9.2% CAGR between 2025 and 2035.
The key product types in industrial access control market are fingerprint access control systems, face recognition access control systems, iris recognition access control systems and card-based access control systems and others.
In terms of component, hardware segment to command 54.3% share in the industrial access control market in 2025.


Our Research Products

The "Full Research Suite" delivers actionable market intel, deep dives on markets or technologies, so clients act faster, cut risk, and unlock growth.

The Leaderboard benchmarks and ranks top vendors, classifying them as Established Leaders, Leading Challengers, or Disruptors & Challengers.

Locates where complements amplify value and substitutes erode it, forecasting net impact by horizon

We deliver granular, decision-grade intel: market sizing, 5-year forecasts, pricing, adoption, usage, revenue, and operational KPIs—plus competitor tracking, regulation, and value chains—across 60 countries broadly.

Spot the shifts before they hit your P&L. We track inflection points, adoption curves, pricing moves, and ecosystem plays to show where demand is heading, why it is changing, and what to do next across high-growth markets and disruptive tech

Real-time reads of user behavior. We track shifting priorities, perceptions of today’s and next-gen services, and provider experience, then pace how fast tech moves from trial to adoption, blending buyer, consumer, and channel inputs with social signals (#WhySwitch, #UX).

Partner with our analyst team to build a custom report designed around your business priorities. From analysing market trends to assessing competitors or crafting bespoke datasets, we tailor insights to your needs.
Supplier Intelligence
Discovery & Profiling
Capacity & Footprint
Performance & Risk
Compliance & Governance
Commercial Readiness
Who Supplies Whom
Scorecards & Shortlists
Playbooks & Docs
Category Intelligence
Definition & Scope
Demand & Use Cases
Cost Drivers
Market Structure
Supply Chain Map
Trade & Policy
Operating Norms
Deliverables
Buyer Intelligence
Account Basics
Spend & Scope
Procurement Model
Vendor Requirements
Terms & Policies
Entry Strategy
Pain Points & Triggers
Outputs
Pricing Analysis
Benchmarks
Trends
Should-Cost
Indexation
Landed Cost
Commercial Terms
Deliverables
Brand Analysis
Positioning & Value Prop
Share & Presence
Customer Evidence
Go-to-Market
Digital & Reputation
Compliance & Trust
KPIs & Gaps
Outputs
Full Research Suite comprises of:
Market outlook & trends analysis
Interviews & case studies
Strategic recommendations
Vendor profiles & capabilities analysis
5-year forecasts
8 regions and 60+ country-level data splits
Market segment data splits
12 months of continuous data updates
DELIVERED AS:
PDF EXCEL ONLINE
Access Control as a Service Market Size and Share Forecast Outlook 2025 to 2035
Access Control Market Analysis - Size, Share, and Forecast 2025 to 2035
Access Control and Authentication Market Analysis & Forecast by Technology, Component, Application and Region through 2035
Access Control Readers Market
Industrial Control Network Modules Market Size and Share Forecast Outlook 2025 to 2035
Industrial Access Platform Market
Industrial Control Transformer Market
Industrial Pump Control Panels Market Trends & Forecast 2025 to 2035
Industrial Robot Controller Market Size and Share Forecast Outlook 2025 to 2035
Industrial Noise Control Market Size and Share Forecast Outlook 2025 to 2035
Network Access Control (NAC) Market Size and Share Forecast Outlook 2025 to 2035
Industrial Temperature Controller Market Analysis - Size & Industry Trends 2025 to 2035
Building Access Control Security Market Size and Share Forecast Outlook 2025 to 2035
Adaptive Access Control Market Growth – Trends & Forecast through 2034
Pedestrian Access Control System Market Size and Share Forecast Outlook 2025 to 2035
Demand for Industrial Control Network Modules in UK Size and Share Forecast Outlook 2025 to 2035
North America Access Control Market - Security & IoT Integration 2025 to 2035
Card-Based Electronic Access Control Systems Market Growth - Forecast 2025 to 2035
Factory Automation And Industrial Controls Market Growth - Trends & Forecast 2025 to 2035
North America Keyless Vehicle Access Control Market - Growth & Forecast through 2035

Thank you!
You will receive an email from our Business Development Manager. Please be sure to check your SPAM/JUNK folder too.
Chat With
MaRIA