The global vapour barrier market is valued at USD 12.5 billion in 2025 and is forecasted to reach USD 20 billion by 2035, recording an absolute increase of USD 7.4 billion over the forecast period. This translates into a total growth of 59.2%, with the market forecast to expand at a CAGR of 4.8% between 2025 and 2035.
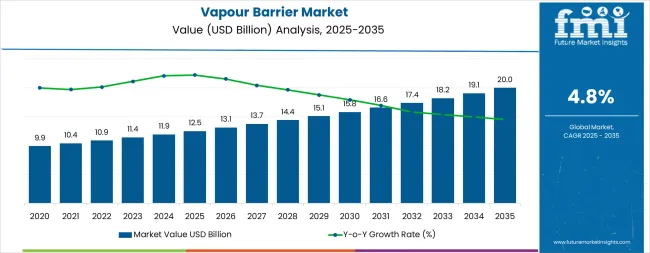
The overall market size is expected to grow by nearly 1.59X during the same period, supported by increasing energy efficiency requirements in building construction, growing adoption of moisture control systems in residential and commercial projects, and rising demand for high-performance building envelope solutions across diverse climate zones and construction applications.
Between 2025 and 2030, the market is projected to expand from USD 12.5 billion to USD 15.8 billion, resulting in a value increase of USD 3.3 billion, which represents 44.6% of the total forecast growth for the decade. This phase of development will be shaped by increasing building code requirements for condensation control, rising adoption of advanced membrane technologies, and growing demand for integrated moisture management solutions in energy-efficient construction and deep retrofit projects.
Building material manufacturers are expanding their vapour barrier product capabilities to address the growing demand for variable-permeance membranes, self-adhered systems, and low-VOC formulations for residential and commercial building envelopes.
From 2030 to 2035, the market is forecast to grow from USD 15.8 billion to USD 20 billion, adding another USD 4.1 billion, which constitutes 55.4% of the overall ten-year expansion. This period is expected to be characterized by the expansion of smart membrane technologies with adaptive permeance characteristics, the integration of advanced polymer formulations for extreme climate applications, and the development of fluid-applied barrier systems for complex architectural detailing.
The growing adoption of passive house standards and net-zero building requirements will drive demand for vapour barriers with enhanced hygrothermal performance, superior air-tightness integration, and minimal environmental impact throughout the product lifecycle.
Between 2020 and 2025, the market experienced steady growth, driven by increasing awareness of moisture-related building failures and growing recognition of vapour control systems as essential components for maintaining indoor air quality, preventing mold growth, and ensuring long-term structural integrity.
The market developed as building professionals recognized the potential for advanced vapour barriers to enhance energy efficiency while protecting building assemblies from condensation damage and moisture accumulation. Technological advancement in membrane manufacturing and installation methods began focusing the critical importance of proper moisture management in achieving durable and healthy building environments.
| Metric | Value |
|---|---|
| Estimated Value in (2025E) | USD 12.5 billion |
| Forecast Value in (2035F) | USD 20 billion |
| Forecast CAGR (2025 to 2035) | 4.8% |
Market expansion is being supported by the increasing stringency of building energy codes and the corresponding need for comprehensive moisture management solutions that can prevent condensation within insulated assemblies while maintaining thermal performance and indoor environmental quality. Modern construction professionals are increasingly focused on implementing vapour control strategies that can accommodate varying climate conditions, manage seasonal moisture flow, and provide reliable protection against water vapour transmission in both new construction and retrofit applications.
Vapour barriers' proven ability to deliver condensation control, structural protection, and energy efficiency enhancement make them essential components for contemporary building envelope systems and eco-friendly construction practices.
The growing focus on building durability and occupant health is driving demand for vapour barrier systems that can support mold prevention, reduce moisture-related damage, and enable long-term building performance across diverse climate zones and construction types. Building designers' preference for materials that combine technical performance with ease of installation and compatibility with insulation upgrades is creating opportunities for innovative vapour barrier implementations.
The rising influence of green building certifications, passive house standards, and resilient construction practices is also contributing to increased adoption of high-performance membranes and integrated air-vapour barrier systems that can provide superior moisture management in demanding building applications.
The vapour barrier market is poised for steady growth and technical evolution. As building codes across developed and emerging markets mandate tighter envelope performance, condensation control, and energy efficiency, vapour barriers are gaining recognition not just as commodity sheet goods but as engineered moisture-management systems critical to building durability, occupant health, and thermal performance.
Rising construction activity in humid and mixed climates, accelerating deep-retrofit programs in Europe and North America, and urbanization across Asia-Pacific amplify demand, while manufacturers are advancing innovations in variable-permeance membranes, self-adhered technologies, and fluid-applied systems.
Pathways like smart/adaptive membranes, integrated air-vapour barrier assemblies, and sustainability-led product development promise margin improvement, especially in specification-driven commercial and institutional segments. Geographic expansion and localization will capture volume growth in emerging Asian markets where envelope moisture control is increasingly codified. Regulatory drivers around energy performance, building durability standards, indoor air quality requirements, and climate resilience provide structural tailwinds.
The market is segmented by type, application, material, and region. By type, the market is divided into membranes, sheet, fluid/coatings, peel & stick, and films. By application, it covers insulation, waterproofing (below-grade/above-grade), air/vapour control layers, thermal assemblies (roofs/walls), and acoustic/sound applications.
By material, it is segmented into polymer-based (including advanced polymers), asphalt & bitumen, polyethylene, concrete/brick & mineral sheets, gypsum/boards, rubber/elastomeric, and others (glass, sheet metal, XPS, hybrids). Regionally, the market is divided into North America, Europe, East Asia, South Asia & Pacific, Latin America, and the Middle East & Africa.
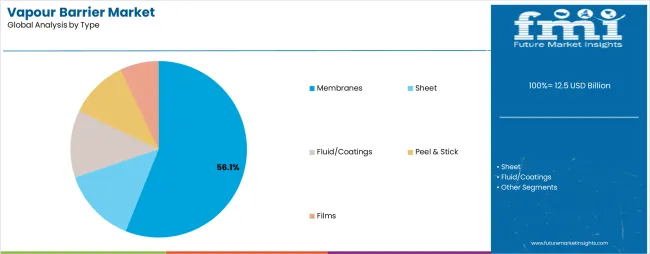
The membranes segment is projected to account for 56.1% of the vapour barrier market in 2025, reaffirming its position as the leading product type category. Building professionals increasingly utilize membrane vapour barriers for their superior flexibility, ease of installation, excellent conformability to complex surfaces, and consistent performance across diverse climate conditions and building assembly configurations.
Membrane technology's advanced material engineering and reliable moisture control capabilities directly address the construction industry requirements for durable building envelope protection and efficient installation in residential, commercial, and industrial applications.
Sheet products represent 17.0% of the type segment, offering cost-effective solutions for large-area applications and traditional construction methods. Fluid and coating systems account for 13.9% of the market, providing seamless coverage for irregular surfaces and complex detailing requirements where membrane installation is challenging.
Peel-and-stick products command 7.5% of the type segment, enabling simplified installation and improved adhesion for roofing and below-grade waterproofing applications. Films represent 5.5% of the market, serving specialized applications requiring ultra-thin profile and precise vapor transmission control.
This product type segment forms the foundation of modern building envelope construction, as it represents the format with the greatest versatility and widespread acceptance across multiple construction methods and climate zones. Manufacturer investments in advanced polymer formulations and installation-friendly designs continue to strengthen membrane adoption among contractors and specifiers.
With building codes prioritizing moisture management and energy efficiency, membrane vapour barriers align with both technical performance objectives and installation productivity requirements, making them the central component of comprehensive building envelope strategies.
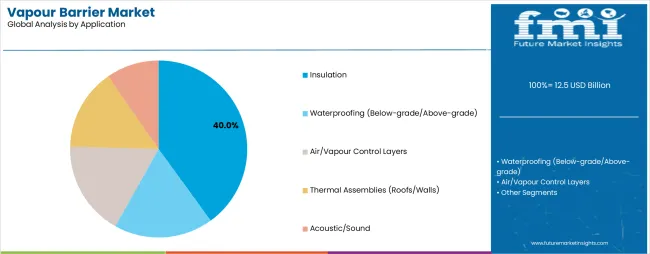
Insulation applications are projected to represent 40.0% of vapour barrier demand in 2025, underscoring their critical role as the primary application category requiring moisture control to prevent condensation within thermal insulation layers and maintain the effectiveness of building thermal performance systems.
Construction professionals prefer vapour barriers in insulation applications for their ability to protect insulation materials from moisture accumulation, prevent thermal performance degradation, and ensure long-term energy efficiency while enabling code-compliant wall, roof, and floor assemblies.
Waterproofing applications, including below-grade and above-grade installations, represent 22.0% of application demand, serving foundation walls, plaza decks, and roof assemblies requiring combined moisture and water protection. Air and vapour control layers account for 15.0% of the application market, providing integrated envelope solutions that address both air leakage and moisture diffusion in high-performance construction.
Thermal assemblies for roofs and walls command 13.0% of application demand, requiring specialized vapour management in complex multilayer building systems. Acoustic and sound control applications represent 10.0% of the segment, where vapour barriers contribute to both moisture management and sound attenuation in interior partition systems.
The segment is supported by continuous innovation in insulation technologies and the growing adoption of High-R-value assemblies that require proper moisture management to prevent interstitial condensation. The building designers are specifying comprehensive insulation upgrade packages that include appropriate vapour control strategies.
As energy code requirements become more stringent and building envelope performance expectations increase, insulation applications will continue to dominate the application market while supporting advanced moisture management and thermal efficiency optimization.
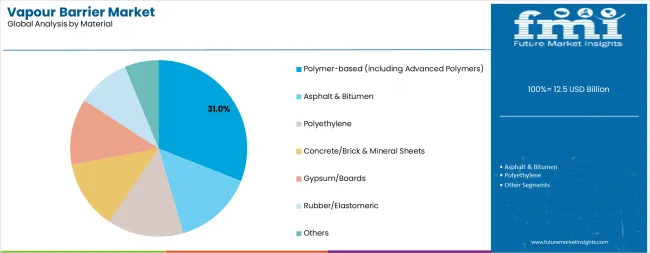
Polymer-based materials are projected to represent 31.0% of vapour barrier demand in 2025, underscoring their importance as the leading material category offering advanced performance characteristics, variable permeance capabilities, and superior durability for demanding building envelope applications.
Building material manufacturers increasingly develop polymer-based vapour barriers for their exceptional tear resistance, enhanced flexibility at low temperatures, excellent aging characteristics, and ability to incorporate smart membrane technologies that respond to changing humidity conditions.
Asphalt and bitumen materials represent 18.0% of the material segment, providing traditional waterproofing and vapour control with proven long-term performance in roofing and below-grade applications. Polyethylene accounts for 15.0% of material demand, offering cost-effective solutions for residential construction and slab-on-grade installations. Concrete, brick, and mineral sheet materials command 12.0% of the segment, serving specialized applications requiring non-combustible barriers and high compressive strength.
Gypsum and board products represent 9.0% of material demand, providing integrated solutions where structural sheathing and vapour control are combined. Rubber and elastomeric materials account for 8.0% of the segment, while other materials including glass, sheet metal, XPS, and hybrid systems represent 7.0% of the market.
The polymer-based segment is supported by continuous material science innovation and the growing availability of specialty formulations that enable variable permeance, low-temperature flexibility, and enhanced UV resistance. Material suppliers are investing in eco-friendly polymer development and bio-based alternatives to support green building requirements.
As building envelope complexity increases and performance standards become more demanding, polymer-based materials will continue to lead the material market while supporting next-generation membrane technologies and application-specific solutions.
The vapour barrier market is advancing steadily due to increasing building energy code requirements and growing awareness of moisture-related building failures that necessitate proper vapour management systems to prevent condensation damage, protect insulation performance, and maintain healthy indoor environments. The market faces challenges, including price competition from commodity sheet products, installation skill requirements for proper detailing and continuity, and the need for climate-specific product selection to avoid moisture trapping in assemblies. Innovation in variable-permeance membrane technologies and integrated air-vapour barrier systems continues to influence product development and market adoption patterns.
The growing adoption of climate-adaptive membranes that adjust their moisture permeability based on relative humidity conditions is enabling building designers to specify single-barrier solutions that can manage seasonal moisture flow in both directions, preventing winter condensation while allowing summer drying in mixed-climate and marine-climate applications. Smart membrane technologies provide superior hygrothermal performance while allowing more forgiving assembly designs that accommodate construction moisture and reduce the risk of trapped moisture in wall and roof systems. Manufacturers are increasingly recognizing the specification advantages of variable-permeance products for achieving both moisture safety and building durability across diverse climate conditions and building types.
Modern building envelope designers are specifying integrated air and vapour barrier assemblies that address both convective moisture transport through air leakage and diffusive moisture flow through vapor transmission, enabling comprehensive moisture management while supporting passive house certification, net-zero energy targets, and stringent airtightness requirements. These integrated systems improve installation quality while enabling more efficient envelope construction through reduced material layers and simplified detailing at penetrations and transitions. Advanced system integration also allows designers to achieve superior energy performance and building durability through coordinated moisture and thermal control strategies that address all moisture transport mechanisms.
Building contractors are adopting fluid-applied spray, roll, and trowel membrane systems along with self-adhered peel-and-stick products to improve installation productivity, ensure complete coverage at complex details and penetrations, and reduce reliance on mechanical fasteners that can compromise envelope continuity. These installation technologies enable seamless moisture protection while addressing labor availability challenges and supporting faster project schedules in both new construction and retrofit applications. The transition toward advanced application methods is creating differentiation opportunities for manufacturers while supporting construction industry productivity goals and quality assurance objectives in high-performance building envelope installations.
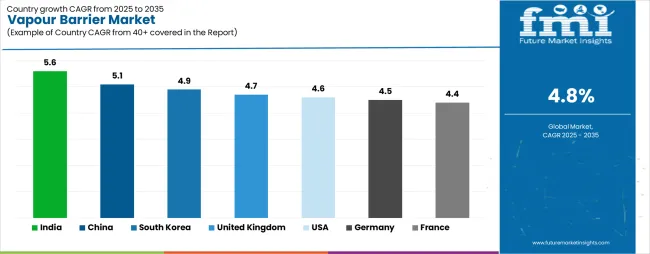
| Country | CAGR (2025-2035) |
|---|---|
| India | 5.6% |
| China | 5.1% |
| South Korea | 4.9% |
| United Kingdom | 4.7% |
| USA | 4.6% |
| Germany | 4.5% |
| France | 4.4% |
The market is experiencing steady growth globally, with India leading at a 5.6% CAGR through 2035, driven by expanding national housing and urban development missions, increasing moisture control requirements in hot-humid climate zones, and rapid adoption of polymer membrane technologies in prefabricated construction systems. China follows at 5.1%, supported by large commercial construction pipeline, tightening building code requirements for condensation control, and growing utilization of variable-permeance membranes for mixed-climate applications.
The United Kingdom shows growth at 4.7%, focusing timber-frame and off-site construction methods, building regulation updates, and deep-retrofit programs boosting vapour control layer installation with insulation upgrades. South Korea records 4.9%, focusing on smart-city development projects, high-rise building retrofits, and preference for advanced polymer and self-adhered systems in accelerated construction timelines.
The USA demonstrates 4.6% growth, driven by International Energy Conservation Code and ASHRAE moisture provisions, resilient roofing requirements in coastal zones, and rising membrane adoption in multifamily construction.
Germany exhibits 4.5% growth, focusing Energy Performance of Buildings Directive-aligned renovations, industrial and process buildings with strict hygrothermal design standards, and high market share of premium membrane products. France shows 4.4% growth, supported by RE2020 energy code implementation, roofing refurbishment activity, and low-VOC product preference in healthcare and educational building sectors.
The report covers an in-depth analysis of 40+ countries, top-performing countries are highlighted below.
India is projected to exhibit exceptional growth with a CAGR of 5.6% through 2035, driven by expanding urban housing development under national mission programs and rapidly growing awareness of moisture management requirements in hot-humid coastal and monsoon climate zones requiring proper vapour control in air-conditioned buildings.
The country's increasing adoption of modern construction methods and substantial investment in prefabricated and modular building systems are creating significant demand for advanced membrane solutions. Major construction companies and building material suppliers are establishing comprehensive vapour barrier product portfolios to serve both residential and commercial development projects.
Government support for affordable housing construction and smart city initiatives is driving demand for moisture management systems throughout major urban development corridors in Mumbai, Chennai, Bangalore, and Delhi NCR regions.
Strong infrastructure investment programs and an expanding network of commercial and institutional projects are supporting the rapid uptake of polymer membranes, self-adhered systems, and fluid-applied barriers among contractors seeking improved installation efficiency and building performance compliance with evolving energy conservation building codes.
China is expanding at a CAGR of 5.1%, supported by the country's massive commercial construction pipeline, increasingly stringent building energy efficiency standards, and growing recognition of condensation control importance in mixed-climate regions experiencing both heating and cooling seasons. The country's integrated building materials supply chain and large-scale construction activity are driving demand for advanced vapour control solutions across high-rise residential development, commercial office construction, and industrial facility projects. International building envelope specialists and domestic materials manufacturers are establishing extensive distribution and technical support capabilities to address the growing demand for variable-permeance membranes and integrated moisture management systems.
Rising adoption of prefabricated construction methods and expanding green building certification programs are creating opportunities for vapour barrier specification across commercial developers, institutional building owners, and residential construction companies in major metropolitan regions. Growing government focus on building energy efficiency and indoor environmental quality standards is driving adoption of advanced membrane technologies among construction enterprises seeking enhanced building performance and reduced operational energy consumption in climate-controlled buildings.
The United Kingdom is expanding at a CAGR of 4.7%, supported by the country's strong timber-frame and off-site construction industry, updated Building Regulations Part L requirements for thermal performance and airtightness, and comprehensive deep-retrofit programs targeting existing building stock for energy efficiency improvements.
The nation's focus on modern methods of construction and rapid project delivery is driving sophisticated vapour control layer requirements throughout the supply chain. Leading building envelope manufacturers and construction material suppliers are investing extensively in technical education and specification support to promote proper vapour barrier installation in both new construction and retrofit applications.
Rising adoption of off-site manufacturing for residential and commercial buildings is creating demand for factory-integrated vapour control systems that ensure quality and continuity in controlled manufacturing environments before site assembly.
Strong government commitment to building decarbonization and growing social housing retrofit programs are supporting increased consumption of high-performance membranes, integrated air-vapour barriers, and specialized transition products across renovation projects targeting improved thermal performance and moisture management in existing building envelopes.
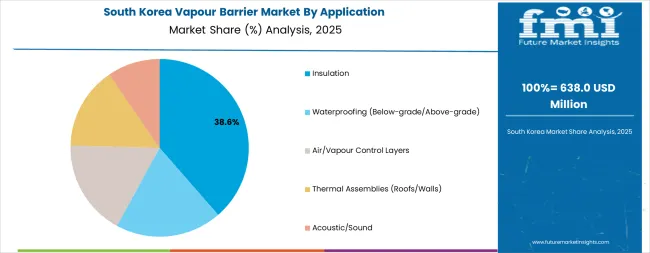
South Korea is growing at a CAGR of 4.9%, driven by the country's ambitious smart-city development programs, extensive high-rise residential and commercial building construction, and growing adoption of advanced polymer membrane systems that support accelerated construction schedules and high-quality envelope performance.
South Korea's technology leadership in building industrialization and construction automation is supporting demand for self-adhered vapour barriers and factory-applied moisture management systems that integrate with prefabricated facade and wall panel assemblies. Major construction contractors and building material companies are establishing comprehensive technical capabilities to support next-generation building envelope solutions.
Innovations in building information modeling and digital construction management are driving specification of high-performance vapour barriers with documented properties and installation verification systems that support quality assurance in fast-track project delivery. Growing retrofit activity in aging high-rise residential stock combined with stringent energy performance regulations is creating opportunities for specialized renovation membrane products and fluid-applied systems that accommodate complex detailing requirements in occupied building upgrades.
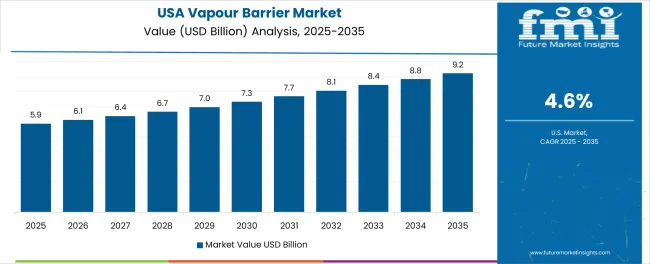
The USA is expanding at a CAGR of 4.6%, supported by the country's comprehensive building energy codes including International Energy Conservation Code and ASHRAE Standard 90.1 moisture control provisions, growing focus on resilient construction in hurricane-prone coastal regions, and increasing adoption of continuous insulation assemblies requiring proper vapour management in commercial and multifamily construction.
The nation's diverse climate zones and sophisticated building envelope design practices are driving specification of climate-appropriate vapour barriers throughout the construction industry. Leading membrane manufacturers and building envelope consultants are investing in regional technical support and contractor education programs to promote proper material selection and installation practices.
Rising adoption of spray foam insulation and continuous exterior insulation systems is creating demand for variable-permeance membranes and specialized interior vapour retarders that accommodate different assembly configurations and regional climate conditions. Strong multifamily housing construction activity and growing commercial renovation market are supporting increased consumption of self-adhered membranes, fluid-applied barriers, and integrated air-vapour barrier systems across diverse building types and renovation scopes in moisture-sensitive climate regions.
Germany is growing at a CAGR of 4.5%, driven by the country's leadership in building energy efficiency, comprehensive Energy Performance of Buildings Directive implementation through national renovation programs, and stringent hygrothermal design requirements for industrial, commercial, and residential construction.
Germany's engineering culture and focus on building science-based envelope design are supporting investment in premium vapour barrier solutions throughout the construction supply chain. Industry organizations and building material manufacturers are establishing comprehensive testing and validation programs to ensure vapour barrier performance under demanding moisture load conditions and long-term exposure scenarios.
Innovations in passive house construction and net-zero energy building design are creating demand for intelligent membrane systems with optimized permeance characteristics, integrated airtightness properties, and certified environmental profiles that support both technical performance and eco-friendly objectives. Growing industrial and process building construction requiring controlled interior humidity combined with extensive residential renovation activity is driving adoption of specialized vapour barriers, hybrid air-vapour barrier assemblies, and advanced detailing accessories throughout major construction markets and industrial regions.
France is expanding at a CAGR of 4.4%, supported by the country's implementation of RE2020 energy code requirements focusing both operational and embodied carbon reduction, substantial roofing refurbishment activity in commercial and institutional sectors, and strong preference for low-VOC and environmentally certified building products in healthcare, educational, and public buildings. France's established building envelope industry and comprehensive material certification systems are driving specification of quality-assured vapour barriers throughout architectural and engineering communities. Building material manufacturers are investing in product environmental declarations and health-focused certifications to serve specification requirements in public and institutional construction.
Traditional roofing renovation practices combined with modern energy efficiency upgrade requirements are creating opportunities for integrated roofing membrane and vapour barrier systems that provide both weatherproofing and moisture management in single-installation solutions. Growing adoption of biosourced and recycled-content construction materials combined with stringent indoor air quality requirements is driving development of eco-friendly vapour barrier formulations and low-emission membrane products throughout the French building materials market.
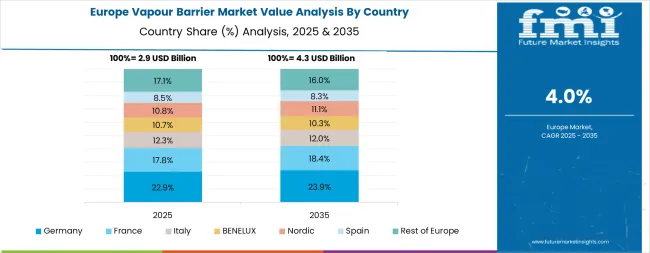
Europe's vapour barrier demand is concentrated in Germany, the United Kingdom, and France, followed by Italy, Spain, and the Nordic countries. Germany leads with high specification rates in industrial and multifamily construction combined with stringent energy-performance retrofit programs that mandate proper vapour control in insulation upgrade projects.
The United Kingdom shows strong penetration of vapour control layers in timber-frame and lightweight construction systems, with widespread adoption in roofing applications and retrofit insulation installations driven by Building Regulations requirements and off-site manufacturing practices.
France demonstrates balanced demand across residential retrofit programs and commercial roofing refurbishment, supported by RE2020 energy code implementation and low-VOC product preferences in institutional sectors. Italy and Spain show concentration in warm-climate roof and wall assemblies where variable-permeance membranes are favored to manage seasonal moisture flow and accommodate drying while preventing condensation during air-conditioning operation.
The Nordic countries adopt high-performance, low-permeance membrane systems in cold-climate applications and demonstrate among the highest per-capita consumption rates driven by comprehensive building envelope codes tied to condensation risk management and indoor air quality requirements in energy-efficient construction.
Across the European region, Energy Performance of Buildings Directive-driven renovation programs, passive house certification standards, and CE-marked low-VOC product requirements drive strong preference for advanced membranes over traditional heavy sheet goods, with accelerating growth in self-adhered and fluid-applied systems that enable complex architectural detailing and renovation applications.
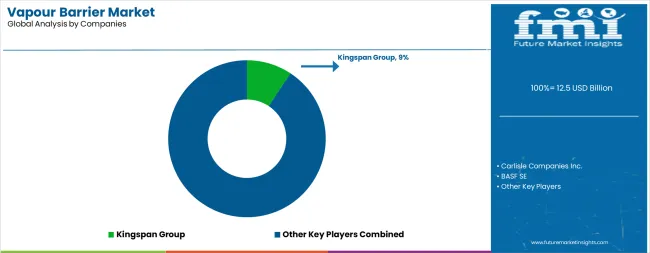
The market is characterized by competition among established building materials companies, specialized membrane manufacturers, and integrated building envelope system providers. Companies are investing in advanced polymer material research, variable-permeance technology development, installation system innovation, and comprehensive product portfolios to deliver consistent, high-performance, and climate-appropriate vapour barrier solutions. Innovation in smart membrane formulations, self-adhered application systems, and environmentally certified products is central to strengthening market position and competitive advantage.
Kingspan Group leads the market with a strong 9.5% market share, offering comprehensive building envelope solutions including vapour control membranes, insulation systems, and architectural panels with a focus on integrated high-performance construction assemblies.
The company's extensive technical support network and specification expertise support market leadership in commercial, industrial, and residential construction applications. Carlisle Companies Inc. provides specialized waterproofing and vapour barrier solutions through its CCW and other building envelope brands serving commercial roofing and below-grade applications.
BASF SE delivers advanced chemical solutions and functional polymers for vapour barrier formulations with focus on green material development. Soprema Group offers comprehensive waterproofing and building envelope systems including self-adhered membranes and fluid-applied barriers for diverse construction applications.
Owens Corning focuses on integrated insulation and moisture management solutions following its acquisition of Masonite International to strengthen building materials platform capabilities. W. R. Meadows Inc. specializes in concrete construction products including below-grade waterproofing and vapour barrier systems for foundation applications.
| Items | Values |
|---|---|
| Quantitative Units (2025) | USD 12.5 billion |
| Type | Membranes, Sheet, Fluid/Coatings, Peel & Stick, Films |
| Application | Insulation, Waterproofing (Below-grade/Above-grade), Air/Vapour Control Layers, Thermal Assemblies (Roofs/Walls), Acoustic/Sound |
| Material | Polymer-based (including Advanced Polymers), Asphalt & Bitumen, Polyethylene, Concrete/Brick & Mineral Sheets, Gypsum/Boards, Rubber/Elastomeric, Others (Glass, Sheet Metal, XPS, Hybrids) |
| Regions Covered | North America, Europe, East Asia, South Asia & Pacific, Latin America, Middle East & Africa |
| Countries Covered | United States, United Kingdom, Germany, France, China, India, South Korea, Italy, Spain, Canada, and 40+ countries |
| Key Companies Profiled | Kingspan Group, Carlisle Companies Inc., BASF SE, Soprema Group, Owens Corning, and W. R. Meadows Inc. |
| Additional Attributes | Dollar sales by type, application, and material category, regional demand trends, competitive landscape, technological advancements in membrane formulations, installation system innovation, variable-permeance development, and environmental certification programs |
The global vapour barrier market is estimated to be valued at USD 12.5 billion in 2025.
The market size for the vapour barrier market is projected to reach USD 20.0 billion by 2035.
The vapour barrier market is expected to grow at a 4.8% CAGR between 2025 and 2035.
The key product types in vapour barrier market are membranes, sheet, fluid/coatings, peel & stick and films.
In terms of application, insulation segment to command 40.0% share in the vapour barrier market in 2025.


Full Research Suite comprises of:
Market outlook & trends analysis
Interviews & case studies
Strategic recommendations
Vendor profiles & capabilities analysis
5-year forecasts
8 regions and 60+ country-level data splits
Market segment data splits
12 months of continuous data updates
DELIVERED AS:
PDF EXCEL ONLINE
Demand for Vapour Barrier in EU Size and Share Forecast Outlook 2025 to 2035
Vapour Recovery Units Market Size and Share Forecast Outlook 2025 to 2035
Vapour Blasting Equipment Market Growth - Trends & Forecast 2025 to 2035
Market Share Insights of Vapour Recovery Unit Providers
Explosive Vapour Detector Market Size and Share Forecast Outlook 2025 to 2035
Barrier Packaging Market Size and Share Forecast Outlook 2025 to 2035
Barrier Coated Papers Market Size and Share Forecast Outlook 2025 to 2035
Barrier Tube Packaging Market Size and Share Forecast Outlook 2025 to 2035
Barrier Resins Market Size and Share Forecast Outlook 2025 to 2035
Barrier Material Market Size and Share Forecast Outlook 2025 to 2035
Barrier Shrink Bags Market Analysis - Size, Share, and Forecast 2025 to 2035
Barrier Coated Paper Industry Analysis in Europe - Demand, Growth & Future Outlook 2025 to 2035
Key Players & Market Share in the Barrier Coated Paper Industry
Market Share Insights for Barrier Shrink Bag Providers
Barrier Coatings for Packaging Market Trends - Growth & Forecast 2025 to 2035
Competitive Landscape of Barrier Packaging Providers
Barrier Film Market Trends & Industry Growth Forecast 2025 to 2035
Europe Barrier Packaging Market Growth – Demand & Forecast 2024-2034
Barrier System Market Size, Share, Trends & Forecast 2024-2034
Korea Barrier Coated Paper Market Growth – Trends & Forecast 2023-2033

Thank you!
You will receive an email from our Business Development Manager. Please be sure to check your SPAM/JUNK folder too.
Chat With
MaRIA