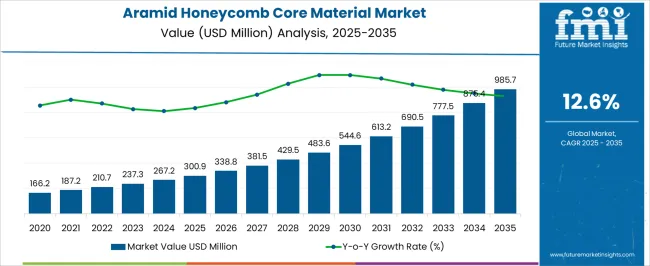
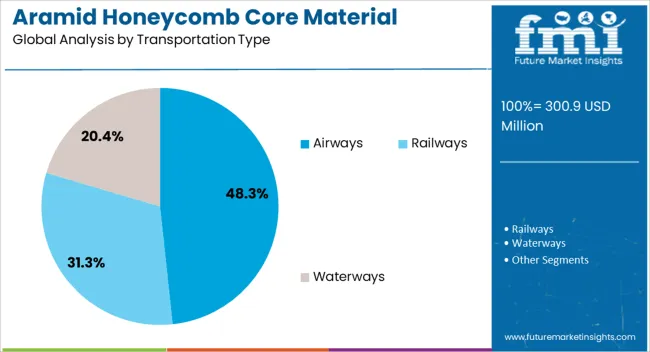
The global aramid honeycomb core material (AHCM) market size is assessed to stand at USD 267.2 million in 2024. By 2034, the market is expected to reach USD 845 million. The market is expected to register an impressive CAGR of 12.60% through 2034.
Attributes | Details |
---|---|
Aramid Honeycomb Core Material Market Size (2024) | USD 267.2 million |
Forecasted Market Size (2034) | USD 845 million |
Projected CAGR (2024 to 2034) | 12.60% |
The United States and the United Kingdom are expected to reach heights in their respective regions. Top companies known for their market presence, innovation, and strategic initiatives are stirring growth in these regions.
Within Asia Pacific, Japan, China, and South Korea are projected to robustly lift the regional market’s position. Specific factors like regulatory shifts, changing consumption patterns, and the use of leading aramid technology are complementing market growth.
Countries | Forecasted CAGR (2024 to 2034) |
---|---|
United States | 12.70% |
United Kingdom | 13.90% |
China | 13.30% |
Japan | 13.80% |
South Korea | 15.10% |
The United States is anticipated to grow at a CAGR of 12.70% through 2034. The market in the United States is forecasted to surpass USD 156.7 million by 2034. Sales of aramid honeycomb core materials are likely to rise due to the following reasons:
The aramid honeycomb core material market in the United Kingdom is forecasted to accumulate USD 35.5 million, recording a CAGR of 13.9% through 2034. Given below are the top-most factors that support the regional market growth:
Manufacturers and suppliers of aramid honeycomb core material in China are projected to generate net sales of USD 141.7 million by 2034, thus giving tight competition to the United States market. The market is anticipated to expand at a CAGR of 13.3% through 2034. Key factors that propel market growth are:
The market in Japan is projected to amass net sales worth USD 91.5 million by 2034. Throughout the forecast period, the market is anticipated to expand at a CAGR of 13.8%. Behind this impressive growth, the following factors are expected to lead the market:
The South Korean aramid honeycomb core material market is projected to account for a revenue of USD 52.7 million by 2034. Throughout this period, the market is anticipated to register a staggering CAGR of 15.1%. The top growth-inducing factors are:
Attributes | Details |
---|---|
Top Type | Nomex |
CAGR (2024 to 2034) | 12.5% |
The nomex market segment is projected to register a CAGR of 12.5% through 2034. Key factors driving the segment’s growth are:
Attributes | Details |
---|---|
Top Application | Interior |
CAGR (2024 to 2034) | 12.3% |
The interior segment is projected to register an impressive CAGR of 12.3% through 2034. Given below are the top factors that are propelling the segment’s growth:
The market is driven by surging demand for high-performance and lightweight materials, which offers lucrative opportunities to key players who can adapt and innovate to meet these demands.
In line with this, players are investing in modern manufacturing techniques that allow for stronger, lighter, and more cost-efficient honeycomb cores.
Industry participants are expanding beyond traditional markets such as aerospace to capture industries like marine, automotive, and construction, where demand for aramid honeycomb core material is consistently rising. Players are entering emerging markets with significant growth potential, especially in Asia Pacific, to increase their sales.
Key companies are building their reputation by highlighting the product’s unique advantages and showcasing successful applications to lure new customers. Market players are developing strong relationships with customers and assisting in technical support to attract new customers while maintaining the old ones.
Latest Developments in the Aramid Honeycomb Core Material Market
Table 1: Global Market Value (US$ Million) Forecast by Region, 2019 to 2034
Table 2: Global Market Volume (Tons) Forecast by Region, 2019 to 2034
Table 3: Global Market Value (US$ Million) Forecast by Type, 2019 to 2034
Table 4: Global Market Volume (Tons) Forecast by Type, 2019 to 2034
Table 5: Global Market Value (US$ Million) Forecast by Application, 2019 to 2034
Table 6: Global Market Volume (Tons) Forecast by Application, 2019 to 2034
Table 7: Global Market Value (US$ Million) Forecast by Transportation Type, 2019 to 2034
Table 8: Global Market Volume (Tons) Forecast by Transportation Type, 2019 to 2034
Table 9: North America Market Value (US$ Million) Forecast by Country, 2019 to 2034
Table 10: North America Market Volume (Tons) Forecast by Country, 2019 to 2034
Table 11: North America Market Value (US$ Million) Forecast by Type, 2019 to 2034
Table 12: North America Market Volume (Tons) Forecast by Type, 2019 to 2034
Table 13: North America Market Value (US$ Million) Forecast by Application, 2019 to 2034
Table 14: North America Market Volume (Tons) Forecast by Application, 2019 to 2034
Table 15: North America Market Value (US$ Million) Forecast by Transportation Type, 2019 to 2034
Table 16: North America Market Volume (Tons) Forecast by Transportation Type, 2019 to 2034
Table 17: Latin America Market Value (US$ Million) Forecast by Country, 2019 to 2034
Table 18: Latin America Market Volume (Tons) Forecast by Country, 2019 to 2034
Table 19: Latin America Market Value (US$ Million) Forecast by Type, 2019 to 2034
Table 20: Latin America Market Volume (Tons) Forecast by Type, 2019 to 2034
Table 21: Latin America Market Value (US$ Million) Forecast by Application, 2019 to 2034
Table 22: Latin America Market Volume (Tons) Forecast by Application, 2019 to 2034
Table 23: Latin America Market Value (US$ Million) Forecast by Transportation Type, 2019 to 2034
Table 24: Latin America Market Volume (Tons) Forecast by Transportation Type, 2019 to 2034
Table 25: Western Europe Market Value (US$ Million) Forecast by Country, 2019 to 2034
Table 26: Western Europe Market Volume (Tons) Forecast by Country, 2019 to 2034
Table 27: Western Europe Market Value (US$ Million) Forecast by Type, 2019 to 2034
Table 28: Western Europe Market Volume (Tons) Forecast by Type, 2019 to 2034
Table 29: Western Europe Market Value (US$ Million) Forecast by Application, 2019 to 2034
Table 30: Western Europe Market Volume (Tons) Forecast by Application, 2019 to 2034
Table 31: Western Europe Market Value (US$ Million) Forecast by Transportation Type, 2019 to 2034
Table 32: Western Europe Market Volume (Tons) Forecast by Transportation Type, 2019 to 2034
Table 33: Eastern Europe Market Value (US$ Million) Forecast by Country, 2019 to 2034
Table 34: Eastern Europe Market Volume (Tons) Forecast by Country, 2019 to 2034
Table 35: Eastern Europe Market Value (US$ Million) Forecast by Type, 2019 to 2034
Table 36: Eastern Europe Market Volume (Tons) Forecast by Type, 2019 to 2034
Table 37: Eastern Europe Market Value (US$ Million) Forecast by Application, 2019 to 2034
Table 38: Eastern Europe Market Volume (Tons) Forecast by Application, 2019 to 2034
Table 39: Eastern Europe Market Value (US$ Million) Forecast by Transportation Type, 2019 to 2034
Table 40: Eastern Europe Market Volume (Tons) Forecast by Transportation Type, 2019 to 2034
Table 41: South Asia and Pacific Market Value (US$ Million) Forecast by Country, 2019 to 2034
Table 42: South Asia and Pacific Market Volume (Tons) Forecast by Country, 2019 to 2034
Table 43: South Asia and Pacific Market Value (US$ Million) Forecast by Type, 2019 to 2034
Table 44: South Asia and Pacific Market Volume (Tons) Forecast by Type, 2019 to 2034
Table 45: South Asia and Pacific Market Value (US$ Million) Forecast by Application, 2019 to 2034
Table 46: South Asia and Pacific Market Volume (Tons) Forecast by Application, 2019 to 2034
Table 47: South Asia and Pacific Market Value (US$ Million) Forecast by Transportation Type, 2019 to 2034
Table 48: South Asia and Pacific Market Volume (Tons) Forecast by Transportation Type, 2019 to 2034
Table 49: East Asia Market Value (US$ Million) Forecast by Country, 2019 to 2034
Table 50: East Asia Market Volume (Tons) Forecast by Country, 2019 to 2034
Table 51: East Asia Market Value (US$ Million) Forecast by Type, 2019 to 2034
Table 52: East Asia Market Volume (Tons) Forecast by Type, 2019 to 2034
Table 53: East Asia Market Value (US$ Million) Forecast by Application, 2019 to 2034
Table 54: East Asia Market Volume (Tons) Forecast by Application, 2019 to 2034
Table 55: East Asia Market Value (US$ Million) Forecast by Transportation Type, 2019 to 2034
Table 56: East Asia Market Volume (Tons) Forecast by Transportation Type, 2019 to 2034
Table 57: Middle East and Africa Market Value (US$ Million) Forecast by Country, 2019 to 2034
Table 58: Middle East and Africa Market Volume (Tons) Forecast by Country, 2019 to 2034
Table 59: Middle East and Africa Market Value (US$ Million) Forecast by Type, 2019 to 2034
Table 60: Middle East and Africa Market Volume (Tons) Forecast by Type, 2019 to 2034
Table 61: Middle East and Africa Market Value (US$ Million) Forecast by Application, 2019 to 2034
Table 62: Middle East and Africa Market Volume (Tons) Forecast by Application, 2019 to 2034
Table 63: Middle East and Africa Market Value (US$ Million) Forecast by Transportation Type, 2019 to 2034
Table 64: Middle East and Africa Market Volume (Tons) Forecast by Transportation Type, 2019 to 2034
Figure 1: Global Market Value (US$ Million) by Type, 2024 to 2034
Figure 2: Global Market Value (US$ Million) by Application, 2024 to 2034
Figure 3: Global Market Value (US$ Million) by Transportation Type, 2024 to 2034
Figure 4: Global Market Value (US$ Million) by Region, 2024 to 2034
Figure 5: Global Market Value (US$ Million) Analysis by Region, 2019 to 2034
Figure 6: Global Market Volume (Tons) Analysis by Region, 2019 to 2034
Figure 7: Global Market Value Share (%) and BPS Analysis by Region, 2024 to 2034
Figure 8: Global Market Y-o-Y Growth (%) Projections by Region, 2024 to 2034
Figure 9: Global Market Value (US$ Million) Analysis by Type, 2019 to 2034
Figure 10: Global Market Volume (Tons) Analysis by Type, 2019 to 2034
Figure 11: Global Market Value Share (%) and BPS Analysis by Type, 2024 to 2034
Figure 12: Global Market Y-o-Y Growth (%) Projections by Type, 2024 to 2034
Figure 13: Global Market Value (US$ Million) Analysis by Application, 2019 to 2034
Figure 14: Global Market Volume (Tons) Analysis by Application, 2019 to 2034
Figure 15: Global Market Value Share (%) and BPS Analysis by Application, 2024 to 2034
Figure 16: Global Market Y-o-Y Growth (%) Projections by Application, 2024 to 2034
Figure 17: Global Market Value (US$ Million) Analysis by Transportation Type, 2019 to 2034
Figure 18: Global Market Volume (Tons) Analysis by Transportation Type, 2019 to 2034
Figure 19: Global Market Value Share (%) and BPS Analysis by Transportation Type, 2024 to 2034
Figure 20: Global Market Y-o-Y Growth (%) Projections by Transportation Type, 2024 to 2034
Figure 21: Global Market Attractiveness by Type, 2024 to 2034
Figure 22: Global Market Attractiveness by Application, 2024 to 2034
Figure 23: Global Market Attractiveness by Transportation Type, 2024 to 2034
Figure 24: Global Market Attractiveness by Region, 2024 to 2034
Figure 25: North America Market Value (US$ Million) by Type, 2024 to 2034
Figure 26: North America Market Value (US$ Million) by Application, 2024 to 2034
Figure 27: North America Market Value (US$ Million) by Transportation Type, 2024 to 2034
Figure 28: North America Market Value (US$ Million) by Country, 2024 to 2034
Figure 29: North America Market Value (US$ Million) Analysis by Country, 2019 to 2034
Figure 30: North America Market Volume (Tons) Analysis by Country, 2019 to 2034
Figure 31: North America Market Value Share (%) and BPS Analysis by Country, 2024 to 2034
Figure 32: North America Market Y-o-Y Growth (%) Projections by Country, 2024 to 2034
Figure 33: North America Market Value (US$ Million) Analysis by Type, 2019 to 2034
Figure 34: North America Market Volume (Tons) Analysis by Type, 2019 to 2034
Figure 35: North America Market Value Share (%) and BPS Analysis by Type, 2024 to 2034
Figure 36: North America Market Y-o-Y Growth (%) Projections by Type, 2024 to 2034
Figure 37: North America Market Value (US$ Million) Analysis by Application, 2019 to 2034
Figure 38: North America Market Volume (Tons) Analysis by Application, 2019 to 2034
Figure 39: North America Market Value Share (%) and BPS Analysis by Application, 2024 to 2034
Figure 40: North America Market Y-o-Y Growth (%) Projections by Application, 2024 to 2034
Figure 41: North America Market Value (US$ Million) Analysis by Transportation Type, 2019 to 2034
Figure 42: North America Market Volume (Tons) Analysis by Transportation Type, 2019 to 2034
Figure 43: North America Market Value Share (%) and BPS Analysis by Transportation Type, 2024 to 2034
Figure 44: North America Market Y-o-Y Growth (%) Projections by Transportation Type, 2024 to 2034
Figure 45: North America Market Attractiveness by Type, 2024 to 2034
Figure 46: North America Market Attractiveness by Application, 2024 to 2034
Figure 47: North America Market Attractiveness by Transportation Type, 2024 to 2034
Figure 48: North America Market Attractiveness by Country, 2024 to 2034
Figure 49: Latin America Market Value (US$ Million) by Type, 2024 to 2034
Figure 50: Latin America Market Value (US$ Million) by Application, 2024 to 2034
Figure 51: Latin America Market Value (US$ Million) by Transportation Type, 2024 to 2034
Figure 52: Latin America Market Value (US$ Million) by Country, 2024 to 2034
Figure 53: Latin America Market Value (US$ Million) Analysis by Country, 2019 to 2034
Figure 54: Latin America Market Volume (Tons) Analysis by Country, 2019 to 2034
Figure 55: Latin America Market Value Share (%) and BPS Analysis by Country, 2024 to 2034
Figure 56: Latin America Market Y-o-Y Growth (%) Projections by Country, 2024 to 2034
Figure 57: Latin America Market Value (US$ Million) Analysis by Type, 2019 to 2034
Figure 58: Latin America Market Volume (Tons) Analysis by Type, 2019 to 2034
Figure 59: Latin America Market Value Share (%) and BPS Analysis by Type, 2024 to 2034
Figure 60: Latin America Market Y-o-Y Growth (%) Projections by Type, 2024 to 2034
Figure 61: Latin America Market Value (US$ Million) Analysis by Application, 2019 to 2034
Figure 62: Latin America Market Volume (Tons) Analysis by Application, 2019 to 2034
Figure 63: Latin America Market Value Share (%) and BPS Analysis by Application, 2024 to 2034
Figure 64: Latin America Market Y-o-Y Growth (%) Projections by Application, 2024 to 2034
Figure 65: Latin America Market Value (US$ Million) Analysis by Transportation Type, 2019 to 2034
Figure 66: Latin America Market Volume (Tons) Analysis by Transportation Type, 2019 to 2034
Figure 67: Latin America Market Value Share (%) and BPS Analysis by Transportation Type, 2024 to 2034
Figure 68: Latin America Market Y-o-Y Growth (%) Projections by Transportation Type, 2024 to 2034
Figure 69: Latin America Market Attractiveness by Type, 2024 to 2034
Figure 70: Latin America Market Attractiveness by Application, 2024 to 2034
Figure 71: Latin America Market Attractiveness by Transportation Type, 2024 to 2034
Figure 72: Latin America Market Attractiveness by Country, 2024 to 2034
Figure 73: Western Europe Market Value (US$ Million) by Type, 2024 to 2034
Figure 74: Western Europe Market Value (US$ Million) by Application, 2024 to 2034
Figure 75: Western Europe Market Value (US$ Million) by Transportation Type, 2024 to 2034
Figure 76: Western Europe Market Value (US$ Million) by Country, 2024 to 2034
Figure 77: Western Europe Market Value (US$ Million) Analysis by Country, 2019 to 2034
Figure 78: Western Europe Market Volume (Tons) Analysis by Country, 2019 to 2034
Figure 79: Western Europe Market Value Share (%) and BPS Analysis by Country, 2024 to 2034
Figure 80: Western Europe Market Y-o-Y Growth (%) Projections by Country, 2024 to 2034
Figure 81: Western Europe Market Value (US$ Million) Analysis by Type, 2019 to 2034
Figure 82: Western Europe Market Volume (Tons) Analysis by Type, 2019 to 2034
Figure 83: Western Europe Market Value Share (%) and BPS Analysis by Type, 2024 to 2034
Figure 84: Western Europe Market Y-o-Y Growth (%) Projections by Type, 2024 to 2034
Figure 85: Western Europe Market Value (US$ Million) Analysis by Application, 2019 to 2034
Figure 86: Western Europe Market Volume (Tons) Analysis by Application, 2019 to 2034
Figure 87: Western Europe Market Value Share (%) and BPS Analysis by Application, 2024 to 2034
Figure 88: Western Europe Market Y-o-Y Growth (%) Projections by Application, 2024 to 2034
Figure 89: Western Europe Market Value (US$ Million) Analysis by Transportation Type, 2019 to 2034
Figure 90: Western Europe Market Volume (Tons) Analysis by Transportation Type, 2019 to 2034
Figure 91: Western Europe Market Value Share (%) and BPS Analysis by Transportation Type, 2024 to 2034
Figure 92: Western Europe Market Y-o-Y Growth (%) Projections by Transportation Type, 2024 to 2034
Figure 93: Western Europe Market Attractiveness by Type, 2024 to 2034
Figure 94: Western Europe Market Attractiveness by Application, 2024 to 2034
Figure 95: Western Europe Market Attractiveness by Transportation Type, 2024 to 2034
Figure 96: Western Europe Market Attractiveness by Country, 2024 to 2034
Figure 97: Eastern Europe Market Value (US$ Million) by Type, 2024 to 2034
Figure 98: Eastern Europe Market Value (US$ Million) by Application, 2024 to 2034
Figure 99: Eastern Europe Market Value (US$ Million) by Transportation Type, 2024 to 2034
Figure 100: Eastern Europe Market Value (US$ Million) by Country, 2024 to 2034
Figure 101: Eastern Europe Market Value (US$ Million) Analysis by Country, 2019 to 2034
Figure 102: Eastern Europe Market Volume (Tons) Analysis by Country, 2019 to 2034
Figure 103: Eastern Europe Market Value Share (%) and BPS Analysis by Country, 2024 to 2034
Figure 104: Eastern Europe Market Y-o-Y Growth (%) Projections by Country, 2024 to 2034
Figure 105: Eastern Europe Market Value (US$ Million) Analysis by Type, 2019 to 2034
Figure 106: Eastern Europe Market Volume (Tons) Analysis by Type, 2019 to 2034
Figure 107: Eastern Europe Market Value Share (%) and BPS Analysis by Type, 2024 to 2034
Figure 108: Eastern Europe Market Y-o-Y Growth (%) Projections by Type, 2024 to 2034
Figure 109: Eastern Europe Market Value (US$ Million) Analysis by Application, 2019 to 2034
Figure 110: Eastern Europe Market Volume (Tons) Analysis by Application, 2019 to 2034
Figure 111: Eastern Europe Market Value Share (%) and BPS Analysis by Application, 2024 to 2034
Figure 112: Eastern Europe Market Y-o-Y Growth (%) Projections by Application, 2024 to 2034
Figure 113: Eastern Europe Market Value (US$ Million) Analysis by Transportation Type, 2019 to 2034
Figure 114: Eastern Europe Market Volume (Tons) Analysis by Transportation Type, 2019 to 2034
Figure 115: Eastern Europe Market Value Share (%) and BPS Analysis by Transportation Type, 2024 to 2034
Figure 116: Eastern Europe Market Y-o-Y Growth (%) Projections by Transportation Type, 2024 to 2034
Figure 117: Eastern Europe Market Attractiveness by Type, 2024 to 2034
Figure 118: Eastern Europe Market Attractiveness by Application, 2024 to 2034
Figure 119: Eastern Europe Market Attractiveness by Transportation Type, 2024 to 2034
Figure 120: Eastern Europe Market Attractiveness by Country, 2024 to 2034
Figure 121: South Asia and Pacific Market Value (US$ Million) by Type, 2024 to 2034
Figure 122: South Asia and Pacific Market Value (US$ Million) by Application, 2024 to 2034
Figure 123: South Asia and Pacific Market Value (US$ Million) by Transportation Type, 2024 to 2034
Figure 124: South Asia and Pacific Market Value (US$ Million) by Country, 2024 to 2034
Figure 125: South Asia and Pacific Market Value (US$ Million) Analysis by Country, 2019 to 2034
Figure 126: South Asia and Pacific Market Volume (Tons) Analysis by Country, 2019 to 2034
Figure 127: South Asia and Pacific Market Value Share (%) and BPS Analysis by Country, 2024 to 2034
Figure 128: South Asia and Pacific Market Y-o-Y Growth (%) Projections by Country, 2024 to 2034
Figure 129: South Asia and Pacific Market Value (US$ Million) Analysis by Type, 2019 to 2034
Figure 130: South Asia and Pacific Market Volume (Tons) Analysis by Type, 2019 to 2034
Figure 131: South Asia and Pacific Market Value Share (%) and BPS Analysis by Type, 2024 to 2034
Figure 132: South Asia and Pacific Market Y-o-Y Growth (%) Projections by Type, 2024 to 2034
Figure 133: South Asia and Pacific Market Value (US$ Million) Analysis by Application, 2019 to 2034
Figure 134: South Asia and Pacific Market Volume (Tons) Analysis by Application, 2019 to 2034
Figure 135: South Asia and Pacific Market Value Share (%) and BPS Analysis by Application, 2024 to 2034
Figure 136: South Asia and Pacific Market Y-o-Y Growth (%) Projections by Application, 2024 to 2034
Figure 137: South Asia and Pacific Market Value (US$ Million) Analysis by Transportation Type, 2019 to 2034
Figure 138: South Asia and Pacific Market Volume (Tons) Analysis by Transportation Type, 2019 to 2034
Figure 139: South Asia and Pacific Market Value Share (%) and BPS Analysis by Transportation Type, 2024 to 2034
Figure 140: South Asia and Pacific Market Y-o-Y Growth (%) Projections by Transportation Type, 2024 to 2034
Figure 141: South Asia and Pacific Market Attractiveness by Type, 2024 to 2034
Figure 142: South Asia and Pacific Market Attractiveness by Application, 2024 to 2034
Figure 143: South Asia and Pacific Market Attractiveness by Transportation Type, 2024 to 2034
Figure 144: South Asia and Pacific Market Attractiveness by Country, 2024 to 2034
Figure 145: East Asia Market Value (US$ Million) by Type, 2024 to 2034
Figure 146: East Asia Market Value (US$ Million) by Application, 2024 to 2034
Figure 147: East Asia Market Value (US$ Million) by Transportation Type, 2024 to 2034
Figure 148: East Asia Market Value (US$ Million) by Country, 2024 to 2034
Figure 149: East Asia Market Value (US$ Million) Analysis by Country, 2019 to 2034
Figure 150: East Asia Market Volume (Tons) Analysis by Country, 2019 to 2034
Figure 151: East Asia Market Value Share (%) and BPS Analysis by Country, 2024 to 2034
Figure 152: East Asia Market Y-o-Y Growth (%) Projections by Country, 2024 to 2034
Figure 153: East Asia Market Value (US$ Million) Analysis by Type, 2019 to 2034
Figure 154: East Asia Market Volume (Tons) Analysis by Type, 2019 to 2034
Figure 155: East Asia Market Value Share (%) and BPS Analysis by Type, 2024 to 2034
Figure 156: East Asia Market Y-o-Y Growth (%) Projections by Type, 2024 to 2034
Figure 157: East Asia Market Value (US$ Million) Analysis by Application, 2019 to 2034
Figure 158: East Asia Market Volume (Tons) Analysis by Application, 2019 to 2034
Figure 159: East Asia Market Value Share (%) and BPS Analysis by Application, 2024 to 2034
Figure 160: East Asia Market Y-o-Y Growth (%) Projections by Application, 2024 to 2034
Figure 161: East Asia Market Value (US$ Million) Analysis by Transportation Type, 2019 to 2034
Figure 162: East Asia Market Volume (Tons) Analysis by Transportation Type, 2019 to 2034
Figure 163: East Asia Market Value Share (%) and BPS Analysis by Transportation Type, 2024 to 2034
Figure 164: East Asia Market Y-o-Y Growth (%) Projections by Transportation Type, 2024 to 2034
Figure 165: East Asia Market Attractiveness by Type, 2024 to 2034
Figure 166: East Asia Market Attractiveness by Application, 2024 to 2034
Figure 167: East Asia Market Attractiveness by Transportation Type, 2024 to 2034
Figure 168: East Asia Market Attractiveness by Country, 2024 to 2034
Figure 169: Middle East and Africa Market Value (US$ Million) by Type, 2024 to 2034
Figure 170: Middle East and Africa Market Value (US$ Million) by Application, 2024 to 2034
Figure 171: Middle East and Africa Market Value (US$ Million) by Transportation Type, 2024 to 2034
Figure 172: Middle East and Africa Market Value (US$ Million) by Country, 2024 to 2034
Figure 173: Middle East and Africa Market Value (US$ Million) Analysis by Country, 2019 to 2034
Figure 174: Middle East and Africa Market Volume (Tons) Analysis by Country, 2019 to 2034
Figure 175: Middle East and Africa Market Value Share (%) and BPS Analysis by Country, 2024 to 2034
Figure 176: Middle East and Africa Market Y-o-Y Growth (%) Projections by Country, 2024 to 2034
Figure 177: Middle East and Africa Market Value (US$ Million) Analysis by Type, 2019 to 2034
Figure 178: Middle East and Africa Market Volume (Tons) Analysis by Type, 2019 to 2034
Figure 179: Middle East and Africa Market Value Share (%) and BPS Analysis by Type, 2024 to 2034
Figure 180: Middle East and Africa Market Y-o-Y Growth (%) Projections by Type, 2024 to 2034
Figure 181: Middle East and Africa Market Value (US$ Million) Analysis by Application, 2019 to 2034
Figure 182: Middle East and Africa Market Volume (Tons) Analysis by Application, 2019 to 2034
Figure 183: Middle East and Africa Market Value Share (%) and BPS Analysis by Application, 2024 to 2034
Figure 184: Middle East and Africa Market Y-o-Y Growth (%) Projections by Application, 2024 to 2034
Figure 185: Middle East and Africa Market Value (US$ Million) Analysis by Transportation Type, 2019 to 2034
Figure 186: Middle East and Africa Market Volume (Tons) Analysis by Transportation Type, 2019 to 2034
Figure 187: Middle East and Africa Market Value Share (%) and BPS Analysis by Transportation Type, 2024 to 2034
Figure 188: Middle East and Africa Market Y-o-Y Growth (%) Projections by Transportation Type, 2024 to 2034
Figure 189: Middle East and Africa Market Attractiveness by Type, 2024 to 2034
Figure 190: Middle East and Africa Market Attractiveness by Application, 2024 to 2034
Figure 191: Middle East and Africa Market Attractiveness by Transportation Type, 2024 to 2034
Figure 192: Middle East and Africa Market Attractiveness by Country, 2024 to 2034
The aramid honeycomb core material market is estimated to be valued at USD 267.2 million in 2024.
The aramid honeycomb core material market size is forecasted to surpass USD 845 million by 2034.
The aramid honeycomb core material industry is projected to register a CAGR of 12.6% through 2034.
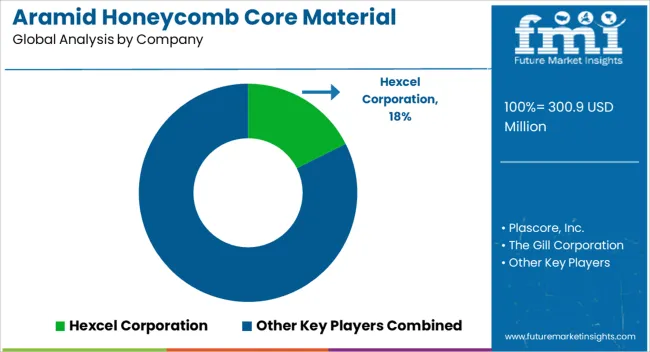
Hexcel Corporation, Plascore, Inc., and The Gill Corporation are some of the aramid honeycomb core material industry leaders.
The Asia Pacific is expected to make a significant contribution to the overall market growth.
Explore Similar Insights
Thank you!
You will receive an email from our Business Development Manager. Please be sure to check your SPAM/JUNK folder too.