The Document Imaging Market is estimated to be valued at USD 169.1 billion in 2025 and is projected to reach USD 534.6 billion by 2035, registering a compound annual growth rate (CAGR) of 12.2% over the forecast period.
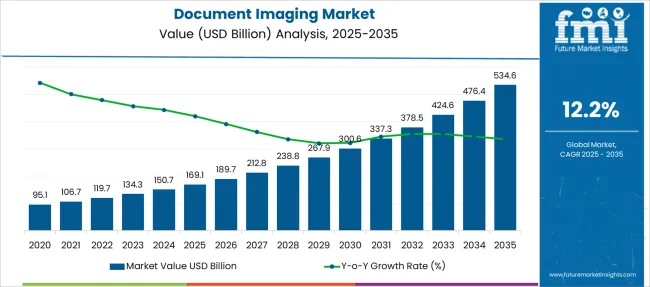
| Metric | Value |
|---|---|
| Document Imaging Market Estimated Value in (2025 E) | USD 169.1 billion |
| Document Imaging Market Forecast Value in (2035 F) | USD 534.6 billion |
| Forecast CAGR (2025 to 2035) | 12.2% |
The document imaging market is experiencing robust growth, propelled by the growing urgency to digitize physical records and streamline document-intensive workflows across multiple industries. The transition toward paperless operations has been accelerated by regulatory compliance requirements, audit readiness, and the need for operational transparency.
Advancements in optical character recognition, intelligent data capture, and AI-enabled indexing have allowed organizations to extract actionable insights from archived and incoming documents with greater accuracy and speed. The integration of document imaging solutions with enterprise resource planning and customer relationship management platforms has supported higher levels of automation in both back-office and front-office operations.
Furthermore, increasing data security concerns have compelled organizations to deploy secure document imaging architectures that allow granular access control and encrypted storage With the ongoing push toward sustainability and cost optimization, the future outlook for the document imaging market remains favorable, driven by continued innovation in software capabilities, expanding cloud adoption, and a growing emphasis on digital continuity and disaster recovery planning.
The market is segmented by Component, End-user, and Deployment and region. By Component, the market is divided into Software and Hardware. In terms of End-user, the market is classified into Government Organization, Law Firms, Physician Practices, Educational Institution, and Others. Based on Deployment, the market is segmented into On-premise and Cloud. Regionally, the market is classified into North America, Latin America, Western Europe, Eastern Europe, Balkan & Baltic Countries, Russia & Belarus, Central Asia, East Asia, South Asia & Pacific, and the Middle East & Africa.
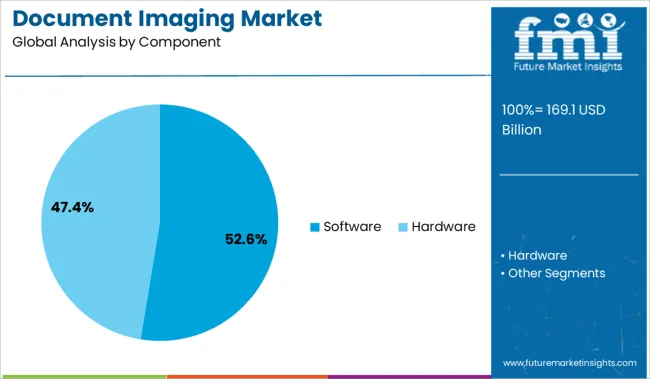
The software segment is expected to account for 52.6% of the document imaging market’s total revenue share in 2025, driven by the rising demand for intelligent data processing and automation across digital workflows. Growth in this segment is being supported by the increasing integration of imaging platforms with AI-powered classification, workflow automation, and metadata extraction functionalities.
As organizations seek to move beyond traditional scanning tools, software solutions are being adopted for their ability to manage unstructured content, route documents through configurable approval chains, and facilitate real-time collaboration. Enhanced compatibility with enterprise applications and cloud-native ecosystems has reinforced the shift toward software-centric imaging systems.
In addition, the ability to apply machine learning algorithms to improve image quality, reduce redundancy, and ensure compliance with data privacy standards has further advanced the adoption of these platforms The software’s scalability and modularity, paired with centralized policy enforcement and version control, have positioned it as the core driver of innovation in document digitization and archival management.
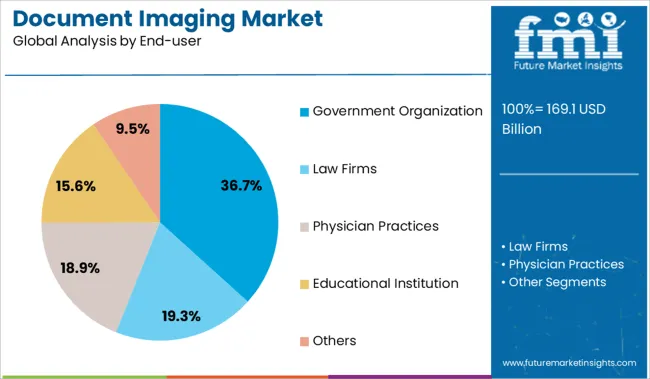
Government organizations are projected to contribute 36.7% to the total revenue of the document imaging market in 2025, reflecting their strong focus on modernization, public data accessibility, and administrative efficiency. This segment’s prominence is being influenced by national-level mandates promoting e-governance, transparency, and efficient service delivery through digitized document workflows.
Public agencies are increasingly investing in imaging solutions to convert legacy physical archives into searchable, retrievable digital formats that ensure faster decision-making and improved citizen services. The ability to streamline internal documentation, reduce physical storage requirements, and maintain secure digital records has made document imaging a critical enabler in government digital transformation initiatives.
The adoption of standardized document management frameworks and integration with public sector information systems has further supported this growth Enhanced audit preparedness, long-term digital preservation, and secure inter-departmental sharing capabilities have positioned document imaging as a foundational technology for modern governance.
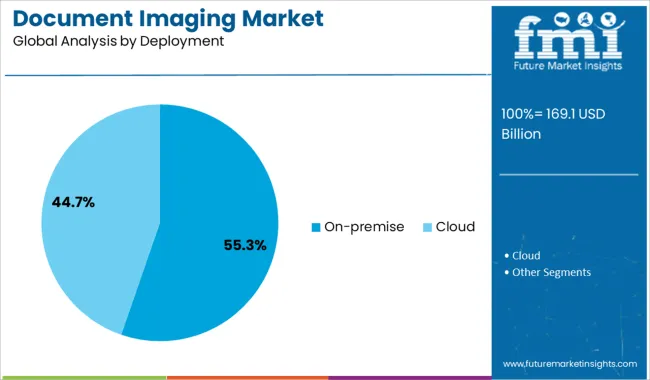
The on-premise segment is anticipated to capture 55.3% of the document imaging market revenue share in 2025, driven by the continued preference for full control over data storage, compliance, and system customization. This deployment model has remained dominant among highly regulated industries and public institutions where data residency, latency sensitivity, and internal policy adherence are critical.
Organizations have favored on-premise document imaging systems for their ability to integrate with legacy IT environments, ensure offline operational continuity, and enforce stricter access control protocols. The reduced risk of data leakage, along with the ability to manage security and system updates internally, has made on-premise solutions particularly attractive for sensitive document processing.
In addition, long-term cost efficiency through capital expenditure models and lower dependency on internet connectivity has reinforced adoption in locations with limited or unstable cloud infrastructure Customizable deployment, system isolation, and direct oversight of performance and uptime have solidified on-premise solutions as the deployment model of choice in document-intensive and compliance-focused environments.
| Market Statistics | Details |
|---|---|
| H1,2024 (A) | 15.0% |
| H1,2025 Projected (P) | 14.8% |
| H1,2025 Outlook (O) | 14.0% |
| BPS Change : H1,2025 (O) - H1,2025 (P) | (-) 80 ↓ |
| BPS Change : H1,2025 (O) - H1,2024 (A) | (-) 100 ↓ |
The rapid shift of various firm files and data from on-premise computers to cloud storage. Cloud services are critical for document management systems because they provide a platform that allows users to rapidly access their papers, conveniently make comments to differentiate one from another, and precisely categorize each file based on its contents. This eliminates the use of various document imaging hardware like printers, scanners, etc.
According to FMI analysis, the variation between the BPS values observed in the document imaging market in H1, 2025 - Outlook (O) over H1, 2025 Projected (P) reflects a decline of 80 units. The reason behind this is the increasing digitalization in document sharing and editing. The ability to access documents anytime, anywhere with the help of mobile phones is also a reason for the decline in sales of document imaging products. In addition, compared to H1, 2025 (O) over H1, 2024 Actual (A) also reflects a decline of 100 units.
The reason behind this is that there is a decline in the use of document imaging electronics in various government organizations and educational institutions. The government is also promoting the digitization of various documentation processes and discouraging the use of papers in various fields.
The global document imaging market is estimated to be valued at USD 48.7 Billion in 2014. The demand for document imaging is expected to rise at the rate of a CAGR of 11.5% during the period from 2014 to 2024. The growth in North America is supported by rising demand for digitalized documentation across industries, over the years. The document imaging hardware segment is set to register the highest market share 67.5% of the total global document imaging market share in 2025.
Document image processing system used to convert paper documents into bitmaps (digital images) by electronic transfer or scanning process. These digital copies can be organized by index values and indexed with metadata in the document management system. Scanning or printing software helps to start or edit, print, and scan data directly from the computer. Through this software, end users can select pages, color, length, format, and other requirements of that particular scan and print copies.
The demand for document imaging is expected to show significant growth in the coming years. This attributes to various factors such as increasing demand for automated workflow, rising adoption of cloud-based document imaging solutions, and going-green initiatives with paperless documents.
Document imaging solutions with an automated workflow deliver more efficient workflows and helps to reduce costly paper handling with intelligent document routing, which saves money. Therefore, the demand for automated workflow increases over the manual and it drives the demand for document imaging systems. Moreover, technology like Big Data analytics in document imaging is also driving the adoption of document imaging systems.
The document imaging system also saves hidden costs of a business workflow such as misfiling, labor costs, office and storage space, paper, and other operational expenses. Thus, such factors are expected to drive the growth of the document imaging market.
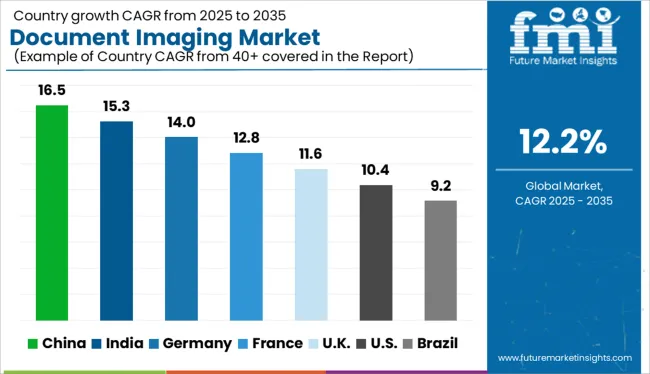
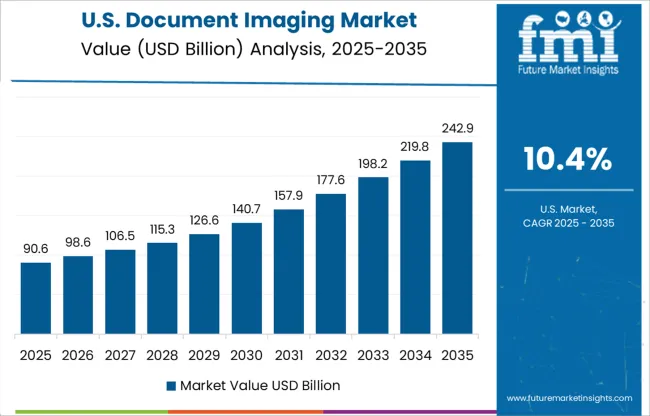
Currently, the USA market anticipates the largest consumption of document imaging systems in the North American region and is expected to grow at 9.5% CAGR from 2025 to 2035. The USA document imaging market is expected to reach 1.8X by 2035.
The USA market witnessed significant growth in the document imaging market, attributed to the presence of developed IT infrastructure and emerging large and small & medium-scale enterprises in the country.
Rising adoptions of digitalization in document management infrastructure across various industry verticals and technological advancements in document imaging software and hardware by key players in the country are set to drive the growth of the document imaging market in the USA.
China is set to register exponential growth in the Asian document imaging market with a CAGR of 14.1% from 2025 to 2035. China's market is anticipated to create an absolute dollar opportunity of USD 9,600 Million from 2025 to 2035.
For instance, the China-United Kingdom collaboration on International Forest Investment & Trade (InFIT) and the Chinese Academy of Forestry (CAF) developed their own timber legality standards and frameworks. Through this collaboration, CNFPIA announced timber legality requirements for transport and sales, document management, legality verification for imported and domestic timber, development of a timber legality management system, and trading & processing. Such development in the country helps to reduce manual courier-based and paper-driven documentation processes and it is set to fuel the demand for the document imaging market in China.
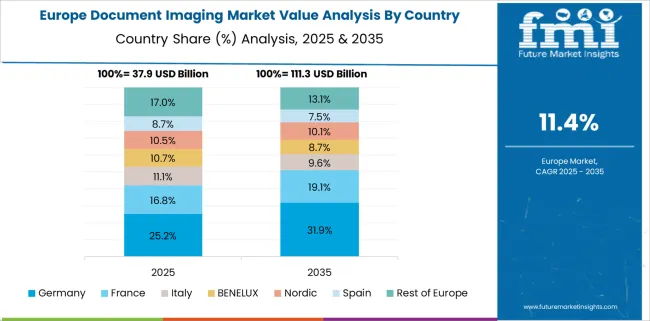
The German market is set to report the largest consumption of document imaging systems in the Europe region, and the market size is expected to reach 2.2X by 2035. The German market is anticipated to create an absolute dollar opportunity of USD 5,500 Million from 2025 to 2035.
The demand for document imaging solutions in Germany is driven by the presence of developed infrastructure for advanced technology such as Big Data, adoption of automation, and cloud-based document imaging solutions across the industry. Germany witnesses a large number of emerging start-ups such as Conatix, COI, Tutum, Padrino, Ninox, and others. Thus, the presence of emerging document management startups in Germany spurs the demand for the document imaging market.
Document imaging hardware segment by component will dominate the document imaging market and is expected to reach 1.5X by 2035. Moreover, the document imaging software segment is set to witness the highest growth rate of 13.5% CAGR from 2025 to 2035.
The demand for document imaging hardware is attributed to the rising adoption of scanners, printers, and microfilm readers by various end-users such as government, hospitals, and other industries, across the globe. Therefore, migration from manual to automated document workflow is contributing to the demand for document imaging hardware segment in recent years.
On the basis of deployment, the on-premise segment will be a dominating segment. The market size of the on-premise segment is expected to expand up to 2.0X by 2035. Moreover, the cloud segment is set to register the highest growth at the rate of CAGR of 13.8% from 2025 to 2035.
On-premise segment constitutes the highest market share in the global document imaging market. Document imaging solutions help to reduce costly paper handling with intelligent document routing, and save money and time for law firms, medical practitioners, educational institutions, and others. Moreover, the rising adoption of cloud-based document imaging solutions across the globe by many enterprises is supposed to drive the demand for document imaging solutions, during the forecasted period.
The market size of government organizations segment by end user is set to expand up to 2.2X by 2035. Moreover, the law firms segment is set to register the highest growth at the rate of CAGR 13.5% from 2025 to 2035.
Document imaging solutions help government organizations in various tasks such as automatic distribution, document routing, document printing, track printing, customized electronic forms, document barcoding, document control, and other features. Thus, many government organizations started using document imaging solutions to save the cost of paper-based document management. Also rising adoption of digitization in law firms across the globe is expected to drive the demand for document imaging solutions in the law firms segment in coming years.
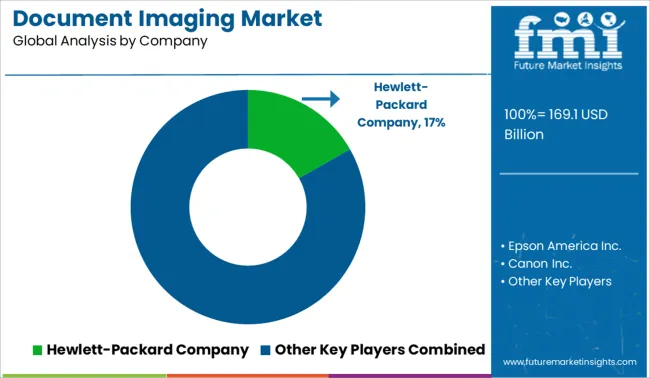
Many key document imaging system manufacturers are inclined at investing heavily in product innovations to uncover increased applications of document imaging. With the use of printing technology, vendors also try to accelerate their business transformation and growth objectives by increasing their partner base.
| Attribute | Details |
|---|---|
| Market value in 2024 | USD 104.1 Billion |
| Market CAGR 2014 to 2024 | 11.5% |
| Share of top 5 players | Around 25% |
| Forecast Period | 2025 to 2035 |
| Historical Data Available for | 2014 to 2024 |
| Market Analysis | USD Million for Value |
| Key regions covered | North America; Latin America; Western Europe; Eastern Europe; Asia Pacific Excluding Japan; Japan; Middle East and Africa |
| Key countries covered | USA, Canada, Germany, United Kingdom, France, Italy, Spain, Russia, China, Japan, South Korea, India, Thailand, Malaysia, Indonesia, Australia, New Zealand, GCC countries, Turkey, Northern Africa, and South Africa |
| Key market segments covered | Component, Deployment, End-user, Region |
| Key companies profiled | Hewlett-Packard Company; Epson; Canon Inc.; Fujitsu Ltd.; Toshiba Corporation; Newgen Software Technologies Limited; Adobe Systems Incorporated; Xerox Corporation; IBM Corporation; Eastman Kodak Company |
| Report Coverage | Market forecast, company share analysis, competition intelligence, Drivers, Restraints, Opportunities and Threats analysis, market dynamics and challenges, and strategic growth initiatives |
| Customization & pricing | Available upon request |
The global document imaging market is estimated to be valued at USD 169.1 billion in 2025.
The market size for the document imaging market is projected to reach USD 534.6 billion by 2035.
The document imaging market is expected to grow at a 12.2% CAGR between 2025 and 2035.
The key product types in document imaging market are software, hardware, _scanner, _printers, _microfilm readers and _others.
In terms of end-user, government organization segment to command 36.7% share in the document imaging market in 2025.


Full Research Suite comprises of:
Market outlook & trends analysis
Interviews & case studies
Strategic recommendations
Vendor profiles & capabilities analysis
5-year forecasts
8 regions and 60+ country-level data splits
Market segment data splits
12 months of continuous data updates
DELIVERED AS:
PDF EXCEL ONLINE
Gel Imaging Documentation Market Size and Share Forecast Outlook 2025 to 2035
Document Management Software Market Size and Share Forecast Outlook 2025 to 2035
Document Control Software Market Size and Share Forecast Outlook 2025 to 2035
Document Cleaning Powder Market Size and Share Forecast Outlook 2025 to 2035
Document Capture Software Market Size and Share Forecast Outlook 2025 to 2035
Document Outsourcing Service Market Analysis - Size, Share, and Forecast 2025 to 2035
AI Document Generator Market Size and Share Forecast Outlook 2025 to 2035
Global Clinical Documentation Improvement Market Insights – Trends & Forecast 2024-2034
Salesforce CRM Document Generation Software Market Size and Share Forecast Outlook 2025 to 2035
Imaging Markers Market Analysis - Size, Share, and Forecast Outlook 2025 to 2035
3D Imaging Surgical Solution Market Size and Share Forecast Outlook 2025 to 2035
PET Imaging Workflow Market Analysis - Size, Share, and Forecast Outlook 2025 to 2035
Brain Imaging and Neuroimaging Market Size and Share Forecast Outlook 2025 to 2035
Dental Imaging Equipment Market Forecast and Outlook 2025 to 2035
Remote Imaging Collaboration Market Analysis - Size, Share, and Forecast Outlook 2025 to 2035
Competitive Overview of Aerial Imaging Market Share
Aerial Imaging Market Growth - Trends & Forecast 2025 to 2035
Breast Imaging Market Analysis - Size, Share & Growth Forecast 2024 to 2034
Spinal Imaging Market Trends – Growth, Demand & Forecast 2022-2032
Hybrid Imaging System Market

Thank you!
You will receive an email from our Business Development Manager. Please be sure to check your SPAM/JUNK folder too.
Chat With
MaRIA