Salesforce CRM Document Generation Software Market
Market Insights on Salesforce CRM Document Generation Software covering sales outlook, demand forecast & up-to-date key trends
Salesforce CRM Document Generation Software Market by Type, Application & Region | Forecast 2022 to 2032
Salesforce CRM Document Generation Software Market Outlook (2022 to 2032)
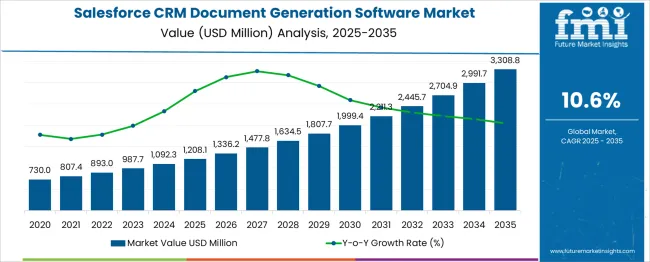
[336 Pages Report] The salesforce CRM document generation software market is likely to expand its roots in the global market at a promising CAGR of 10.6% between 2022 and 2032.
The market is valued at US$ 893 Million in 2022 and is likely to reach US$ 2.5 Billion by 2032. Previously, the market was thriving at a slightly higher CAGR of 11.9% (2015-2021), ensuring a market size of US$ 798 Million in 2021.
The paradigm shift from excels to CRM in order to enhance the customer experience along with rapid digitization and high internet penetration with high-frequency bandwidths are attributing to the growth of the salesforce CRM documentation generation software market.
Companies are adopting new-generation technology and experimenting with each component of their business, including sales, HR, business intelligence, and business operations. As these processes get more and more complex, businesses tend to find simpler ways to function within the limited workforce and budget. As a result, the demand for salesforce CRM document generation software is surging for documenting big chunks of data in a secure, reliable, and suitable manner.
Attributes |
Details |
Salesforce CRM document generation software Market CAGR (2022 to 2032) |
10.6% |
Salesforce CRM document generation software Market Value (2022) |
US$ 893 Million |
Salesforce CRM document generation software Market Value (2032) |
US$ 2.5 Billion |
Don't pay for what you don't need
Customize your report by selecting specific countries or regions and save 30%!
What is the COVID-19 Impact on the Salesforce CRM Document Generation Software Market?
Salesforce CRM document generation software analysis explains that Covid-19 has impacted multiple global markets by disturbing the supply chains because of the market restrictions and logistics bans introduced by governments around the world. However, a handful of markets benefitted from the pandemic’s impact.
The need for storing customer data as most of the transactions was online and needed to be documented in real-time. COVID-19 has tested the resilience of various markets, thereby shutting down manufacturing units and restricting logistic operations. Remote work has also increased the demand for enhanced customer experience.
The Salesforce CRM document generation software provides a platform for companies to document data related to customers and sales. It stores the data reliably and securely, enabling a business to go through it while creating new marketing campaigns. Shutting down business facilities has also increased sales inquiries, raising the demand for a smoother platform to store customer data.
What are the Key Dynamics Governing the Growth of the Salesforce CRM Document Generation Software Market?
Integration of new cutting-edge technology such as artificial intelligence, predictive learning, and machine learning with salesforce CRM document generation software helps the market in exploring new dynamics, enhancing the documentation experience of businesses.
As per the global study, the salesforce CRM document generation software market is driven by strong ROI (Rate of Interest), reduced costs, increased usage of web-based documents, and easy installation processes. Businesses trying to improve productivity and enhance operational efficiency are also adopting Salesforce CRM document generation software.
These platforms work as a one-stop shop for all your documentation needs, including creating, editing, and printing specific documents. The documents carry important information about the customers that need to be secured by the company. Various customer authorities set compliance attached to the data safety policies; the CRM document generation software comes with multi-layered security that is hard to breach.
Other factors driving the sales of salesforce CRM document generation software are the rapid shift from Excel to CRM-based document generation software, increasing demand for better customer experience, growing customization and competition, and involvement of government authorities.
Covid-19 has damaged multiple markets, enhancing the software CRM document generation software market to the need for easy and smooth documentation. A higher rate of interest after investing in CRM software fuels the sales of salesforce CRM document generation software, storing the data in cloud-based storage options.
Increasing digitization, artificial intelligence, and machine learning, and their integration with CRM platforms, are helping customers in transferring data with AI-based tools. This increases productivity and enhances the accuracy of various operations. Companies are constantly upgrading to new-age cloud computing.
Covid-19 has pushed businesses to adopt these components into their business strategy. CRM and document management systems, improving the operability of business spaces covering small and medium enterprises and large enterprises. Automated document generation and smoother storage options increase the demand for salesforce CRM document generation software platforms.
The high maintenance cost and incompetent workforce are declining the growth of the salesforce CRM document generation software market. Businesses need new talent acquisition management tools to train their workers for technological updates. Companies are also hesitating in investing big amounts for the shift from Excel to Salesforce CRM document generation software because of the budget cuts.
Find your sweet spots for generating winning opportunities in this market.
Talk to AnalystComparative View of Adjacent Salesforce CRM Document Generation Software Market
Salesforce CRM Document Generation Software Market:
Attributes |
Salesforce CRM Document Generation Software Market |
CAGR (2022 to 2032) |
8.1% |
Market Value (2026) |
US$ 1.33 Billion |
Growth Factor |
Rapid digitization and demand for a smoother storage option along with reliable, safe, and accurate storage options. |
Opportunity |
The market creates opportunities for developers and vendors to make their platform more flexible for the latest technologies like AI and ML |
Key Trends |
The use of salesforce CRM document generation software in SMEs and large organizations is owing to the high demand in the market |
Europe Salesforce CRM Document Generation Software Market:
Attributes |
Europe Salesforce CRM Document Generation Software Market |
CAGR (2022 to 2032) |
8.9% |
Market Value (2026) |
US$ 421 Million |
Growth Factor |
Companies adopting new modernized platforms in order to stand strong in the growing competition is fuelling the sales of |
Opportunity |
New corporates setting up in urban areas along with the innovative start-up programs run by the government are also increasing the market’s traction in Europe. |
Key Trends |
The latest trend in the market is the enhanced customer experience while experimenting with AI-based tools. New markets opening up are also shaping new trends in the market. |
CRM Software Market:
Attributes |
CRM Software Market |
CAGR (2022 to 2032) |
11.9% |
Market Value (2026) |
US$ 106.12 Billion |
Growth Factor |
The fast-paced transaction, better internet, and rapid digitization is pushing businesses to adopt CRM systems into practice. |
Opportunity |
The CRM software market creates opportunities for businesses as it helps in competing, adapting, and analyzing the data in real time, making data storage easier with cloud-based storage. |
Key Trends |
The latest trend in the market is the integration of AI and ML along with CRM software components that are making the technology more advanced and flexible. |
The market thrives on new IT trends like the integration of big data, cloud computing, artificial intelligence, and machine learning. These platforms, coupled with salesforce CRM document generation software, become one platform that manages and documents most operational activities.
From storing the data to document management, salesforce CRM document generation software covers everything. In recent years, higher internet penetration has enabled access to cloud storage. The use of cloud management systems, a component of CRM software, is also in trend and makes it easier to store data.
Which Segment is likely to Lead the Salesforce CRM Document Generation Software Market by Type?
By type, cloud-based is the largest segment and will hold the biggest portion of the market in the forecast period. The analysis shows that the cloud-based type is set to thrive at 10.5% in the forecast period. Previously, the same segment was proliferating at a CAGR of 11.7%.
The factors behind the growth of this segment are the high penetration of the internet, increasing digitization, and the integration of customer data management tools. Also, an enhanced large storage space that is reliable and secure, like cloud-based software, is also the reason for its growth.
Get the data you need at a Fraction of the cost
Personalize your report by choosing insights you need
and save 40%!
Which Segment is likely to Lead the Salesforce CRM Document Generation Software Market by Application?
By application, large enterprises are the biggest segment in the application category and will be the largest portion of the forecast period. It is growing at a CAGR of 10% between 2022 and 2032, which was previously recorded as 11.4% between 2015 and 2026.
The factors behind the growth of large enterprises are the complex management of data, integration of the latest technology, and huge capital investments to enhance the customer experience.
What is the Regional Analysis for the Salesforce CRM Document Generation Software Market?
The salesforce CRM document generation software market is divided into regions; North America, Latin America, Asia Pacific, Middle East and Africa (MEA), and Europe. The biggest market is the USA, thriving at a CAGR of 10.4% between 2022 and 2032.
The region is likely to hold a market revenue of US$ 874.3 Million by the end of 2032. Rapid digitization, increasing integration of the latest technology, expanding data loads, and new developments in CRM are fueling growth in this region.
Other regions like Asia Pacific are the highest growing region for the salesforce CRM document generation software market. Developing countries like China are booming at the second-highest CAGR of 10.1%, and Japan is growing at a CAGR of 9.7%. At the same time, their projected values are 170.8 Million and 146.9 Million, respectively. South Korea will hold US$ 87 Million by the end of 2032 as it thrives on a strong CAGR of 9% between 2022 to 2032.
Regions |
CAGR (2022 to 2032) |
United States |
10.4% |
United Kingdom |
9.6% |
China |
10.1% |
South Korea |
9.0% |
Japan |
9.7% |
- United States holds the biggest portion of the salesforce CRM document generation software market.
- The USA is the highest-growing market in the North American region making the region the highest-growing region.
- Covid-19 followed by remote work along with growing demand for enhanced customer experience is owing to the increased sales of salesforce CRM document generation software.
How is the Competition in the Salesforce CRM document generation software Market?
The competitive landscape of salesforce CRM document generation software is dynamic in nature and allows new competitors to thrive in the market and increase competitiveness.
The companies in the market are a part of mergers and collaborations that result in increased distribution channels and market spaces. These companies focus on upgrading the software, making it accessible to use, and increasing the segmentation more widely.
Recent Developments in the Salesforce CRM document generation software Market
- Conga has introduced its salesforce CRM document generation software with the new component document generation and document accuracy. This increases the demand for CRM software including CRM document generation software.
- Nintex has launched its automated document creation without code that includes any data, any document, and any delivery, simplifying processes and security of data storage. This fuels the demand for salesforce CRM document generation software.
Key Players
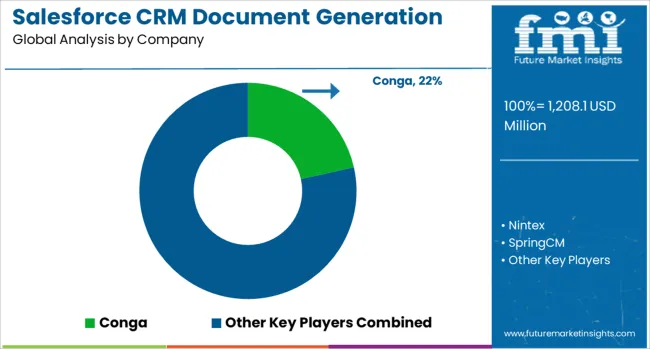
- Conga
- Nintex
- SpringCM
- DealHub
- WebMerge
Key Segments:
By Type:
- Cloud-Based
- On-Premises
By Application:
- Large Enterprises
- SMEs
By Region:
- North America
- Europe
- Middle East & Africa
- Asia Pacific
- Latin America
Frequently Asked Questions
What is the CAGR of the Salesforce CRM Document Generation Software Market?
The salesforce CRM document generation software market is set to grow at a CAGR of 10.6% through 2032.
Which is the Leading Region in the Salesforce CRM document generation software Market?
United States is the biggest region in Salesforce CRM document generation software market with a CAGR of 10.4% through 2032.
Which Segment leads in the Salesforce CRM Document Generation Software Market by Type?
Cloud Based is the leading segment in the salesforce CRM document generation software market by type, thriving at a CAGR of 10.5% through 2032.
What is the Growth Estimated for the Salesforce CRM Document Generation Software Market by 2032?
The salesforce CRM document generation software market is set to reach US$ 2.5 Billion by 2032.
Which Region has the Highest Growth Potential?
Asia pacific has the highest growth potential in the Salesforce CRM document generation software market, where China and Japan thrive at CAGR of 10.1% and 9.7% through 2032.
Table of Content
1. Executive Summary | Salesforce CRM Document Generation Software Market 1.1. Global Market Outlook 1.2. Summary of Statistics 1.3. Key Market Characteristics & Attributes 1.4. Analysis and Recommendations 2. Market Overview 2.1. Market Coverage / Taxonomy 2.2. Market Definition / Scope / Limitations 3. Market Risks and Trends Assessment 3.1. Risk Assessment 3.1.1. COVID-19 Crisis and Impact on Demand 3.1.2. COVID-19 Impact Benchmark with Previous Crisis 3.1.3. Impact on Market Value (US$ Million) 3.1.4. Assessment by Key Countries 3.1.5. Assessment by Key Market Segments 3.1.6. Action Points and Recommendation for Suppliers 3.2. Key Trends Impacting the Market 3.3. Formulation and Product Development Trends 4. Market Background and Foundation Data Points 4.1. Global Market (US$ Million) 4.2. Market Opportunity Assessment (US$ Million) 4.2.1. Total Available Market 4.2.2. Serviceable Addressable Market 4.2.3. Serviceable Obtainable Market 4.3. Market Scenario Forecast 4.3.1. Demand in Optimistic Scenario 4.3.2. Demand in Likely Scenario 4.3.3. Demand in Conservative Scenario 4.4. Investment Feasibility Analysis 4.4.1. Investment in Established Markets 4.4.1.1. In Short Term 4.4.1.2. In Long Term 4.4.2. Investment in Emerging Markets 4.4.2.1. In Short Term 4.4.2.2. In Long Term 4.5. Forecast Factors - Relevance & Impact 4.5.1. Top Companies Historical Growth 4.5.2. Global Market Growth 4.5.3. Adoption Rate, By Country 4.6. Market Dynamics 4.6.1. Market Driving Factors and Impact Assessment 4.6.2. Prominent Market Challenges and Impact Assessment 4.6.3. Market Opportunities 4.6.4. Prominent Trends in the Global Market & Their Impact Assessment 5. Key Success Factors 5.1. Manufacturers’ Focus on Low Penetration High Growth Markets 5.2. Banking on with Segments High Incremental Opportunity 5.3. Peer Benchmarking 6. Global Market Demand Analysis 2015 to 2021 and Forecast, 2022 to 2032 6.1. Historical Market Analysis, 2015 to 2021 6.2. Current and Future Market Projections, 2022 to 2032 6.3. Y-o-Y Growth Trend Analysis 7. Global Market Value Analysis 2015 to 2021 and Forecast, 2022 to 2032 7.1. Historical Market Value (US$ Million) Analysis, 2015 to 2021 7.2. Current and Future Market Value (US$ Million) Projections, 2022 to 2032 7.2.1. Y-o-Y Growth Trend Analysis 7.2.2. Absolute $ Opportunity Analysis 8. Global Market Analysis 2015 to 2021 and Forecast 2022 to 2032, By Type 8.1. Introduction / Key Findings 8.2. Historical Market Size (US$ Million) Analysis By Type, 2015 to 2021 8.3. Current and Future Market Size (US$ Million) Analysis and Forecast By Type, 2022 to 2032 8.3.1. Cloud Based 8.3.2. On-Premises 8.4. Market Attractiveness Analysis By Type 9. Global Market Analysis 2015 to 2021 and Forecast 2022 to 2032, By Application 9.1. Introduction / Key Findings 9.2. Historical Market Size (US$ Million) Analysis By Application, 2015 to 2021 9.3. Current and Future Market Size (US$ Million) Analysis and Forecast By Application, 2022 to 2032 9.3.1. Large Enterprises 9.3.2. SMEs 9.4. Market Attractiveness Analysis By Application 10. Global Market Analysis 2015 to 2021 and Forecast 2022 to 2032, By Region 10.1. Introduction 10.2. Historical Market Size (US$ Million) Analysis By Region, 2015 to 2021 10.3. Current Market Size (US$ Million) & Analysis and Forecast By Region, 2022 to 2032 10.3.1. North America 10.3.2. Latin America 10.3.3. Europe 10.3.4. Asia Pacific 10.3.5. Middle East and Africa (MEA) 10.4. Market Attractiveness Analysis By Region 11. North America Market Analysis 2015 to 2021 and Forecast 2022 to 2032 11.1. Introduction 11.2. Pricing Analysis 11.3. Historical Market Value (US$ Million) Trend Analysis By Market Taxonomy, 2015 to 2021 11.4. Market Value (US$ Million) & Forecast By Market Taxonomy, 2022 to 2032 11.4.1. By Country 11.4.1.1. United States of America 11.4.1.2. Canada 11.4.1.3. Rest of North America 11.4.2. By Type 11.4.3. By Application 11.5. Market Attractiveness Analysis 11.5.1. By Country 11.5.2. By Type 11.5.3. By Application 12. Latin America Market Analysis 2015 to 2021 and Forecast 2022 to 2032 12.1. Introduction 12.2. Pricing Analysis 12.3. Historical Market Value (US$ Million) Trend Analysis By Market Taxonomy, 2015 to 2021 12.4. Market Value (US$ Million) & Forecast By Market Taxonomy, 2022 to 2032 12.4.1. By Country 12.4.1.1. Brazil 12.4.1.2. Mexico 12.4.1.3. Rest of Latin America 12.4.2. By Type 12.4.3. By Application 12.5. Market Attractiveness Analysis 12.5.1. By Country 12.5.2. By Type 12.5.3. By Application 13. Europe Market Analysis 2015 to 2021 and Forecast 2022 to 2032 13.1. Introduction 13.2. Pricing Analysis 13.3. Historical Market Value (US$ Million) Trend Analysis By Market Taxonomy, 2015 to 2021 13.4. Market Value (US$ Million) & Forecast By Market Taxonomy, 2022 to 2032 13.4.1. By Country 13.4.1.1. Germany 13.4.1.2. France 13.4.1.3. United Kingdom 13.4.1.4. Italy 13.4.1.5. Benelux 13.4.1.6. Nordic Countries 13.4.1.7. Rest of Europe 13.4.2. By Type 13.4.3. By Application 13.5. Market Attractiveness Analysis 13.5.1. By Country 13.5.2. By Type 13.5.3. By Application 14. Asia Pacific Market Analysis 2015 to 2021 and Forecast 2022 to 2032 14.1. Introduction 14.2. Pricing Analysis 14.3. Historical Market Value (US$ Million) Trend Analysis By Market Taxonomy, 2015 to 2021 14.4. Market Value (US$ Million) & Forecast By Market Taxonomy, 2022 to 2032 14.4.1. By Country 14.4.1.1. China 14.4.1.2. Japan 14.4.1.3. South Korea 14.4.1.4. Rest of Asia Pacific 14.4.2. By Type 14.4.3. By Application 14.5. Market Attractiveness Analysis 14.5.1. By Country 14.5.2. By Type 14.5.3. By Application 15. Middle East and Africa Market Analysis 2015 to 2021 and Forecast 2022 to 2032 15.1. Introduction 15.2. Pricing Analysis 15.3. Historical Market Value (US$ Million) Trend Analysis By Market Taxonomy, 2015 to 2021 15.4. Market Value (US$ Million) & Forecast By Market Taxonomy, 2022 to 2032 15.4.1. By Country 15.4.1.1. GCC Countries 15.4.1.2. South Africa 15.4.1.3. Turkey 15.4.1.4. Rest of Middle East and Africa 15.4.2. By Type 15.4.3. By Application 15.5. Market Attractiveness Analysis 15.5.1. By Country 15.5.2. By Type 15.5.3. By Application 16. Key Countries Market Analysis 2015 to 2021 and Forecast 2022 to 2032 16.1. Introduction 16.1.1. Market Value Proportion Analysis, By Key Countries 16.1.2. Global Vs. Country Growth Comparison 16.2. US Market Analysis 16.2.1. Value Proportion Analysis by Market Taxonomy 16.2.2. Value & Analysis and Forecast by Market Taxonomy, 2015 to 2032 16.2.2.1. By Type 16.2.2.2. By Application 16.3. Canada Market Analysis 16.3.1. Value Proportion Analysis by Market Taxonomy 16.3.2. Value & Analysis and Forecast by Market Taxonomy, 2015 to 2032 16.3.2.1. By Type 16.3.2.2. By Application 16.4. Mexico Market Analysis 16.4.1. Value Proportion Analysis by Market Taxonomy 16.4.2. Value & Analysis and Forecast by Market Taxonomy, 2015 to 2032 16.4.2.1. By Type 16.4.2.2. By Application 16.5. Brazil Market Analysis 16.5.1. Value Proportion Analysis by Market Taxonomy 16.5.2. Value & Analysis and Forecast by Market Taxonomy, 2015 to 2032 16.5.2.1. By Type 16.5.2.2. By Application 16.6. Germany Market Analysis 16.6.1. Value Proportion Analysis by Market Taxonomy 16.6.2. Value & Analysis and Forecast by Market Taxonomy, 2015 to 2032 16.6.2.1. By Type 16.6.2.2. By Application 16.7. France Market Analysis 16.7.1. Value Proportion Analysis by Market Taxonomy 16.7.2. Value & Analysis and Forecast by Market Taxonomy, 2015 to 2032 16.7.2.1. By Type 16.7.2.2. By Application 16.8. Italy Market Analysis 16.8.1. Value Proportion Analysis by Market Taxonomy 16.8.2. Value & Analysis and Forecast by Market Taxonomy, 2015 to 2032 16.8.2.1. By Type 16.8.2.2. By Application 16.9. BENELUX Market Analysis 16.9.1. Value Proportion Analysis by Market Taxonomy 16.9.2. Value & Analysis and Forecast by Market Taxonomy, 2015 to 2032 16.9.2.1. By Type 16.9.2.2. By Application 16.10. UK Market Analysis 16.10.1. Value Proportion Analysis by Market Taxonomy 16.10.2. Value & Analysis and Forecast by Market Taxonomy, 2015 to 2032 16.10.2.1. By Type 16.10.2.2. By Application 16.11. Nordic Countries Market Analysis 16.11.1. Value Proportion Analysis by Market Taxonomy 16.11.2. Value & Analysis and Forecast by Market Taxonomy, 2015 to 2032 16.11.2.1. By Type 16.11.2.2. By Application 16.12. China Market Analysis 16.12.1. Value Proportion Analysis by Market Taxonomy 16.12.2. Value & Analysis and Forecast by Market Taxonomy, 2015 to 2032 16.12.2.1. By Type 16.12.2.2. By Application 16.13. Japan Market Analysis 16.13.1. Value Proportion Analysis by Market Taxonomy 16.13.2. Value & Analysis and Forecast by Market Taxonomy, 2015 to 2032 16.13.2.1. By Type 16.13.2.2. By Application 16.14. South Korea Market Analysis 16.14.1. Value Proportion Analysis by Market Taxonomy 16.14.2. Value & Analysis and Forecast by Market Taxonomy, 2015 to 2032 16.14.2.1. By Type 16.14.2.2. By Application 16.15. GCC Countries Market Analysis 16.15.1. Value Proportion Analysis by Market Taxonomy 16.15.2. Value & Analysis and Forecast by Market Taxonomy, 2015 to 2032 16.15.2.1. By Type 16.15.2.2. By Application 16.16. South Africa Market Analysis 16.16.1. Value Proportion Analysis by Market Taxonomy 16.16.2. Value & Analysis and Forecast by Market Taxonomy, 2015 to 2032 16.16.2.1. By Type 16.16.2.2. By Application 16.17. Turkey Market Analysis 16.17.1. Value Proportion Analysis by Market Taxonomy 16.17.2. Value & Analysis and Forecast by Market Taxonomy, 2015 to 2032 16.17.2.1. By Type 16.17.2.2. By Application 16.17.3. Competition Landscape and Player Concentration in the Country 17. Market Structure Analysis 17.1. Market Analysis by Tier of Companies 17.2. Market Concentration 17.3. Market Share Analysis of Top Players 17.4. Market Presence Analysis 17.4.1. By Regional Footprint of Players 17.4.2. Product Footprint by Players 18. Competition Analysis 18.1. Competition Dashboard 18.2. Competition Benchmarking 18.3. Competition Deep Dive 18.3.1. Conga 18.3.1.1. Overview 18.3.1.2. Product Portfolio 18.3.1.3. Sales Footprint 18.3.1.4. Strategy Overview 18.3.2. Nintex 18.3.2.1. Overview 18.3.2.2. Product Portfolio 18.3.2.3. Sales Footprint 18.3.2.4. Strategy Overview 18.3.3. SpringCM 18.3.3.1. Overview 18.3.3.2. Product Portfolio 18.3.3.3. Sales Footprint 18.3.3.4. Strategy Overview 18.3.4. DealHub 18.3.4.1. Overview 18.3.4.2. Product Portfolio 18.3.4.3. Sales Footprint 18.3.4.4. Strategy Overview 18.3.5. WebMerge 18.3.5.1. Overview 18.3.5.2. Product Portfolio 18.3.5.3. Sales Footprint 18.3.5.4. Strategy Overview 18.3.6. Windward Studios 18.3.6.1. Overview 18.3.6.2. Product Portfolio 18.3.6.3. Sales Footprint 18.3.6.4. Strategy Overview 18.3.7. S-Docs 18.3.7.1. Overview 18.3.7.2. Product Portfolio 18.3.7.3. Sales Footprint 18.3.7.4. Strategy Overview 18.3.8. Docomotion 18.3.8.1. Overview 18.3.8.2. Product Portfolio 18.3.8.3. Sales Footprint 18.3.8.4. Strategy Overview 18.3.9. Documill 18.3.9.1. Overview 18.3.9.2. Product Portfolio 18.3.9.3. Sales Footprint 18.3.9.4. Strategy Overview 19. Assumptions and Acronyms Used 20. Research Methodology
Don't pay for what you don't need
Customize your report by selecting specific countries or regions and save 30%!
List of Tables
Table 1: Global Market Value (US$ Million), By Type, 2015 to 2021 Table 2: Global Market Value (US$ Million), By Type, 2022 to 2032 Table 3: Global Market Value (US$ Million), By Application, 2015 to 2021 Table 4: Global Market Value (US$ Million), By Application, 2022 to 2032 Table 5: Global Market, By Region, 2015 to 2021 Table 6: Global Market, By Region, 2022 to 2032 Table 7: North America Market Value (US$ Million), By Type, 2015 to 2021 Table 8: North America Market Value (US$ Million), By Type, 2022 to 2032 Table 9: North America Market Value (US$ Million), By Application, 2015 to 2021 Table 10: North America Market Value (US$ Million), By Application, 2022 to 2032 Table 11: North America Market, By Country, 2015 to 2021 Table 12: North America Market, By Country, 2022 to 2032 Table 13: Latin America Market Value (US$ Million), By Type, 2015 to 2021 Table 14: Latin America Market Value (US$ Million), By Type, 2022 to 2032 Table 15: Latin America Market Value (US$ Million), By Application, 2015 to 2021 Table 16: Latin America Market Value (US$ Million), By Application, 2022 to 2032 Table 17: Latin America Market, By Country, 2015 to 2021 Table 18: Latin America Market, By Country, 2022 to 2032 Table 19: Europe Market Value (US$ Million), By Type, 2015 to 2021 Table 20: Europe Market Value (US$ Million), By Type, 2022 to 2032 Table 21: Europe Market Value (US$ Million), By Application, 2015 to 2021 Table 22: Europe Market Value (US$ Million), By Application, 2022 to 2032 Table 23: Europe Market, By Country, 2015 to 2021 Table 24: Europe Market, By Country, 2022 to 2032 Table 25: Asia Pacific Market Value (US$ Million), By Type, 2015 to 2021 Table 26: Asia Pacific Market Value (US$ Million), By Type, 2022 to 2032 Table 27: Asia Pacific Market Value (US$ Million), By Application, 2015 to 2021 Table 28: Asia Pacific Market Value (US$ Million), By Application, 2022 to 2032 Table 29: Asia Pacific Market, By Country, 2015 to 2021 Table 30: Asia Pacific Market, By Country, 2022 to 2032 Table 31: MEA Market Value (US$ Million), By Type, 2015 to 2021 Table 32: MEA Market Value (US$ Million), By Type, 2022 to 2032 Table 33: MEA Market Value (US$ Million), By Application, 2015 to 2021 Table 34: MEA Market Value (US$ Million), By Application, 2022 to 2032 Table 35: MEA Market, By Country, 2015 to 2021 Table 36: MEA Market, By Country, 2022 to 2032 Table 37: Global Market Incremental $ Opportunity, By Type, 2015 to 2021 Table 38: Global Market Incremental $ Opportunity, By Application, 2022 to 2032 Table 39: Global Market Incremental $ Opportunity, By Region, 2022 to 2032 Table 40: North America Market Incremental $ Opportunity, By Type, 2015 to 2021 Table 41: North America Market Incremental $ Opportunity, By Application, 2022 to 2032 Table 42: North America Market Incremental $ Opportunity, By Country, 2022 to 2032 Table 43: Latin America Market Incremental $ Opportunity, By Type, 2015 to 2021 Table 44: Latin America Market Incremental $ Opportunity, By Application, 2022 to 2032 Table 45: Latin America Market Incremental $ Opportunity, By Country, 2022 to 2032 Table 46: Europe Market Incremental $ Opportunity, By Type, 2015 to 2021 Table 47: Europe Market Incremental $ Opportunity, By Application, 2022 to 2032 Table 48: Europe Market Incremental $ Opportunity, By Country, 2022 to 2032 Table 49: Asia Pacific Market Incremental $ Opportunity, By Type, 2015 to 2021 Table 50: Asia Pacific Market Incremental $ Opportunity, By Application, 2022 to 2032 Table 51: Asia Pacific Market Incremental $ Opportunity, By Country, 2022 to 2032 Table 52: MEA Market Incremental $ Opportunity, By Type, 2015 to 2021 Table 53: MEA Market Incremental $ Opportunity, By Application, 2022 to 2032 Table 54: MEA Market Incremental $ Opportunity, By Country, 2022 to 2032
Find your sweet spots for generating winning opportunities in this market.
Talk to AnalystList of Charts
Figure 1: Global Market Value (US$ Million) and Year-on-Year Growth, 2015 to 2032 Figure 2: Global Market Absolute $ Historical Gain (2015 to 2021) and Opportunity (2022 to 2032), US$ Million Figure 3: Global Market Share, By Type, 2022 & 2032 Figure 4: Global Market Y-o-Y Growth Projections, By Type - 2022 to 2032 Figure 5: Global Market Attractiveness Index, By Type - 2022 to 2032 Figure 6: Global Market Share, By Application, 2022 & 2032 Figure 7: Global Market Y-o-Y Growth Projections, By Application - 2022 to 2032 Figure 8: Global Market Attractiveness Index, By Application - 2022 to 2032 Figure 9: Global Market Share, By Region, 2022 & 2032 Figure 10: Global Market Y-o-Y Growth Projections, By Region - 2022 to 2032 Figure 11: Global Market Attractiveness Index, By Region - 2022 to 2032 Figure 12: North America Market Value (US$ Million) and Year-on-Year Growth, 2015 to 2032 Figure 13: North America Market Absolute $ Opportunity Historical (2015 to 2021) and Forecast Period (2022 to 2032), US$ Million Figure 14: North America Market Share, By Type, 2022 & 2032 Figure 15: North America Market Y-o-Y Growth Projections, By Type - 2022 to 2032 Figure 16: North America Market Attractiveness Index, By Type - 2022 to 2032 Figure 17: North America Market Share, By Application, 2022 & 2032 Figure 18: North America Market Y-o-Y Growth Projections, By Application - 2022 to 2032 Figure 19: North America Market Attractiveness Index, By Application - 2022 to 2032 Figure 20: North America Market Share, By Country, 2022 & 2032 Figure 21: North America Market Y-o-Y Growth Projections, By Country - 2022 to 2032 Figure 22: North America Market Attractiveness Index, By Country - 2022 to 2032 Figure 23: Latin America Market Value (US$ Million) and Year-on-Year Growth, 2015 to 2032 Figure 24: Latin America Market Absolute $ Opportunity Historical (2015 to 2021) and Forecast Period (2022 to 2032), US$ Million Figure 25: Latin America Market Share, By Type, 2022 & 2032 Figure 26: Latin America Market Y-o-Y Growth Projections, By Type - 2022 to 2032 Figure 27: Latin America Market Attractiveness Index, By Type - 2022 to 2032 Figure 28: Latin America Market Share, By Application, 2022 & 2032 Figure 29: Latin America Market Y-o-Y Growth Projections, By Application - 2022 to 2032 Figure 30: Latin America Market Attractiveness Index, By Application - 2022 to 2032 Figure 31: Latin America Market Share, By Country, 2022 & 2032 Figure 32: Latin America Market Y-o-Y Growth Projections, By Country - 2022 to 2032 Figure 33: Latin America Market Attractiveness Index, By Country - 2022 to 2032 Figure 34: Europe Market Value (US$ Million) and Year-on-Year Growth, 2015 to 2032 Figure 35: Europe Market Absolute $ Opportunity Historical (2015 to 2021) and Forecast Period (2022 to 2032), US$ Million Figure 36: Europe Market Share, By Type, 2022 & 2032 Figure 37: Europe Market Y-o-Y Growth Projections, By Type - 2022 to 2032 Figure 38: Europe Market Attractiveness Index, By Type - 2022 to 2032 Figure 39: Europe Market Share, By Application, 2022 & 2032 Figure 40: Europe Market Y-o-Y Growth Projections, By Application - 2022 to 2032 Figure 41: Europe Market Attractiveness Index, By Application - 2022 to 2032 Figure 42: Europe Market Share, By Country, 2022 & 2032 Figure 43: Europe Market Y-o-Y Growth Projections, By Country - 2022 to 2032 Figure 44: Europe Market Attractiveness Index, By Country - 2022 to 2032 Figure 45: MEA Market Value (US$ Million) and Year-on-Year Growth, 2015 to 2032 Figure 46: MEA Market Absolute $ Opportunity Historical (2015 to 2021) and Forecast Period (2022 to 2032), US$ Million Figure 47: MEA Market Share, By Type, 2022 & 2032 Figure 48: MEA Market Y-o-Y Growth Projections, By Type - 2022 to 2032 Figure 49: MEA Market Attractiveness Index, By Type - 2022 to 2032 Figure 50: MEA Market Share, By Application, 2022 & 2032 Figure 51: MEA Market Y-o-Y Growth Projections, By Application - 2022 to 2032 Figure 52: MEA Market Attractiveness Index, By Application - 2022 to 2032 Figure 53: MEA Market Share, By Country, 2022 & 2032 Figure 54: MEA Market Y-o-Y Growth Projections, By Country - 2022 to 2032 Figure 55: MEA Market Attractiveness Index, By Country - 2022 to 2032 Figure 56: Asia Pacific Market Value (US$ Million) and Year-on-Year Growth, 2015 to 2032 Figure 57: Asia Pacific Market Absolute $ Opportunity Historical (2015 to 2021) and Forecast Period (2022 to 2032), US$ Million Figure 58: Asia Pacific Market Share, By Type, 2022 & 2032 Figure 59: Asia Pacific Market Y-o-Y Growth Projections, By Type - 2022 to 2032 Figure 60: Asia Pacific Market Attractiveness Index, By Type - 2022 to 2032 Figure 61: Asia Pacific Market Share, By Application, 2022 & 2032 Figure 62: Asia Pacific Market Y-o-Y Growth Projections, By Application - 2022 to 2032 Figure 63: Asia Pacific Market Attractiveness Index, By Application - 2022 to 2032 Figure 64: Asia Pacific Market Share, By Country, 2022 & 2032 Figure 65: Asia Pacific Market Y-o-Y Growth Projections, By Country - 2022 to 2032 Figure 66: Asia Pacific Market Attractiveness Index, By Country - 2022 to 2032 Figure 67: USA Market Value (US$ Million) and Forecast, 2022 to 2032 Figure 68: USA Market Share, By Type, 2021 Figure 69: USA Market Share, By Application, 2021 Figure 70: Canada Market Value (US$ Million) and Forecast, 2022 to 2032 Figure 71: Canada Market Share, By Type, 2021 Figure 72: Canada Market Share, By Application, 2021 Figure 73: Brazil Market Value (US$ Million) and Forecast, 2022 to 2032 Figure 74: Brazil Market Share, By Type, 2021 Figure 75: Brazil Market Share, By Application, 2021 Figure 76: Mexico Market Value (US$ Million) and Forecast, 2022 to 2032 Figure 77: Mexico Market Share, By Type, 2021 Figure 78: Mexico Market Share, By Application, 2021 Figure 79: Germany Market Value (US$ Million) and Forecast, 2022 to 2032 Figure 80: Germany Market Share, By Type, 2021 Figure 81: Germany Market Share, By Application, 2021 Figure 82: UK Market Value (US$ Million) and Forecast, 2022 to 2032 Figure 83: UK Market Share, By Type, 2021 Figure 84: UK Market Share, By Application, 2021 Figure 85: France Market Value (US$ Million) and Forecast, 2022 to 2032 Figure 86: France Market Share, By Type, 2021 Figure 87: France Market Share, By Application, 2021 Figure 88: Italy Market Value (US$ Million) and Forecast, 2022 to 2032 Figure 89: Italy Market Share, By Type, 2021 Figure 90: Italy Market Share, By Application, 2021 Figure 91: BENELUX Market Value (US$ Million) and Forecast, 2022 to 2032 Figure 92: BENELUX Market Share, By Type, 2021 Figure 93: BENELUX Market Share, By Application, 2021 Figure 94: Nordic Countries Market Value (US$ Million) and Forecast, 2022 to 2032 Figure 95: Nordic Countries Market Share, By Type, 2021 Figure 96: Nordic Countries Market Share, By Application, 2021 Figure 97: China Market Value (US$ Million) and Forecast, 2022 to 2032 Figure 98: China Market Share, By Type, 2021 Figure 99: China Market Share, By Application, 2021 Figure 100: Japan Market Value (US$ Million) and Forecast, 2022 to 2032 Figure 101: Japan Market Share, By Type, 2021 Figure 102: Japan Market Share, By Application, 2021 Figure 103: South Korea Market Value (US$ Million) and Forecast, 2022 to 2032 Figure 104: South Korea Market Share, By Type, 2021 Figure 105: South Korea Market Share, By Application, 2021 Figure 106: GCC Countries Market Value (US$ Million) and Forecast, 2022 to 2032 Figure 107: GCC Countries Market Share, By Type, 2021 Figure 108: GCC Countries Market Share, By Application, 2021 Figure 109: South Africa Market Value (US$ Million) and Forecast, 2022 to 2032 Figure 110: South Africa Market Share, By Type, 2021 Figure 111: South Africa Market Share, By Application, 2021 Figure 112: Turkey Market Value (US$ Million) and Forecast, 2022 to 2032 Figure 113: Turkey Market Share, By Type, 2021 Figure 114: Turkey Market Share, By Application, 2021
Recommendations
Explore Technology Insights
View Reports