Reports

- Global Locations -

Headquarters

Future Market Insights, Inc.

Christiana Corporate, 200
Continental Drive, Suite 401,
Newark, Delaware - 19713,
United States

T: +1-845-579-5705

Americas

Future Market Insights, Inc.

616 Corporate Way, Suite 2-9018,
Valley Cottage, NY 10989, United States

T: +1-347-918-3531

MEA

Future Market Insights

1602-6 Jumeirah Bay X2 Tower, Plot No: JLT-PH2-X2A,
Jumeirah Lakes Towers, Dubai,
United Arab Emirates

Europe

Future Market Insights

3rd Floor, 207 Regent Street,
W1B 3HH London
United Kingdom

T: + 44 (0) 20 8123 9659
D: +44 (0) 20 3287 4268

Asia Pacific

Future Market Insights

IndiaLand Global Tech Park, Unit UG-1, Behind Grand HighStreet, Phase 1, Hinjawadi, MH, Pune – 411057, India

AI-Powered CRM Platform Market Outlook from 2024 to 2034

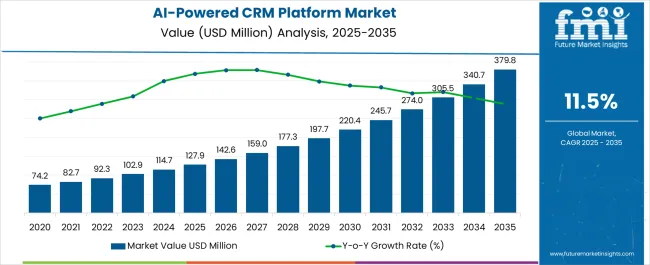
The global AI-powered CRM platform market is expected to leap impressively at a CAGR of 11.50% between 2024 and 2034 to reach US$ 340.6 million. The said market is supposed to achieve a US$ 114.7 million market valuation by 2024. Several market forces will influence the market.

Attributes Key Insights
Estimated Market Size in 2024 US$ 114.7 million
Projected Market Value in 2034 US$ 340.6 million
Value-based CAGR from 2024 to 2034 11.50%

Don't pay for what you don't need

Customize your report by selecting specific countries or regions and save 30%!

Key Market Trends and Highlights

  • Customer behavior is forecasted using predictive analysis. This has been the foremost market trend that enables the business to meet customer expectations even before the customer requisition.
  • Emphasis on sales and marketing activities using AI-powered CRM platforms has been another key trend driving the market.
  • Increasing the speed of customer services by using embedded software and tools like machine learning, NLP, and AI has been another trend, acting as a crucial driving force for the market.
  • Collection, management, and data reproduction for generating sales leads are key trends in the market.

Demand Analysis of AI-Powered CRM Platform Market from 2019 to 2023 vs. Outlook from 2024 to 2034

Historical CAGR from 2019 to 2023 10.70%
Forecast CAGR from 2024 to 2034 11.50%

The historical CAGR of 10.70% helps the AI-powered CRM platform market jump from US$ 68.8 million to US$ 103.5 million from 2019 to 2023, respectively. This market advancement was subjected to the rising demand for e-commerce platforms.

The pandemic surged the demand for various e-commerce platforms, which required the assistance of artificial intelligence to resolve customers' queries. Hence, this was the fundamental surging factor.

Apart from this, the data management of numerous patients was essential as there was a significant surge in the number of patients being affected due to various diseases having similar symptoms. Integrating AI in CRM allowed medical institutions to classify and segregate patients under different categories to make their treatment easier.

However, the forecasted period relies more on the customer relationship of large-scale businesses. The remote operation of businesses emphasizes better customer interaction, encouraging enterprises to enhance customer comfort. Hence, integrating cutting-edge technology to improve response time drives the demand for AI-powered CRM platforms.

Apart from this, E-commerce platforms' constant growth is another market driver that generates demand for platforms, similar to the historical period.

Sudip Saha
Sudip Saha

Principal Consultant

Talk to Analyst

Find your sweet spots for generating winning opportunities in this market.

Market Drivers

  • The rising demand for enhanced customer support and service propels the global AI-powered CRM platform market. Integrating AI and other cutting-edge technological tools enhances the serviceability of traditional CRM systems. Due to this, the system's overall efficiency increases, which is a key market driver for the subject market.
  • More emphasis is being placed on personalizing the customer service. It is another key market driver, as personalization delivers tailored solutions to customers based on their issues and problems.
  • Increasing data can prove to be a serious issue in the future. Moreover, data could be considered a weapon in Industry 4.0. So, its management is essential, where AI-powered CRM platforms play an active role. Hence, it is another market driver.
  • Generating sales and marketing leads is another crucial platform application. Businesses extensively use this to enhance their overall performance, a key driving force for the subject market.

Market Challenges

  • The cost of technology acquisition might be the biggest concern for the global AI-powered CRM platform market. Due to the higher pricing of tools and software like AI, NLP, and machine learning, its accessibility decreases, which might create a challenge for the market.
  • Lack of literacy regarding using tools and software mentioned above drags the market. Consequently, this can be another key market challenge. Also, the maintenance and servicing of the platforms might be a concern due to the unavailability of skilled labor. Hence, this is another challenge.

Get the data you need at a Fraction of the cost

Personalize your report by choosing insights you need
and save 40%!

Comparative View of Adjacent Markets

Future Market Insights has analysed three markets that are adjacent to each other. Along with the global AI-powered CRM platform market, the personal and AI-powered storage markets have been studied to understand market dynamics better. Some key insights of these markets are as follows:

AI-Powered CRM Platform Market:

Attributes AI-Powered CRM Platform Market
CAGR from 2024 to 2034 11.50%
Key Trends Predicting customer behavior using predictive analysis is a key market trend.
Growth Factor Growing demand to improve response time and enhance customer interaction.

Personal CRM Market:

Attributes Personal CRM Market
CAGR from 2024 to 2034 12.50%
Key Trends Developing user-friendly interfaces and mobile wallet compatibility are the key trends.
Growth Factor Developed digital media and communication channels drive the subject market.

AI-powered Storage Market:

Attributes AI-powered Storage Market
CAGR from 2024 to 2034 20.70%
Key Trends Cloud integration has emerged, and it enhances cost-effectiveness.
Growth Factor Integrating AI with cloud storage drives the market in terms of its scalability.

Country-wise Analysis

Technological advancements have helped different countries contribute heavily to the global AI-powered CRM platform market. The Asian and Pacific countries are leading the market as the end-user industry in these countries is growing. In addition, Australia and New Zealand lead all the countries by registering the highest growth rate in the forecasted period.

North America is another market that provides a wider landscape to the subject market. The developed technological infrastructure creates lucrative growth opportunities for the market.

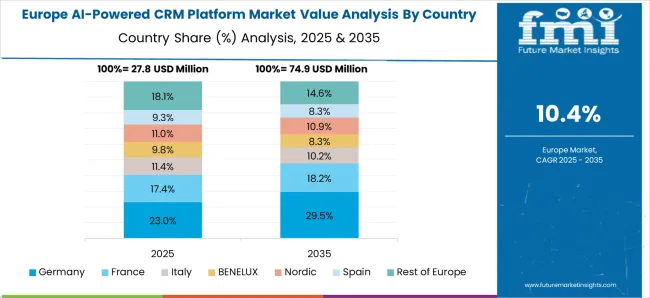
Europe is another significant contributor, creating strong opportunities for many organizations to expand. Due to this, the growth rate of the market is increasing rapidly.

Forecast CAGRs from 2024 to 2034

Countries Forecast CAGR until 2034
The United States of America 8.40%
Germany 5.00%
Japan 4.30%
China 12.00%
Australia and New Zealand 15.00%

Increasing Industry-Specific Solutions’ Demand Drive the United States Market

  • The United States of America is the market leader, with the highest CAGR of 8.40% for the forecasted period.
  • This market growth is attributed to the increasing demand for tailored solutions for different industries.
  • As different industries post different requirements, solutions for these demands differ, surging the subject market.
  • Furthermore, the scope of innovation has increased, giving room to expanding the market verticals.
  • Apart from this, the usability of technology in multiple industries and industry verticals has helped the American market to flourish. Automation also favors this market growth.

Digital Transformation Transforms the AI-Powered CRM Platform Market in Germany

  • Among all the European countries, Germany registers the highest CAGR of 5.00%, helping it to lead the region.
  • Manufacturing and engineering are two key sectors undergoing digital transformation during Industry 4.0. Technology can be integrated into many departments to enhance organizational efficiency, surging the need for relevant technology.
  • Hence, this surges the demand for advanced technological assistance, which can develop all integral processing of these industries.
  • Therefore, the demand for AI-powered CRM platforms is increasing, helping the subject market grow moderately.

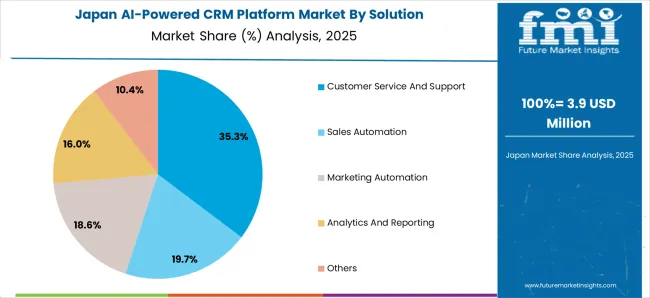
Omni-Channel Customer Engagement Fuel the Japanese Market

  • Customers prefer personalized interaction with businesses. Due to this, they seek organizations that provide them with constant assistance.
  • Consequently, organizations are keen to interact with customers, solving their queries across different touchpoints.
  • This can be achieved with the help of tailored solutions provided by the AI-powered CRM platform, which propels the AI-powered CRM platform market in the country.
  • However, the advancement of the market is at a sluggish CAGR of 4.30%.

Technological Infrastructure Propels the AI-Powered CRM Platform Market in China

  • Rapidly developing technological infrastructure in China accelerates market advancement.
  • Due to the government's investment and different key marketers, technological infrastructure is developing, reducing the overall cost of components and enhancing manufacturing.
  • This fuels the subject market in terms of its advancements and results in its impressive CAGR of 12.00%.
  • Technological evolution enhances the CRM platforms' accuracy, quality, and durability.

Rising E-Commerce Platforms Surge the Demand for the AI-Powered CRM Platform Market in Australia and New Zealand

  • Australia and New Zealand lead the global AI-powered CRM platform market by registering the highest CAGR of 15.00%.
  • This staggering CAGR results from the growing E-commerce platforms, attributed to the rising demand for customer support.
  • Constant evolution of processes based on customer feedback is an integral part of E-commerce functioning, achieved by AI-powered CRM platforms.

Category-wise Insights

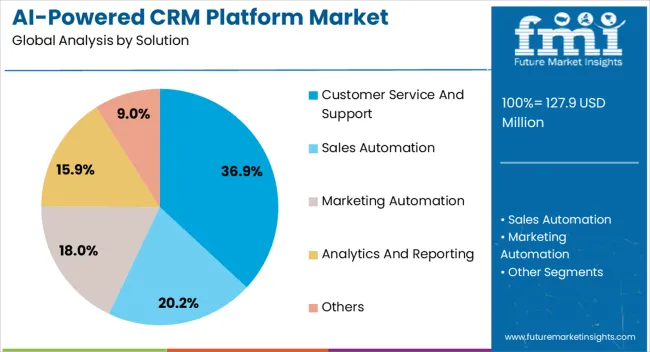
Category Solution- Customer Service and Support
Market Share in 2024 36.90%
Market Segment Drivers
  • Due to increased customer connectivity with the business, their approachability increases, which drives the market.
  • The accuracy, speed, and consumer-tailored response enhance serviceability, driving the market segment.
  • Uninterrupted customer service and support increase popularity, making it a critical market driver.
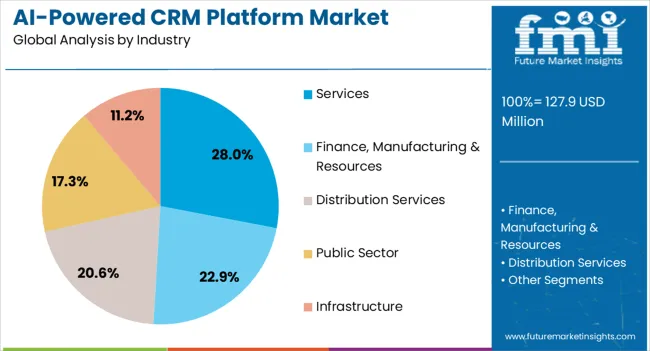
Category Industry- Services
Market Share in 2024 28%
Market Segment Drivers
  • Customer interaction is enhanced with the help of CRM. This is the most vital market driver.
  • Customer feedback is processed rapidly, and the output is tailored to the input, enhancing the process. This drives consumer demand.

Competitive Landscape

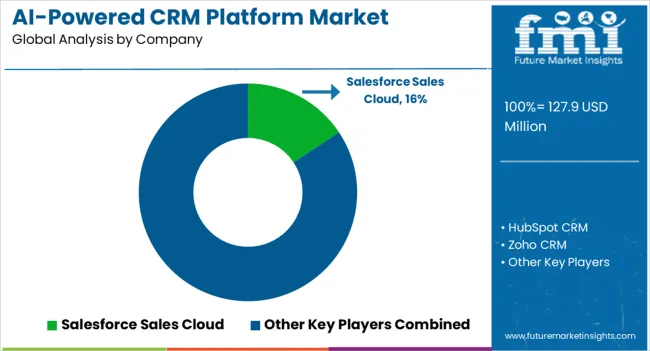
Different businesses play an active role in governing the competitive landscape. They clutter the market with their presence through various offerings, including products and services.

However, it is vital to differentiate the product portfolio for a new entrant to embark on its position. Also, market penetration must be focused so that a strong brand position can be established.

In the case of the existing key competitors, mergers and acquisitions, product development, innovation, and partnerships are key market expansion modes that yield a competitive niche. Further, diversifying the technology used in the product is another key approach to bolster the market position.

Key Market Developments

  • In March 2020, Oracle acquired LiveData Utilities. The organization's strategic move helped the business expand its market presence. It also enabled the enterprise to develop a platform with Live Energy Connect (LEC), an operational technology (OT), as its two major components. This will enhance the scalability and integrity of the software.
  • In November 2023, Zoho invested £15 million to expand the business. The organization aimed to revolutionize the finance platform for accountants. The organization explores a new market niche through this strategic initiative.
  • In March 2024, Salesforce has launched its new software- Pro Suite. It is comprised of all-in-one CRM solutions. The business claims the software to be useful for emerging and growing businesses. With the help of this strategic move, the organization is tapping new clientele.

Key Coverage of AI-Powered CRM Platform Market Report

  • Coverage of market dynamics and lucrative market openings.
  • Analysis of the competitive space and possible niche in the market.
  • Developed and developed regions, creating possible market openings.
  • Categorical market analysis, emphasis placed on key segments.

Report Scope

Attributes Details
Estimated Market Size in 2024 US$ 114.7 million
Projected Market Valuation in 2034 US$ 340.6 million
Value-based CAGR 2024 to 2034 11.50%
Forecast Period 2024 to 2034
Historical Data Available for 2019 to 2023
Market Analysis Value in US$ million/billion
Key Regions Covered
  • North America
  • Latin America
  • Western Europe
  • Eastern Europe
  • South Asia and Pacific
  • East Asia
  • The Middle East and Africa
Key Market Segments Covered
  • Solution
  • Industry
  • Region
Key Countries Profiled
  • The United States
  • Canada
  • Brazil
  • Mexico
  • Germany
  • The United Kingdom
  • France
  • Spain
  • Italy
  • Poland
  • Russia
  • Czech Republic
  • Romania
  • India
  • Bangladesh
  • Australia
  • New Zealand
  • China
  • Japan
  • South Korea
  • GCC Countries
  • South Africa
  • Israel
Key Companies Profiled
  • HubSpot CRM
  • Freshsales
  • Pipedrive
  • Zoho CRM
  • Zendesk Sell
  • ClickUp
  • Durable
  • C3.ai
  • Salesforce Sales Cloud
  • itransition

AI-Powered CRM Platform Market- Key Segments

By Solution:

  • Sales Automation
  • Marketing Automation
  • Customer Service and Support
  • Analytics and Reporting
  • Others

By Industry:

  • Finance, Manufacturing & Resources
  • Distribution Services
  • Services
  • Public Sector
  • Infrastructure

By Region:

  • North America
  • Latin America
  • Western Europe
  • Eastern Europe
  • South Asia and Pacific
  • East Asia
  • The Middle East and Africa

Frequently Asked Questions

At what rate is the AI-powered CRM platform market progressing during the forecasted period?

The AI-powered CRM platform market is forecasted to progress at a CAGR of 11.50% through 2034.

What is the scope of growth for the AI-powered CRM platform market by 2034?

The AI-powered CRM platform market is expected to reach US$ 340.6 million by 2034.

What will the market valuation of the AI-powered CRM platform market be by 2024?

The AI-powered CRM platform market reached US$ 114.7 million in 2024.

By solution, which category is the largest market shareholder in the AI-powered CRM platform market?

The AI-powered CRM platform's customer service and support is 36.9%.

By industry, which category is the largest AI-powered CRM platform market shareholder?

The AI-powered CRM platform's customer service and support is 28%.

Table of Content

1. Executive Summary

    1.1. Global Market Outlook

    1.2. Demand-side Trends

    1.3. Supply-side Trends

    1.4. Technology Roadmap Analysis

    1.5. Analysis and Recommendations

2. Market Overview

    2.1. Market Coverage / Taxonomy

    2.2. Market Definition / Scope / Limitations

3. Market Background

    3.1. Market Dynamics

        3.1.1. Drivers

        3.1.2. Restraints

        3.1.3. Opportunity

        3.1.4. Trends

    3.2. Scenario Forecast

        3.2.1. Demand in Optimistic Scenario

        3.2.2. Demand in Likely Scenario

        3.2.3. Demand in Conservative Scenario

    3.3. Opportunity Map Analysis

    3.4. Investment Feasibility Matrix

    3.5. PESTLE and Porter’s Analysis

    3.6. Regulatory Landscape

        3.6.1. By Key Regions

        3.6.2. By Key Countries

    3.7. Regional Parent Market Outlook

4. Global Market Analysis 2019 to 2023 and Forecast, 2024 to 2034

    4.1. Historical Market Size Value (US$ Million) Analysis, 2019 to 2023

    4.2. Current and Future Market Size Value (US$ Million) Projections, 2024 to 2034

        4.2.1. Y-o-Y Growth Trend Analysis

        4.2.2. Absolute $ Opportunity Analysis

5. Global Market Analysis 2019 to 2023 and Forecast 2024 to 2034, By Solution

    5.1. Introduction / Key Findings

    5.2. Historical Market Size Value (US$ Million) Analysis By Solution, 2019 to 2023

    5.3. Current and Future Market Size Value (US$ Million) Analysis and Forecast By Solution, 2024 to 2034

        5.3.1. Sales Automation

        5.3.2. Marketing Automation

        5.3.3. Customer Service and Support

        5.3.4. Analytics and Reporting

        5.3.5. Others

    5.4. Y-o-Y Growth Trend Analysis By Solution, 2019 to 2023

    5.5. Absolute $ Opportunity Analysis By Solution, 2024 to 2034

6. Global Market Analysis 2019 to 2023 and Forecast 2024 to 2034, By Industry

    6.1. Introduction / Key Findings

    6.2. Historical Market Size Value (US$ Million) Analysis By Industry, 2019 to 2023

    6.3. Current and Future Market Size Value (US$ Million) Analysis and Forecast By Industry, 2024 to 2034

        6.3.1. Finance, Manufacturing & Resources

        6.3.2. Distribution Services

        6.3.3. Services

        6.3.4. Public Sector

        6.3.5. Infrastructure

    6.4. Y-o-Y Growth Trend Analysis By Industry, 2019 to 2023

    6.5. Absolute $ Opportunity Analysis By Industry, 2024 to 2034

7. Global Market Analysis 2019 to 2023 and Forecast 2024 to 2034, By Region

    7.1. Introduction

    7.2. Historical Market Size Value (US$ Million) Analysis By Region, 2019 to 2023

    7.3. Current Market Size Value (US$ Million) Analysis and Forecast By Region, 2024 to 2034

        7.3.1. North America

        7.3.2. Latin America

        7.3.3. Western Europe

        7.3.4. Eastern Europe

        7.3.5. South Asia and Pacific

        7.3.6. East Asia

        7.3.7. Middle East and Africa

    7.4. Market Attractiveness Analysis By Region

8. North America Market Analysis 2019 to 2023 and Forecast 2024 to 2034, By Country

    8.1. Historical Market Size Value (US$ Million) Trend Analysis By Market Taxonomy, 2019 to 2023

    8.2. Market Size Value (US$ Million) Forecast By Market Taxonomy, 2024 to 2034

        8.2.1. By Country

            8.2.1.1. USA

            8.2.1.2. Canada

        8.2.2. By Solution

        8.2.3. By Industry

    8.3. Market Attractiveness Analysis

        8.3.1. By Country

        8.3.2. By Solution

        8.3.3. By Industry

    8.4. Key Takeaways

9. Latin America Market Analysis 2019 to 2023 and Forecast 2024 to 2034, By Country

    9.1. Historical Market Size Value (US$ Million) Trend Analysis By Market Taxonomy, 2019 to 2023

    9.2. Market Size Value (US$ Million) Forecast By Market Taxonomy, 2024 to 2034

        9.2.1. By Country

            9.2.1.1. Brazil

            9.2.1.2. Mexico

            9.2.1.3. Rest of Latin America

        9.2.2. By Solution

        9.2.3. By Industry

    9.3. Market Attractiveness Analysis

        9.3.1. By Country

        9.3.2. By Solution

        9.3.3. By Industry

    9.4. Key Takeaways

10. Western Europe Market Analysis 2019 to 2023 and Forecast 2024 to 2034, By Country

    10.1. Historical Market Size Value (US$ Million) Trend Analysis By Market Taxonomy, 2019 to 2023

    10.2. Market Size Value (US$ Million) Forecast By Market Taxonomy, 2024 to 2034

        10.2.1. By Country

            10.2.1.1. Germany

            10.2.1.2. UK

            10.2.1.3. France

            10.2.1.4. Spain

            10.2.1.5. Italy

            10.2.1.6. Rest of Western Europe

        10.2.2. By Solution

        10.2.3. By Industry

    10.3. Market Attractiveness Analysis

        10.3.1. By Country

        10.3.2. By Solution

        10.3.3. By Industry

    10.4. Key Takeaways

11. Eastern Europe Market Analysis 2019 to 2023 and Forecast 2024 to 2034, By Country

    11.1. Historical Market Size Value (US$ Million) Trend Analysis By Market Taxonomy, 2019 to 2023

    11.2. Market Size Value (US$ Million) Forecast By Market Taxonomy, 2024 to 2034

        11.2.1. By Country

            11.2.1.1. Poland

            11.2.1.2. Russia

            11.2.1.3. Czech Republic

            11.2.1.4. Romania

            11.2.1.5. Rest of Eastern Europe

        11.2.2. By Solution

        11.2.3. By Industry

    11.3. Market Attractiveness Analysis

        11.3.1. By Country

        11.3.2. By Solution

        11.3.3. By Industry

    11.4. Key Takeaways

12. South Asia and Pacific Market Analysis 2019 to 2023 and Forecast 2024 to 2034, By Country

    12.1. Historical Market Size Value (US$ Million) Trend Analysis By Market Taxonomy, 2019 to 2023

    12.2. Market Size Value (US$ Million) Forecast By Market Taxonomy, 2024 to 2034

        12.2.1. By Country

            12.2.1.1. India

            12.2.1.2. Bangladesh

            12.2.1.3. Australia

            12.2.1.4. New Zealand

            12.2.1.5. Rest of South Asia and Pacific

        12.2.2. By Solution

        12.2.3. By Industry

    12.3. Market Attractiveness Analysis

        12.3.1. By Country

        12.3.2. By Solution

        12.3.3. By Industry

    12.4. Key Takeaways

13. East Asia Market Analysis 2019 to 2023 and Forecast 2024 to 2034, By Country

    13.1. Historical Market Size Value (US$ Million) Trend Analysis By Market Taxonomy, 2019 to 2023

    13.2. Market Size Value (US$ Million) Forecast By Market Taxonomy, 2024 to 2034

        13.2.1. By Country

            13.2.1.1. China

            13.2.1.2. Japan

            13.2.1.3. South Korea

        13.2.2. By Solution

        13.2.3. By Industry

    13.3. Market Attractiveness Analysis

        13.3.1. By Country

        13.3.2. By Solution

        13.3.3. By Industry

    13.4. Key Takeaways

14. Middle East and Africa Market Analysis 2019 to 2023 and Forecast 2024 to 2034, By Country

    14.1. Historical Market Size Value (US$ Million) Trend Analysis By Market Taxonomy, 2019 to 2023

    14.2. Market Size Value (US$ Million) Forecast By Market Taxonomy, 2024 to 2034

        14.2.1. By Country

            14.2.1.1. GCC Countries

            14.2.1.2. South Africa

            14.2.1.3. Israel

            14.2.1.4. Rest of MEA

        14.2.2. By Solution

        14.2.3. By Industry

    14.3. Market Attractiveness Analysis

        14.3.1. By Country

        14.3.2. By Solution

        14.3.3. By Industry

    14.4. Key Takeaways

15. Key Countries Market Analysis

    15.1. USA

        15.1.1. Market Share Analysis, 2023

            15.1.1.1. By Solution

            15.1.1.2. By Industry

    15.2. Canada

        15.2.1. Market Share Analysis, 2023

            15.2.1.1. By Solution

            15.2.1.2. By Industry

    15.3. Brazil

        15.3.1. Market Share Analysis, 2023

            15.3.1.1. By Solution

            15.3.1.2. By Industry

    15.4. Mexico

        15.4.1. Market Share Analysis, 2023

            15.4.1.1. By Solution

            15.4.1.2. By Industry

    15.5. Germany

        15.5.1. Market Share Analysis, 2023

            15.5.1.1. By Solution

            15.5.1.2. By Industry

    15.6. UK

        15.6.1. Market Share Analysis, 2023

            15.6.1.1. By Solution

            15.6.1.2. By Industry

    15.7. France

        15.7.1. Market Share Analysis, 2023

            15.7.1.1. By Solution

            15.7.1.2. By Industry

    15.8. Spain

        15.8.1. Market Share Analysis, 2023

            15.8.1.1. By Solution

            15.8.1.2. By Industry

    15.9. Italy

        15.9.1. Market Share Analysis, 2023

            15.9.1.1. By Solution

            15.9.1.2. By Industry

    15.10. Poland

        15.10.1. Market Share Analysis, 2023

            15.10.1.1. By Solution

            15.10.1.2. By Industry

    15.11. Russia

        15.11.1. Market Share Analysis, 2023

            15.11.1.1. By Solution

            15.11.1.2. By Industry

    15.12. Czech Republic

        15.12.1. Market Share Analysis, 2023

            15.12.1.1. By Solution

            15.12.1.2. By Industry

    15.13. Romania

        15.13.1. Market Share Analysis, 2023

            15.13.1.1. By Solution

            15.13.1.2. By Industry

    15.14. India

        15.14.1. Market Share Analysis, 2023

            15.14.1.1. By Solution

            15.14.1.2. By Industry

    15.15. Bangladesh

        15.15.1. Market Share Analysis, 2023

            15.15.1.1. By Solution

            15.15.1.2. By Industry

    15.16. Australia

        15.16.1. Market Share Analysis, 2023

            15.16.1.1. By Solution

            15.16.1.2. By Industry

    15.17. New Zealand

        15.17.1. Market Share Analysis, 2023

            15.17.1.1. By Solution

            15.17.1.2. By Industry

    15.18. China

        15.18.1. Market Share Analysis, 2023

            15.18.1.1. By Solution

            15.18.1.2. By Industry

    15.19. Japan

        15.19.1. Market Share Analysis, 2023

            15.19.1.1. By Solution

            15.19.1.2. By Industry

    15.20. South Korea

        15.20.1. Market Share Analysis, 2023

            15.20.1.1. By Solution

            15.20.1.2. By Industry

    15.21. GCC Countries

        15.21.1. Market Share Analysis, 2023

            15.21.1.1. By Solution

            15.21.1.2. By Industry

    15.22. South Africa

        15.22.1. Market Share Analysis, 2023

            15.22.1.1. By Solution

            15.22.1.2. By Industry

    15.23. Israel

        15.23.1. Market Share Analysis, 2023

            15.23.1.1. By Solution

            15.23.1.2. By Industry

16. Market Structure Analysis

    16.1. Competition Dashboard

    16.2. Competition Benchmarking

    16.3. Market Share Analysis of Top Players

        16.3.1. By Regional

        16.3.2. By Solution

        16.3.3. By Industry

17. Competition Analysis

    17.1. Competition Deep Dive

        17.1.1. HubSpot CRM

            17.1.1.1. Overview

            17.1.1.2. Product Portfolio

            17.1.1.3. Profitability by Market Segments

            17.1.1.4. Sales Footprint

            17.1.1.5. Strategy Overview

                17.1.1.5.1. Marketing Strategy

        17.1.2. Freshsales

            17.1.2.1. Overview

            17.1.2.2. Product Portfolio

            17.1.2.3. Profitability by Market Segments

            17.1.2.4. Sales Footprint

            17.1.2.5. Strategy Overview

                17.1.2.5.1. Marketing Strategy

        17.1.3. Pipedrive

            17.1.3.1. Overview

            17.1.3.2. Product Portfolio

            17.1.3.3. Profitability by Market Segments

            17.1.3.4. Sales Footprint

            17.1.3.5. Strategy Overview

                17.1.3.5.1. Marketing Strategy

        17.1.4. Zoho CRM

            17.1.4.1. Overview

            17.1.4.2. Product Portfolio

            17.1.4.3. Profitability by Market Segments

            17.1.4.4. Sales Footprint

            17.1.4.5. Strategy Overview

                17.1.4.5.1. Marketing Strategy

        17.1.5. Zendesk Sell

            17.1.5.1. Overview

            17.1.5.2. Product Portfolio

            17.1.5.3. Profitability by Market Segments

            17.1.5.4. Sales Footprint

            17.1.5.5. Strategy Overview

                17.1.5.5.1. Marketing Strategy

        17.1.6. ClickUp

            17.1.6.1. Overview

            17.1.6.2. Product Portfolio

            17.1.6.3. Profitability by Market Segments

            17.1.6.4. Sales Footprint

            17.1.6.5. Strategy Overview

                17.1.6.5.1. Marketing Strategy

        17.1.7. Durable

            17.1.7.1. Overview

            17.1.7.2. Product Portfolio

            17.1.7.3. Profitability by Market Segments

            17.1.7.4. Sales Footprint

            17.1.7.5. Strategy Overview

                17.1.7.5.1. Marketing Strategy

        17.1.8. C3.ai

            17.1.8.1. Overview

            17.1.8.2. Product Portfolio

            17.1.8.3. Profitability by Market Segments

            17.1.8.4. Sales Footprint

            17.1.8.5. Strategy Overview

                17.1.8.5.1. Marketing Strategy

        17.1.9. Salesforce Sales Cloud

            17.1.9.1. Overview

            17.1.9.2. Product Portfolio

            17.1.9.3. Profitability by Market Segments

            17.1.9.4. Sales Footprint

            17.1.9.5. Strategy Overview

                17.1.9.5.1. Marketing Strategy

        17.1.10. itransition

            17.1.10.1. Overview

            17.1.10.2. Product Portfolio

            17.1.10.3. Profitability by Market Segments

            17.1.10.4. Sales Footprint

            17.1.10.5. Strategy Overview

                17.1.10.5.1. Marketing Strategy

18. Assumptions & Acronyms Used

19. Research Methodology

List of Tables

Table 1: Global Market Value (US$ Million) Forecast by Region, 2019 to 2034

Table 2: Global Market Value (US$ Million) Forecast by Solution, 2019 to 2034

Table 3: Global Market Value (US$ Million) Forecast by Industry, 2019 to 2034

Table 4: North America Market Value (US$ Million) Forecast by Country, 2019 to 2034

Table 5: North America Market Value (US$ Million) Forecast by Solution, 2019 to 2034

Table 6: North America Market Value (US$ Million) Forecast by Industry, 2019 to 2034

Table 7: Latin America Market Value (US$ Million) Forecast by Country, 2019 to 2034

Table 8: Latin America Market Value (US$ Million) Forecast by Solution, 2019 to 2034

Table 9: Latin America Market Value (US$ Million) Forecast by Industry, 2019 to 2034

Table 10: Western Europe Market Value (US$ Million) Forecast by Country, 2019 to 2034

Table 11: Western Europe Market Value (US$ Million) Forecast by Solution, 2019 to 2034

Table 12: Western Europe Market Value (US$ Million) Forecast by Industry, 2019 to 2034

Table 13: Eastern Europe Market Value (US$ Million) Forecast by Country, 2019 to 2034

Table 14: Eastern Europe Market Value (US$ Million) Forecast by Solution, 2019 to 2034

Table 15: Eastern Europe Market Value (US$ Million) Forecast by Industry, 2019 to 2034

Table 16: South Asia and Pacific Market Value (US$ Million) Forecast by Country, 2019 to 2034

Table 17: South Asia and Pacific Market Value (US$ Million) Forecast by Solution, 2019 to 2034

Table 18: South Asia and Pacific Market Value (US$ Million) Forecast by Industry, 2019 to 2034

Table 19: East Asia Market Value (US$ Million) Forecast by Country, 2019 to 2034

Table 20: East Asia Market Value (US$ Million) Forecast by Solution, 2019 to 2034

Table 21: East Asia Market Value (US$ Million) Forecast by Industry, 2019 to 2034

Table 22: Middle East and Africa Market Value (US$ Million) Forecast by Country, 2019 to 2034

Table 23: Middle East and Africa Market Value (US$ Million) Forecast by Solution, 2019 to 2034

Table 24: Middle East and Africa Market Value (US$ Million) Forecast by Industry, 2019 to 2034

List of Charts

Figure 1: Global Market Value (US$ Million) by Solution, 2024 to 2034

Figure 2: Global Market Value (US$ Million) by Industry, 2024 to 2034

Figure 3: Global Market Value (US$ Million) by Region, 2024 to 2034

Figure 4: Global Market Value (US$ Million) Analysis by Region, 2019 to 2034

Figure 5: Global Market Value Share (%) and BPS Analysis by Region, 2024 to 2034

Figure 6: Global Market Y-o-Y Growth (%) Projections by Region, 2024 to 2034

Figure 7: Global Market Value (US$ Million) Analysis by Solution, 2019 to 2034

Figure 8: Global Market Value Share (%) and BPS Analysis by Solution, 2024 to 2034

Figure 9: Global Market Y-o-Y Growth (%) Projections by Solution, 2024 to 2034

Figure 10: Global Market Value (US$ Million) Analysis by Industry, 2019 to 2034

Figure 11: Global Market Value Share (%) and BPS Analysis by Industry, 2024 to 2034

Figure 12: Global Market Y-o-Y Growth (%) Projections by Industry, 2024 to 2034

Figure 13: Global Market Attractiveness by Solution, 2024 to 2034

Figure 14: Global Market Attractiveness by Industry, 2024 to 2034

Figure 15: Global Market Attractiveness by Region, 2024 to 2034

Figure 16: North America Market Value (US$ Million) by Solution, 2024 to 2034

Figure 17: North America Market Value (US$ Million) by Industry, 2024 to 2034

Figure 18: North America Market Value (US$ Million) by Country, 2024 to 2034

Figure 19: North America Market Value (US$ Million) Analysis by Country, 2019 to 2034

Figure 20: North America Market Value Share (%) and BPS Analysis by Country, 2024 to 2034

Figure 21: North America Market Y-o-Y Growth (%) Projections by Country, 2024 to 2034

Figure 22: North America Market Value (US$ Million) Analysis by Solution, 2019 to 2034

Figure 23: North America Market Value Share (%) and BPS Analysis by Solution, 2024 to 2034

Figure 24: North America Market Y-o-Y Growth (%) Projections by Solution, 2024 to 2034

Figure 25: North America Market Value (US$ Million) Analysis by Industry, 2019 to 2034

Figure 26: North America Market Value Share (%) and BPS Analysis by Industry, 2024 to 2034

Figure 27: North America Market Y-o-Y Growth (%) Projections by Industry, 2024 to 2034

Figure 28: North America Market Attractiveness by Solution, 2024 to 2034

Figure 29: North America Market Attractiveness by Industry, 2024 to 2034

Figure 30: North America Market Attractiveness by Country, 2024 to 2034

Figure 31: Latin America Market Value (US$ Million) by Solution, 2024 to 2034

Figure 32: Latin America Market Value (US$ Million) by Industry, 2024 to 2034

Figure 33: Latin America Market Value (US$ Million) by Country, 2024 to 2034

Figure 34: Latin America Market Value (US$ Million) Analysis by Country, 2019 to 2034

Figure 35: Latin America Market Value Share (%) and BPS Analysis by Country, 2024 to 2034

Figure 36: Latin America Market Y-o-Y Growth (%) Projections by Country, 2024 to 2034

Figure 37: Latin America Market Value (US$ Million) Analysis by Solution, 2019 to 2034

Figure 38: Latin America Market Value Share (%) and BPS Analysis by Solution, 2024 to 2034

Figure 39: Latin America Market Y-o-Y Growth (%) Projections by Solution, 2024 to 2034

Figure 40: Latin America Market Value (US$ Million) Analysis by Industry, 2019 to 2034

Figure 41: Latin America Market Value Share (%) and BPS Analysis by Industry, 2024 to 2034

Figure 42: Latin America Market Y-o-Y Growth (%) Projections by Industry, 2024 to 2034

Figure 43: Latin America Market Attractiveness by Solution, 2024 to 2034

Figure 44: Latin America Market Attractiveness by Industry, 2024 to 2034

Figure 45: Latin America Market Attractiveness by Country, 2024 to 2034

Figure 46: Western Europe Market Value (US$ Million) by Solution, 2024 to 2034

Figure 47: Western Europe Market Value (US$ Million) by Industry, 2024 to 2034

Figure 48: Western Europe Market Value (US$ Million) by Country, 2024 to 2034

Figure 49: Western Europe Market Value (US$ Million) Analysis by Country, 2019 to 2034

Figure 50: Western Europe Market Value Share (%) and BPS Analysis by Country, 2024 to 2034

Figure 51: Western Europe Market Y-o-Y Growth (%) Projections by Country, 2024 to 2034

Figure 52: Western Europe Market Value (US$ Million) Analysis by Solution, 2019 to 2034

Figure 53: Western Europe Market Value Share (%) and BPS Analysis by Solution, 2024 to 2034

Figure 54: Western Europe Market Y-o-Y Growth (%) Projections by Solution, 2024 to 2034

Figure 55: Western Europe Market Value (US$ Million) Analysis by Industry, 2019 to 2034

Figure 56: Western Europe Market Value Share (%) and BPS Analysis by Industry, 2024 to 2034

Figure 57: Western Europe Market Y-o-Y Growth (%) Projections by Industry, 2024 to 2034

Figure 58: Western Europe Market Attractiveness by Solution, 2024 to 2034

Figure 59: Western Europe Market Attractiveness by Industry, 2024 to 2034

Figure 60: Western Europe Market Attractiveness by Country, 2024 to 2034

Figure 61: Eastern Europe Market Value (US$ Million) by Solution, 2024 to 2034

Figure 62: Eastern Europe Market Value (US$ Million) by Industry, 2024 to 2034

Figure 63: Eastern Europe Market Value (US$ Million) by Country, 2024 to 2034

Figure 64: Eastern Europe Market Value (US$ Million) Analysis by Country, 2019 to 2034

Figure 65: Eastern Europe Market Value Share (%) and BPS Analysis by Country, 2024 to 2034

Figure 66: Eastern Europe Market Y-o-Y Growth (%) Projections by Country, 2024 to 2034

Figure 67: Eastern Europe Market Value (US$ Million) Analysis by Solution, 2019 to 2034

Figure 68: Eastern Europe Market Value Share (%) and BPS Analysis by Solution, 2024 to 2034

Figure 69: Eastern Europe Market Y-o-Y Growth (%) Projections by Solution, 2024 to 2034

Figure 70: Eastern Europe Market Value (US$ Million) Analysis by Industry, 2019 to 2034

Figure 71: Eastern Europe Market Value Share (%) and BPS Analysis by Industry, 2024 to 2034

Figure 72: Eastern Europe Market Y-o-Y Growth (%) Projections by Industry, 2024 to 2034

Figure 73: Eastern Europe Market Attractiveness by Solution, 2024 to 2034

Figure 74: Eastern Europe Market Attractiveness by Industry, 2024 to 2034

Figure 75: Eastern Europe Market Attractiveness by Country, 2024 to 2034

Figure 76: South Asia and Pacific Market Value (US$ Million) by Solution, 2024 to 2034

Figure 77: South Asia and Pacific Market Value (US$ Million) by Industry, 2024 to 2034

Figure 78: South Asia and Pacific Market Value (US$ Million) by Country, 2024 to 2034

Figure 79: South Asia and Pacific Market Value (US$ Million) Analysis by Country, 2019 to 2034

Figure 80: South Asia and Pacific Market Value Share (%) and BPS Analysis by Country, 2024 to 2034

Figure 81: South Asia and Pacific Market Y-o-Y Growth (%) Projections by Country, 2024 to 2034

Figure 82: South Asia and Pacific Market Value (US$ Million) Analysis by Solution, 2019 to 2034

Figure 83: South Asia and Pacific Market Value Share (%) and BPS Analysis by Solution, 2024 to 2034

Figure 84: South Asia and Pacific Market Y-o-Y Growth (%) Projections by Solution, 2024 to 2034

Figure 85: South Asia and Pacific Market Value (US$ Million) Analysis by Industry, 2019 to 2034

Figure 86: South Asia and Pacific Market Value Share (%) and BPS Analysis by Industry, 2024 to 2034

Figure 87: South Asia and Pacific Market Y-o-Y Growth (%) Projections by Industry, 2024 to 2034

Figure 88: South Asia and Pacific Market Attractiveness by Solution, 2024 to 2034

Figure 89: South Asia and Pacific Market Attractiveness by Industry, 2024 to 2034

Figure 90: South Asia and Pacific Market Attractiveness by Country, 2024 to 2034

Figure 91: East Asia Market Value (US$ Million) by Solution, 2024 to 2034

Figure 92: East Asia Market Value (US$ Million) by Industry, 2024 to 2034

Figure 93: East Asia Market Value (US$ Million) by Country, 2024 to 2034

Figure 94: East Asia Market Value (US$ Million) Analysis by Country, 2019 to 2034

Figure 95: East Asia Market Value Share (%) and BPS Analysis by Country, 2024 to 2034

Figure 96: East Asia Market Y-o-Y Growth (%) Projections by Country, 2024 to 2034

Figure 97: East Asia Market Value (US$ Million) Analysis by Solution, 2019 to 2034

Figure 98: East Asia Market Value Share (%) and BPS Analysis by Solution, 2024 to 2034

Figure 99: East Asia Market Y-o-Y Growth (%) Projections by Solution, 2024 to 2034

Figure 100: East Asia Market Value (US$ Million) Analysis by Industry, 2019 to 2034

Figure 101: East Asia Market Value Share (%) and BPS Analysis by Industry, 2024 to 2034

Figure 102: East Asia Market Y-o-Y Growth (%) Projections by Industry, 2024 to 2034

Figure 103: East Asia Market Attractiveness by Solution, 2024 to 2034

Figure 104: East Asia Market Attractiveness by Industry, 2024 to 2034

Figure 105: East Asia Market Attractiveness by Country, 2024 to 2034

Figure 106: Middle East and Africa Market Value (US$ Million) by Solution, 2024 to 2034

Figure 107: Middle East and Africa Market Value (US$ Million) by Industry, 2024 to 2034

Figure 108: Middle East and Africa Market Value (US$ Million) by Country, 2024 to 2034

Figure 109: Middle East and Africa Market Value (US$ Million) Analysis by Country, 2019 to 2034

Figure 110: Middle East and Africa Market Value Share (%) and BPS Analysis by Country, 2024 to 2034

Figure 111: Middle East and Africa Market Y-o-Y Growth (%) Projections by Country, 2024 to 2034

Figure 112: Middle East and Africa Market Value (US$ Million) Analysis by Solution, 2019 to 2034

Figure 113: Middle East and Africa Market Value Share (%) and BPS Analysis by Solution, 2024 to 2034

Figure 114: Middle East and Africa Market Y-o-Y Growth (%) Projections by Solution, 2024 to 2034

Figure 115: Middle East and Africa Market Value (US$ Million) Analysis by Industry, 2019 to 2034

Figure 116: Middle East and Africa Market Value Share (%) and BPS Analysis by Industry, 2024 to 2034

Figure 117: Middle East and Africa Market Y-o-Y Growth (%) Projections by Industry, 2024 to 2034

Figure 118: Middle East and Africa Market Attractiveness by Solution, 2024 to 2034

Figure 119: Middle East and Africa Market Attractiveness by Industry, 2024 to 2034

Figure 120: Middle East and Africa Market Attractiveness by Country, 2024 to 2034

Recommendations

Technology

AI-Powered Storage Market

Published : August 2023

Technology

Personal CRM Market

Published : July 2023

Technology

Salesforce CRM Document Generation Software Market

Published : May 2022

Technology

CRM Application Software Market

Published : September 2017

Explore Technology Insights

View Reports

AI-Powered CRM Platform Market