3D Printing Dental Devices Market Size and Share Forecast Outlook 2025 to 2035

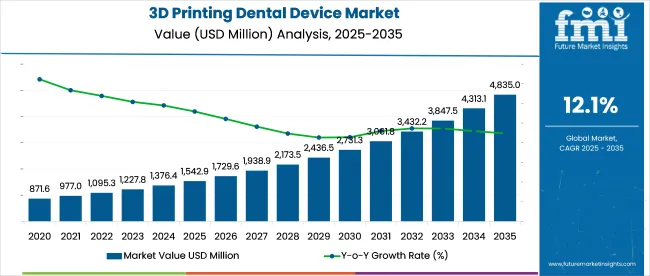
The global 3D Printing Dental Devices Market is estimated to be valued at USD 1,542.9 million in 2025 and is projected to reach USD 4,835.0 million by 2035, registering a compound annual growth rate of 12.1% over the forecast period.
Quick Stats for 3D Printing Dental Devices Market

  • Industry Value (2025):  USD 1,542.9 million
  • Forecast Value (2035): USD 4,835.0 million
  • Forecast CAGR: 12.1%
  • Leading Segment in 2025: 3D Printing Materials
  • Key Growth Region: India (13.2% CAGR), China (12.5% CAGR), Germany (11.9% CAGR)
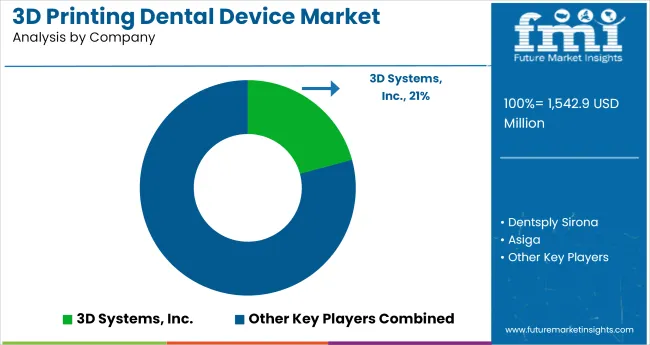
  • Top Key Players: 3D Systems, Inc., Dentsply Sirona, Asiga, Carbon, Inc., Desktop Metal, Inc., Garreco, LLC, GC America, Inc., Kulzer GmbH, PioCreat 3D Technology Co., Ltd, Pac-Dent, Inc.

3D Printing Dental Devices Market

The 3D printing dental devices market is evolving rapidly due to rising demand for personalized, precise dental solutions and the shift toward digital dentistry. Key growth drivers include technological innovation, such as AI-integrated design software and biocompatible materials, which are enhancing efficiency, accuracy, and patient outcomes.

The aging population and increasing cases of dental disorders are further amplifying the need for customized dental prosthetics and implants. Additionally, the market is benefiting from strong collaboration between dental labs, clinics, and tech providers, leading to the creation of integrated digital dental ecosystems. This shift is streamlining production, reducing waste, and enabling faster turnaround times making the industry more responsive and cost-effective while paving the way for sustained future growth.

Analyzing 3D Printing Dental Devices Market by Top Investment Segments

3D Printing Materials Lead the Market Due to Rising Demand for Personalized and Biocompatible Dental Solutions

The segment of 3D printing materials has been positioned as the leading category in 2025, accounting for an estimated 50.30% revenue share. This dominance is being driven by the expanding need for biocompatible, high-precision materials that support the development of tailored dental solutions. The adoption of advanced materials such as photopolymer resins, biocomposites, and titanium alloys has been prioritized to meet aesthetic, mechanical, and safety requirements across prosthodontic and orthodontic applications.

In recent years, material innovation has been accelerated by R&D activities led by dental OEMs and specialty resin producers. Moreover, the increasing integration of multi-material workflows within CAD/CAM environments has enabled seamless, high-throughput production. Clinical preference for resin-based models for surgical guides and aligners has further strengthened this segment’s commercial viability. Additionally, regulatory approvals of dental-specific resin classes by authorities such as the FDA and CE Mark have built confidence among practitioners and manufacturers, accelerating material consumption.

Prosthodontic Applications Dominate Owing to Increasing Demand for Crowns, Bridges, and Dentures in Aging Populations

The prosthodontics segment has emerged as the largest application category in 2025, capturing a 35.30% revenue share in the global 3D printing dental devices market. This leadership has been supported by the rising incidence of tooth loss and dental decay, particularly among aging and geriatric demographics in North America, Europe, and parts of East Asia. Demand for crowns, bridges, veneers, and denture frameworks has surged due to their essential role in functional and aesthetic dental rehabilitation.

Precision-fit restoration enabled through 3D-printed prosthodontics has reduced turnaround times and manual effort in dental laboratories. Additionally, dental service providers have preferred digital workflows to eliminate the need for physical impressions, thereby improving patient comfort and chairside efficiency. The adoption of CAD-based modeling software and automated production techniques has facilitated the expansion of this segment. High acceptance rates among dentists, coupled with scalable production capabilities, have further ensured the strong position of prosthodontic applications within the market landscape.
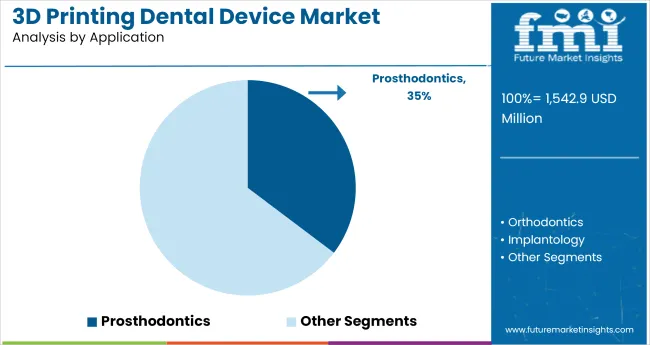
3d Printing Dental Device Market Analysis By Application

Dental Laboratories Hold the Largest Share Due to Centralized Production and Workflow Integration

The dental laboratories channel has been identified as the dominant sales route in 2025, holding a 32% revenue share. This leadership has been attributed to the centralized nature of production across most countries, where laboratories serve as hubs for precision-based manufacturing of prosthetics, aligners, and implants. Dental labs have increasingly integrated 3D printing systems to streamline production and reduce dependency on traditional casting and milling processes. Investments in automation, digital scanning, and CAM technologies have enabled high-volume output and faster turnaround.

Furthermore, dental labs offer flexibility in accommodating various printer types and materials, making them ideal for multi-application use. The ability to process diverse patient orders from multiple clinics at scale has positioned labs as essential service partners. Additionally, regulatory and compliance support offered by certified labs has been instrumental in assuring end-use quality, particularly for personalized prosthodontics and Implantology.
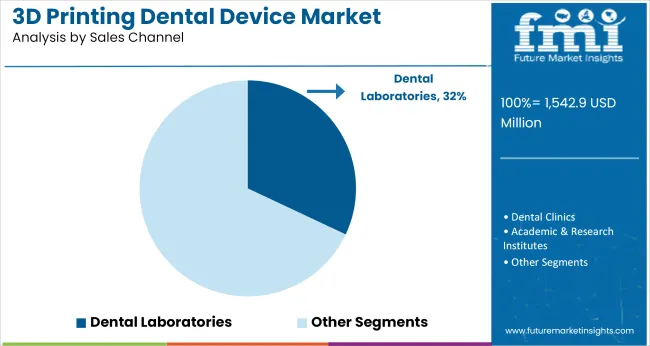
3d Printing Dental Device Market Analysis By Sales Channel

Challenges, Opportunities, and Trends

Challenges

Challenges Impacting the Growth of the 3D Printing Dental Devices Market

The 3D printing dental devices market faces challenges such as high costs of advanced dental 3D printers, regulatory hurdles in obtaining approvals for patient-specific devices, and risks of material degradation in long-term dental restorations. The need for improved printing speed and precision in dental manufacturing, challenges in ensuring long-term biocompatibility of printed dental prosthetics, and disparities in access to 3D printing technologies across different regions create barriers to market expansion.

Additionally, challenges in integrating AI-powered dental treatment planning into routine practice, high costs associated with training dental professionals on 3D printing techniques, and resistance to transitioning from traditional dental fabrication methods to 3D-printed alternatives impact market growth.

Opportunities

Advancements and Innovations Driving Growth in the 3D Printing Dental Devices Market

The increasing adoption of AI-powered dental implant design optimization, expansion of bioresorbable and patient-specific dental prosthetics, and rising investment in hybrid 3D printing techniques present significant growth opportunities in the market. The development of smart dental implants with embedded sensors for real-time monitoring, increasing focus on integrating 3D-printed solutions with digital orthodontics, and expansion of bioprinting applications for tissue regeneration are fueling market growth.

Additionally, increasing research into bioactive coatings for 3D-printed dental implants, expansion of digital dentistry manufacturing hubs, and growing collaborations between academic institutions and dental device manufacturers for optimizing implant performance are expected to create new avenues for industry expansion. The rise of cost-efficient 3D printing technologies and increasing consumer preference for minimally invasive, highly customized dental solutions are further enhancing accessibility and long-term market potential.

Emerging Trends

The rising adoption of hybrid and biocompatible implant materials is expanding market opportunities in full-mouth reconstructions, pediatric dentistry, and digital orthodontics. Governments and healthcare agencies are expanding support for medical 3D printing research, streamlining approval pathways for patient-specific dental implants, and implementing policies to improve accessibility of advanced dental solutions.

Country Wise Analysis

USA

Market Outlook

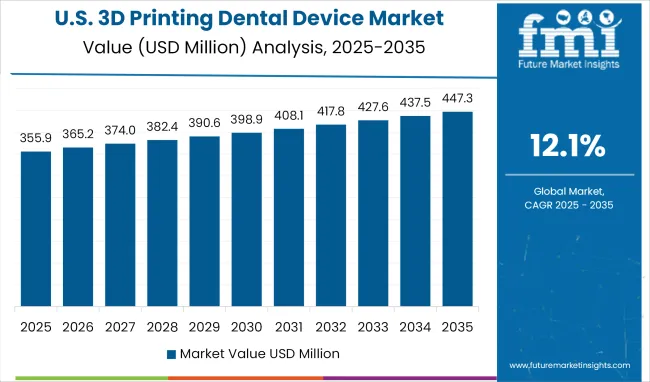
The adoption of cutting-edge dental technology, a large number of dental labs, and the rising need for individualized dental care have put the USA at the forefront of the 3D printing dental device industry. The growing usage of additive manufacturing for dental implants, crowns, bridges, and aligners is helping the market. Additionally, dental prosthetics are becoming more accurate and efficient thanks to the incorporation of AI and digital scanning technology is driving the market.

Market Growth Factors
  • Rise in Cosmetic & Restorative Dentistry: Growing aesthetic awareness and demand for customized dental restorations are fueling market expansion.
  • Adoption of AI & Digital Dentistry: AI-assisted 3D printing and intraoral scanners are enhancing precision and workflow efficiency.
  • Expanding Dental Laboratory Networks: The presence of high-tech dental labs and CAD/CAM adoption is driving demand.
  • Favorable Insurance & Reimbursement Policies: Coverage for dental prosthetics is improving accessibility to advanced solutions.
  • Growing Popularity of Clear Aligners: 3D printing is revolutionizing orthodontics with cost-effective, customized aligners.

Us 3d Printing Dental Device Market Value Analysis 2025 To 2035

Market Forecast

Country CAGR (2025 to 2035)
United States 11.4%

UK

Market Outlook

The United Kingdom is experiencing significant growth in the 3D printing dental devices market due to increasing adoption of digital dentistry, NHS funding for dental restorations, and the rise in private dental clinics offering high-end solutions. The country’s strong regulatory framework and focus on sustainable materials in 3D printing are also shaping market trends.

Market Growth Factors

  • Expansion of Digital Dental Clinics: More clinics are investing in CAD/CAM and 3D printing for efficient patient care.
  • NHS Support for Dental Restorations: Government-funded dental programs are boosting demand for 3D-printed dental solutions.
  • Growing Awareness of Aesthetic Dentistry: The demand for cosmetic dental treatments, including custom crowns and veneers, is rising.
  • Sustainability & Eco-Friendly Materials: The UK is promoting the use of biodegradable and sustainable 3D printing materials.
  • Increasing Adoption of Clear Aligners & Retainers: More patients are opting for digitally printed orthodontic solutions.

Market Forecast

Country CAGR (2025 to 2035)
UK 10.3%

India

Market Outlook

India's 3D printing dental devices market is growing fast with the rise in the number of dental clinics, medical tourism, and the affordability of 3D printing technologies. Although conventional dental prosthetics are still used on a large scale, the transition to digital dentistry is gaining traction, especially in urban centers where advanced dental care is available.

Market Growth Factors

  • Rising Demand for Affordable Dental Solutions: 3D printing is making dental restorations more cost-effective and accessible.
  • Growth in Dental Tourism: International patients seek advanced yet affordable dental care in India.
  • Expansion of Private Dental Clinics: The number of specialized dental clinics offering digital dentistry is increasing.
  • Adoption of In-House 3D Printing in Clinics: More dentists are integrating 3D printers for on-demand restorations.
  • Government Initiatives in Healthcare Innovation: India is investing in advanced medical technology, boosting 3D printing adoption.

Market Forecast

Country CAGR (2025 to 2035)
India 13.2%

Germany

Market Outlook

Germany is a leader in the 3D printing dental devices market due to its strong dental industry, advanced research in dental biomaterials, and high adoption of CAD/CAM systems. The country’s focus on precision engineering and high-quality dental prosthetics is driving demand for digitally printed dental implants and restorations.

Market Growth Drivers

  • Strong Research & Development in Dental Biomaterials: Germany is a global innovator in biocompatible dental materials for 3D printing.
  • High Adoption of Digital Dental Labs: German dental laboratories are equipped with state-of-the-art CAD/CAM and 3D printing technology.
  • Premium Quality Dental Care & Customization: The demand for high-precision, patient-specific dental solutions is increasing.
  • Growing Elderly Population & Need for Implants: The aging demographic is fueling demand for 3D-printed dentures and implants.
  • Regulatory Support for Digital Dentistry: Germany’s medical device regulations encourage innovation and quality control.

Market Forecast

Country CAGR (2025 to 2035)
Germany 11.9%

China

Market Outlook

China’s 3D printing dental devices market is growing rapidly due to the expansion of dental healthcare services, rising disposable incomes, and strong domestic manufacturing capabilities. The country is becoming a major producer of affordable 3D-printed dental products, making digital dentistry more accessible.

Market Growth Drivers

  • Government Investment in Digital Healthcare: China is promoting the adoption of 3D printing in medical and dental applications.
  • Rise of Domestic Dental 3D Printing Companies: Local firms are producing cost-effective, high-quality dental devices.
  • Growing Middle-Class Demand for Aesthetic Dentistry: More consumers are seeking advanced dental care, including customized crowns and veneers.
  • Integration of AI & 3D Printing in Dental Clinics: Smart dentistry solutions are improving treatment efficiency and precision.
  • Expansion of E-commerce & Online Dental Services: Patients can now access customized dental solutions through digital platforms.

Market Forecast

Country CAGR (2025 to 2035)
China 12.5%

Competition Outlook

3d Printing Dental Device Market Analysis By Company

The 3D printing dental devices market is witnessing robust competition, fueled by advancements in printer technology, material science, and digital workflow integration. Companies are heavily investing in R&D to develop high-precision printers and biocompatible materials that cater to customized dental solutions.

Strategic partnerships with dental laboratories, service organizations, and tech startups are being leveraged to expand production capabilities and clinical reach. Additionally, efforts are focused on integrating AI-driven design tools and cloud-based platforms to enhance automation and reduce operational costs. Mergers and acquisitions are also shaping the competitive landscape, allowing players to broaden their product portfolios and enter new markets. This innovation-driven competition is enhancing efficiency, accuracy, and accessibility, thereby accelerating market growth globally.

Key Development:

  • In 2025, 3D Systems announced new dental 3D printing solutions showcased at LMT Lab Day 2025. This includes the NextDent® Jetted Denture Solution with the NextDent® 300 MultiJet 3D printer for rapid, multi-material monolithic dentures. They also previewed future solutions for night guards (late 2025) and direct-printed aligners.
  • In 2025, SprintRay unveiled new digital dentistry expansions at IDS 2025. This includes the European launch of the Midas Digital Press 3D printer, which uses Digital Press Stereolithography (DPS) and capsule-based resins for ultra-fast, single-visit restorations. They also expanded their Digital Print line with the Pro 2 Duo Kit (dual-resin printing), SportsGuard Resin, and Direct Print Retainer Resin (Q3 2025 launch), enhancing speed and multi-material workflows for dental professionals. A new strategic partnership with Straumann Group will also bring a co-branded "Straumann Signature Midas by SprintRay" printer.

Key Players

  • 3D Systems, Inc.
  • Dentsply Sirona
  • Asiga
  • Carbon, Inc.
  • Desktop Metal, Inc.
  • Garreco, LLC
  • GC America, Inc
  • Kulzer GmbH
  • PioCreat 3D Technology Co., Ltd
  • Pac-Dent, Inc
  • Zirlux (Henry Schein, Inc.)
  • Whip Mix
  • VITA Zahnfabrik
  • VOCO GmbH
  • Myerson LLC
  • TopCore Dental Resin
  • NextDent
  • DMG DentaMile
  • UNIZ TECHNOLOGY LLC
  • Chengdu Besmile Biotechnology Co., Ltd.
  • Ackuretta
  • PowerResinsGlobal
  • BEGO GmbH & Co. KG
  • Dreve group
  • GC Dental

Key Segments

By Products:

  • Dental 3D Printers
    • Stereolithography (SLA) Printers
    • LCD (Masked SLA/MSLA) Printers
    • Digital Light Processing (DLP) Printers
    • Selective Laser Sintering (SLS) Printers
    • Direct Metal Laser Sintering (DMLS) / Selective Laser Melting (SLM)
    • Fused Deposition Modeling (FDM) Printers
    • Inkjet Printers
    • Multi-phase Jet Solidification Printers
    • Others Printer Types
  • 3D Printing Materials
    • Dental Resins
      • Photopolymer Resins
      • Biocomposite Resins
      • Castable Resins
      • Transparent Resins
    • Metals
      • Titanium (Ti) Alloys
      • Cobalt-chromium (Co-Cr)
      • Stainless Steel
      • Precious Metal Alloys
    • Ceramics
      • Glass
      • Zirconia
      • Alumina
    • Others
      • Thermoplastics
      • Composites
  • Services

By Application:

  • Prosthodontics
    • Crowns, Bridges & Veneers
    • Denture Frameworks
    • Try-In Denture Models
  • Orthodontics
    • Clear Aligner Moulds
    • Retainers
    • Impression Trays
    • Diagnostic Orthodontic Models
  • Implantology
    • Implant Surgical Guides
    • Implant Abutments
    • Bone Grafting Scaffolds
    • Gum Tissue Simulation Models
  • Restorative Dentistry
    • Dental Restoration
    • Night Guards and Mouth Guards
  • Others

By Sales Channel:

  • Dental Laboratories
  • Dental Clinics
  • Academic & Research Institutes
  • Hospitals
  • DSOs (Dental Service Organizations)
  • Dental 3D Printing Service Providers

By Region:

  • North America
  • Latin America
  • East Asia
  • South Asia & Pacific
  • Western Europe
  • Eastern Europe
  • Middle East & Africa

Table of Content

  1. Executive Summary
  2. Industry Introduction, including Taxonomy and Market Definition
  3. Market Trends and Success Factors, including Macro-economic Factors, Market Dynamics, and Recent Industry Developments
  4. Global Market Demand Analysis 2020 to 2024 and Forecast 2025 to 2035, including Historical Analysis and Future Projections
  5. Global Market Analysis 2020 to 2024 and Forecast 2025 to 2035
    • By Product Type
    • By Application
    • By Sales Channel
    • By Region
  6. Global Market Analysis 2020 to 2024 and Forecast 2025 to 2035, By Product Type
    • Dental 3D Printers
    • 3D Printing Materials
    • Services
  7. Global Market Analysis 2020 to 2024 and Forecast 2025 to 2035, By Application
    • Prosthodontics
      • Crowns, Bridges & Veneers
      • Denture Frameworks
      • Try-In Denture Models
    • Orthodontics
      • Clear Aligner Moulds
      • Retainers
      • Impression Trays
      • Diagnostic Orthodontic Models
    • Implantology
      • Implant Surgical Guides
      • Implant Abutments
      • Bone Grafting Scaffolds
      • Gum Tissue Simulation Models
    • Restorative Dentistry
      • Dental Restoration
      • Night Guards and Mouth Guards
    • Others
  8. Global Market Analysis 2020 to 2024 and Forecast 2025 to 2035, By Sales Channel
    • Dental Laboratories
    • Dental Clinics
    • Academic & Research Institutes
    • Hospitals
    • DSOs (Dental Service Organizations)
    • Dental 3D Printing Service Providers
  9. Global Market Analysis 2020 to 2024 and Forecast 2025 to 2035, By Region
    • North America
    • Latin America
    • East Asia
    • South Asia and Pacific
    • Western Europe
    • Eastern Europe
    • Middle East and Africa
  10. North America Sales Analysis 2020 to 2024 and Forecast 2025 to 2035, by Key Segments and Countries
  11. Latin America Sales Analysis 2020 to 2024 and Forecast 2025 to 2035, by Key Segments and Countries
  12. East Asia Sales Analysis 2020 to 2024 and Forecast 2025 to 2035, by Key Segments and Countries
  13. South Asia & Pacific Sales Analysis 2020 to 2024 and Forecast 2025 to 2035, by Key Segments and Countries
  14. Western Europe Sales Analysis 2020 to 2024 and Forecast 2025 to 2035, by Key Segments and Countries
  15. Eastern Europe Sales Analysis 2020 to 2024 and Forecast 2025 to 2035, by Key Segments and Countries
  16. Middle East and Africa Sales Analysis 2020 to 2024 and Forecast 2025 to 2035, by Key Segments and Countries
  17. Sales Forecast 2025 to 2035 by Product Type, by Material, by Technology for 30 Countries
  18. Competition Outlook, including Market Structure Analysis, Company Share Analysis by Key Players, and Competition Dashboard
  19. Company Profile
    • 3D Systems
    • SprintRay
    • Ackuretta
    • Asiga
    • Renishaw
    • Formlabs Inc. (USA)
    • Sterngold Dental LLC
    • Desktop Metal
    • Institut Straumann Group
    • Stratasys Ltd
    • Höganäs AB
    • Eplus3D Tech Co., Ltd
    • Bego USA, Inc.
    • Dentsply Sirona Inc.
    • SLM Solutions
    • Others

List of Tables

  • Table 01: Global Market Value (USD Million) Analysis and Forecast 2020 to 2035, By Region
  • Table 02: Global Market Value (USD Million) Analysis and Forecast 2020 to 2035, By Component
  • Table 03: Global Market Volume (Units) Analysis and Forecast 2020 to 2035, By Component
  • Table 04: North America Market Value (USD Million) Analysis 2020 to 2035 and Forecast 2025 to 2035, By Country
  • Table 05: North America Market Value (USD Million) Analysis and Forecast 2020 to 2035, By Component
  • Table 06: North America Market Volume (Units) Analysis and Forecast 2020 to 2035, By Component
  • Table 07: Latin America Market Value (USD Million) Analysis 2020 to 2035 and Forecast 2025 to 2035, By Country
  • Table 8: Latin America Market Value (USD Million) Analysis and Forecast 2020 to 2035, By Component
  • Table 9: Latin America Market Volume (Units) Analysis and Forecast 2020 to 2035, By Component
  • Table 10: Europe Market Value (USD Million) Analysis 2020 to 2035 and Forecast 2025 to 2035, By Country
  • Table 11: Europe Market Value (USD Million) Analysis and Forecast 2020 to 2035, By Component
  • Table 12: Europe Market Volume (Units) Analysis and Forecast 2020 to 2035, By Component
  • Table 13: South Asia Market Value (USD Million) Analysis 2020 to 2035 and Forecast 2025 to 2035, By Country
  • Table 14: South Asia Market Value (USD Million) Analysis and Forecast 2020 to 2035, By Component
  • Table 15: South Asia Market Volume (Units) Analysis and Forecast 2020 to 2035, By Component
  • Table 16: East Asia Market Value (USD Million) Analysis 2020 to 2035 and Forecast 2025 to 2035, By Country
  • Table 17: East Asia Market Value (USD Million) Analysis and Forecast 2020 to 2035, By Component
  • Table 18: East Asia Market Volume (Units) Analysis and Forecast 2020 to 2035, By Component
  • Table 19: Oceania Market Value (USD Million) Analysis 2020 to 2035 and Forecast 2025 to 2035, By Country
  • Table 20: Oceania Market Value (USD Million) Analysis and Forecast 2020 to 2035, By Component
  • Table 21: Oceania Market Volume (Units) Analysis and Forecast 2020 to 2035, By Component
  • Table 22: Middle East and Africa Market Value (USD Million) Analysis 2020 to 2035 and Forecast 2025 to 2035, By Country
  • Table 23: Middle East and Africa Market Value (USD Million) Analysis and Forecast 2020 to 2035, By Component
  • Table 24: Middle East and Africa Market Volume (Units) Analysis and Forecast 2020 to 2035, By Component

List of Figures

  • Figure 01: Global Market Volume (Units), 2020 to 2035
  • Figure 02: Global Market Volume (Units) & Y-O-Y Growth (%) Analysis, 2025 to 2035
  • Figure 03: Market, Pricing Analysis Per Unit (USD), In 2024
  • Figure 04: Market, Pricing Forecast Per Unit (USD), In 2033
  • Figure 05: Global Market Value (USD Million) Analysis, 2020 to 2035
  • Figure 06: Global Market Forecast & Y-O-Y Growth, 2025 to 2035
  • Figure 07: Global Market Absolute $ Opportunity (USD Million) Analysis, 2025 to 2035
  • Figure 08: Global Market Value Share (%) Analysis 2025 and 2033, By Component
  • Figure 09: Global Market Y-O-Y Growth (%) Analysis 2025 to 2035, By Component
  • Figure 10: Global Market Attractiveness Analysis 2025 to 2035, By Component
  • Figure 11: Global Market Value Share (%) Analysis 2025 and 2033, By Region
  • Figure 12: Global Market Y-O-Y Growth (%) Analysis 2025 to 2035, By Region
  • Figure 13: Global Market Attractiveness Analysis 2025 to 2035, By Region
  • Figure 14: North America Market Value (USD Million) Analysis, 2020 to 2035
  • Figure 15: North America Market Value (USD Million) Forecast, 2025 to 2035
  • Figure 16: North America Market Value Share, By Component (2025 E)
  • Figure 17: North America Market Value Share, By Country (2025 E)
  • Figure 18: North America Market Attractiveness Analysis By Component, 2025 to 2035
  • Figure 19: North America Market Attractiveness Analysis By Country, 2025 to 2035
  • Figure 20: USA Market Value Proportion Analysis, 2025
  • Figure 21: Global Vs. USA Growth Comparison, 2025 to 2035
  • Figure 22: USA Market Share Analysis (%) By Component, 2025 & 2035
  • Figure 23: Canada Market Value Proportion Analysis, 2025
  • Figure 24: Global Vs. Canada. Growth Comparison, 2025 to 2035
  • Figure 25: Canada Market Share Analysis (%) By Component, 2025 & 2035
  • Figure 26: Latin America Market Value (USD Million) Analysis, 2020 to 2035
  • Figure 27: Latin America Market Value (USD Million) Forecast, 2025 to 2035
  • Figure 28: Latin America Market Value Share, By Component (2025 E)
  • Figure 29: Latin America Market Value Share, By Country (2025 E)
  • Figure 30: Latin America Market Attractiveness Analysis By Component, 2025 to 2035
  • Figure 31: Latin America Market Attractiveness Analysis By Country, 2025 to 2035
  • Figure 32: Mexico Market Value Proportion Analysis, 2025
  • Figure 33: Global Vs Mexico Growth Comparison, 2025 to 2035
  • Figure 34: Mexico Market Share Analysis (%) By Component, 2025 & 2035
  • Figure 35: Brazil Market Value Proportion Analysis, 2025
  • Figure 36: Global Vs. Brazil. Growth Comparison, 2025 to 2035
  • Figure 37: Brazil Market Share Analysis (%) By Component, 2025 & 2035
  • Figure 38: Argentina Market Value Proportion Analysis, 2025
  • Figure 39: Global Vs Argentina Growth Comparison, 2025 to 2035
  • Figure 40: Argentina Market Share Analysis (%) By Component, 2025 & 2035
  • Figure 41: Europe Market Value (USD Million) Analysis, 2020 to 2035
  • Figure 42: Europe Market Value (USD Million) Forecast, 2025 to 2035
  • Figure 43: Europe Market Value Share, By Component (2025 E)
  • Figure 44: Europe Market Value Share, By Country (2025 E)
  • Figure 45: Europe Market Attractiveness Analysis By Component, 2025 to 2035
  • Figure 46: Europe Market Attractiveness Analysis By Country, 2025 to 2035
  • Figure 47: UK Market Value Proportion Analysis, 2025
  • Figure 48: Global Vs. UK Growth Comparison, 2025 to 2035
  • Figure 49: UK Market Share Analysis (%) By Component, 2025 & 2035
  • Figure 50: Germany Market Value Proportion Analysis, 2025
  • Figure 51: Global Vs. Germany Growth Comparison, 2025 to 2035
  • Figure 52: Germany Market Share Analysis (%) By Component, 2025 & 2035
  • Figure 53: Italy Market Value Proportion Analysis, 2025
  • Figure 54: Global Vs. Italy Growth Comparison, 2025 to 2035
  • Figure 55: Italy Market Share Analysis (%) By Component, 2025 & 2035
  • Figure 56: France Market Value Proportion Analysis, 2025
  • Figure 57: Global Vs France Growth Comparison, 2025 to 2035
  • Figure 58: France Market Share Analysis (%) By Component, 2025 & 2035
  • Figure 59: Spain Market Value Proportion Analysis, 2025
  • Figure 60: Global Vs Spain Growth Comparison, 2025 to 2035
  • Figure 61: Spain Market Share Analysis (%) By Component, 2025 & 2035
  • Figure 62: Russia Market Value Proportion Analysis, 2025
  • Figure 63: Global Vs Russia Growth Comparison, 2025 to 2035
  • Figure 64: Russia Market Share Analysis (%) By Component, 2025 & 2035
  • Figure 65: Poland Market Value Proportion Analysis, 2025
  • Figure 66: Global Vs Russia Growth Comparison, 2025 to 2035
  • Figure 67: Poland Market Share Analysis (%) By Component, 2025 & 2035
  • Figure 68: Switzerland Market Value Proportion Analysis, 2025
  • Figure 69: Global Vs Switzerland Growth Comparison, 2025 to 2035
  • Figure 70: Switzerland Market Share Analysis (%) By Component, 2025 & 2035
  • Figure 71: Benelux Market Value Proportion Analysis, 2025
  • Figure 72: Global Vs Benelux Growth Comparison, 2025 to 2035
  • Figure 73: Benelux Market Share Analysis (%) By Component, 2025 & 2035
  • Figure 74: Nordic Market Value Proportion Analysis, 2025
  • Figure 75: Global Vs Nordic Growth Comparison, 2025 to 2035
  • Figure 76: Nordic Market Share Analysis (%) By Component, 2025 & 2035
  • Figure 77: East Asia Market Value (USD Million) Analysis, 2020 to 2035
  • Figure 78: East Asia Market Value (USD Million) Forecast, 2025 to 2035
  • Figure 79: East Asia Market Value Share, By Component (2025 E)
  • Figure 80: East Asia Market Value Share, By Country (2025 E)
  • Figure 81: East Asia Market Attractiveness Analysis By Component, 2025 to 2035
  • Figure 82: East Asia Market Attractiveness Analysis By Country, 2025 to 2035
  • Figure 83: China Market Value Proportion Analysis, 2025
  • Figure 84: Global Vs. China Growth Comparison, 2025 to 2035
  • Figure 85: China Market Share Analysis (%) By Component, 2025 & 2035
  • Figure 86: Japan Market Value Proportion Analysis, 2025
  • Figure 87: Global Vs. Japan Growth Comparison, 2025 to 2035
  • Figure 88: Japan Market Share Analysis (%) By Component, 2025 & 2035
  • Figure 89: South Korea Market Value Proportion Analysis, 2025
  • Figure 90: Global Vs South Korea Growth Comparison, 2025 to 2035
  • Figure 91: South Korea Market Share Analysis (%) By Component, 2025 & 2035
  • Figure 92: South Asia Market Value (USD Million) Analysis, 2020 to 2035
  • Figure 93: South Asia Market Value (USD Million) Forecast, 2025 to 2035
  • Figure 94: South Asia Market Value Share, By Component (2025 E)
  • Figure 95: South Asia Market Value Share, By Country (2025 E)
  • Figure 96: South Asia Market Attractiveness Analysis By Component, 2025 to 2035
  • Figure 97: South Asia Market Attractiveness Analysis By Country, 2025 to 2035
  • Figure 98: India Market Value Proportion Analysis, 2025
  • Figure 99: Global Vs. India Growth Comparison, 2025 to 2035
  • Figure 100: India Market Share Analysis (%) By Component, 2025 & 2035
  • Figure 101: Indonesia Market Value Proportion Analysis, 2025
  • Figure 102: Global Vs. Indonesia Growth Comparison, 2025 to 2035
  • Figure 103: Indonesia Market Share Analysis (%) By Component, 2025 & 2035
  • Figure 104: Malaysia Market Value Proportion Analysis, 2025
  • Figure 105: Global Vs. Malaysia Growth Comparison, 2025 to 2035
  • Figure 106: Malaysia Market Share Analysis (%) By Component, 2025 & 2035
  • Figure 107: Thailand Market Value Proportion Analysis, 2025
  • Figure 108: Global Vs. Thailand Growth Comparison, 2025 to 2035
  • Figure 109: Thailand Market Share Analysis (%) By Component, 2025 & 2035
  • Figure 110: Oceania Market Value (USD Million) Analysis, 2020 to 2035
  • Figure 111: Oceania Market Value (USD Million) Forecast, 2025 to 2035
  • Figure 112: Oceania Market Value Share, By Component (2025 E)
  • Figure 113: Oceania Market Value Share, By Country (2025 E)
  • Figure 114: Oceania Market Attractiveness Analysis By Component, 2025 to 2035
  • Figure 115: Oceania Market Attractiveness Analysis By Country, 2025 to 2035
  • Figure 116: Australia Market Value Proportion Analysis, 2025
  • Figure 117: Global Vs. Australia Growth Comparison, 2025 to 2035
  • Figure 118: Australia Market Share Analysis (%) By Component, 2025 & 2035
  • Figure 119: New Zealand Market Value Proportion Analysis, 2025
  • Figure 120: Global Vs New Zealand Growth Comparison, 2025 to 2035
  • Figure 121: New Zealand Market Share Analysis (%) By Component, 2025 & 2035
  • Figure 122: Middle East & Africa Market Value (USD Million) Analysis, 2020 to 2035
  • Figure 123: Middle East & Africa Market Value (USD Million) Forecast, 2025 to 2035
  • Figure 124: Middle East & Africa Market Value Share, By Component (2025 E)
  • Figure 125: Middle East & Africa Market Value Share, By Country (2025 E)
  • Figure 126: Middle East & Africa Market Attractiveness Analysis By Component, 2025 to 2035
  • Figure 127: Middle East & Africa Market Attractiveness Analysis By Country, 2025 to 2035
  • Figure 128: GCC Countries Market Value Proportion Analysis, 2025
  • Figure 129: Global Vs GCC Countries Growth Comparison, 2025 to 2035
  • Figure 130: GCC Countries Market Share Analysis (%) By Component, 2025 & 2035
  • Figure 131: Türkiye Market Value Proportion Analysis, 2025
  • Figure 132: Global Vs. Türkiye Growth Comparison, 2025 to 2035
  • Figure 133: Türkiye Market Share Analysis (%) By Component, 2025 & 2035
  • Figure 134: South Africa Market Value Proportion Analysis, 2025
  • Figure 135: Global Vs. South Africa Growth Comparison, 2025 to 2035
  • Figure 136: South Africa Market Share Analysis (%) By Component, 2025 & 2035
  • Figure 137: Northern Africa Market Value Proportion Analysis, 2025
  • Figure 138: Global Vs Northern Africa Growth Comparison, 2025 to 2035
  • Figure 139: Northern Africa Market Share Analysis (%) By Component, 2025 & 2035

Frequently Asked Questions

What was the overall size of the 3D Printing Dental Devices Market in 2025?

The overall market size for 3D Printing Dental Devices Market was USD 1,542.9 million in 2025.

How big is the 3D Printing Dental Devices Market expected in 2035?

The 3D Printing Dental Devices Market is expected to reach USD 4,835.0 million in 2035.

What will drive the demand for 3D Printing Dental Devices Market during the forecast period?

Increasing adoption of digital dentistry, technological advancements in 3d printing and rising demand for dental restorations and prosthetics are some factors that drive the 3D printing dental devices market.

List the top 5 Key players of the 3D Printing Dental Devices Market?

The top key players that drives the development of 3D Printing Dental Devices Market are 3D, Systems Corporation, Stratasys Ltd., Dentsply Sirona, Formlabs and Carbon Inc.

Which segment in product type is expected to lead in 3D Printing Dental Devices Market?

Removable partial dentures in 3D Printing Dental Devices market is expected to command significant share over the assessment period.

Explore Similar Insights

Future Market Insights

3D Printing Dental Devices Market