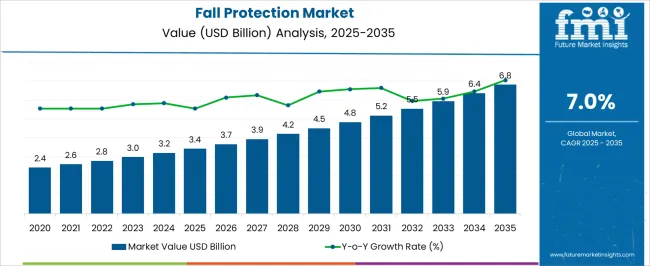
The Fall Protection Market is estimated to be valued at USD 3.4 billion in 2025 and is projected to reach USD 6.8 billion by 2035, registering a compound annual growth rate (CAGR) of 7.0% over the forecast period.

| Metric | Value |
|---|---|
| Fall Protection Market Estimated Value in (2025 E) | USD 3.4 billion |
| Fall Protection Market Forecast Value in (2035 F) | USD 6.8 billion |
| Forecast CAGR (2025 to 2035) | 7.0% |
The fall protection market is experiencing strong growth, supported by stringent workplace safety regulations, heightened employer awareness, and increasing construction and industrial activity worldwide. The demand for fall protection equipment has risen in tandem with infrastructure projects, high-rise construction, and oil and gas sector developments.
Current market expansion is further driven by the emphasis on compliance with occupational safety standards to reduce workplace accidents. Advancements in ergonomics, material strength, and durability of fall protection products have enhanced user comfort and adoption rates.
Future market growth will be underpinned by continued enforcement of regulatory frameworks and the rising incorporation of smart technologies, such as IoT-enabled harnesses, that provide real-time monitoring. As industries prioritize worker safety to avoid penalties and improve productivity, the fall protection market is positioned for sustained expansion.

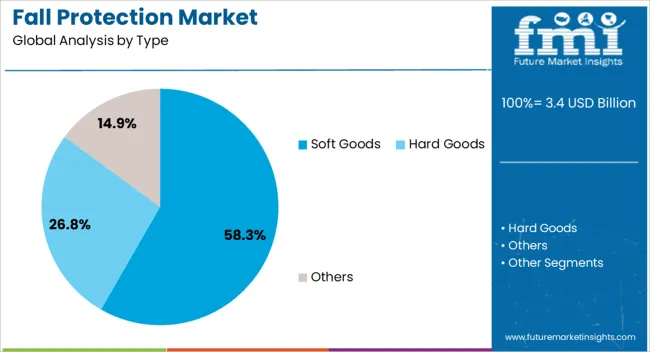
The soft goods segment dominates the type category in the fall protection market, accounting for approximately 58.30% share. This segment includes lanyards, harnesses, and lifelines, which are critical for personal protective equipment in high-risk environments.
Soft goods are favored for their lightweight, flexible, and ergonomic designs, which improve user comfort while ensuring compliance with safety regulations. Advances in high-strength fibers and impact-resistant webbing have enhanced durability and safety performance.
Their cost-effectiveness and wide applicability across industries, from construction to oil and gas, have reinforced their market share. With rising demand for personal fall arrest systems and continuous product innovation, the soft goods segment is expected to maintain its leadership position.

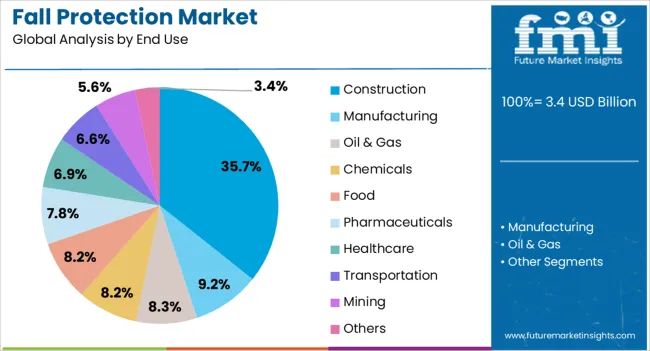
The construction segment leads the end use category with approximately 35.70% share, reflecting the industry’s reliance on fall protection equipment for high-rise projects, roofing, and infrastructure development. The segment benefits from stringent safety mandates and the inherently high-risk nature of construction activities.
Contractors are increasingly adopting comprehensive fall protection solutions to reduce accident rates and comply with occupational health standards. Rapid urbanization and large-scale infrastructure investments across emerging markets are accelerating demand.
Furthermore, rental availability and product innovation tailored for construction sites have made adoption more accessible. With continued global expansion of the construction industry, this segment is expected to sustain its leadership role.
The scope for global fall protection market insights expanded at a 9.3% CAGR between 2020 and 2025. The market is anticipated to develop at a CAGR of 7.1% over the forecast period from 2025 to 2035.
| Historical CAGR (2020 to 2025) | 9.3% |
|---|---|
| Forecasted CAGR (2025 to 2035) | 7.1% |
Between 2020 and 2025, the global fall protection market witnessed robust growth, expanding at a CAGR of 9.3%. Increased emphasis on workplace safety, stringent regulatory measures, and technological advancements in fall protection solutions characterized this period.
Industries across the globe actively invested in comprehensive safety measures, contributing to the positive trajectory of the market. As we look ahead to the forecast period from 2025 to 2035, the growth rate is expected to moderate to a CAGR of 7.1%.
While still indicative of a steadily developing market, this slightly lower projection reflects market maturity, evolving regulatory landscapes, and the integration of advanced technologies.
The forecast underscores the continued importance of fall protection solutions but anticipates a more measured pace of growth than the dynamic trends observed in the preceding years.
| Attributes | Details |
|---|---|
| Drivers |
|
The table below showcases CAGRs from the five countries spearheaded by the United States, Japan, China, the United Kingdom, and South Korea.
The market in Japan is dynamic and rapidly advancing, poised for significant growth with an 8.5% CAGR by 2035. Embracing innovation, the country contributes to diverse industries, showcasing a thriving landscape in its economic evolution.
| Countires | CAGR by 2035 |
|---|---|
| The United States | 7.2% |
| Japan | 8.5% |
| China | 7.4% |
| The United Kingdom | 8.3% |
| South Korea | 8.2% |
In the United States, the fall protection market is prominently utilized across various sectors, such as construction, manufacturing, and utilities. With a strong emphasis on workplace safety regulations, fall protection systems are extensively employed in construction sites, industrial facilities, and maintenance operations. The CAGR reflects ongoing investments in ensuring worker safety and compliance with stringent occupational safety standards.
In Japan, where precision and efficiency are paramount, the fall protection market is primarily employed in the construction and manufacturing sectors. Rigorous safety measures are integrated into these industries to prevent falls during construction activities and ensure the well-being of workers.
The notable CAGR suggests a heightened commitment to enhancing workplace safety, aligning with the dedication to technological advancements and industrial excellence in Japan.
The burgeoning industrial landscape in China drives the significant use of fall protection systems in the construction, manufacturing, and energy sectors. The construction boom, rapid industrialization, and infrastructure projects necessitate robust fall protection measures to safeguard workers.
The substantial CAGR indicates the crucial role of fall protection solutions in supporting the expanding workforce of China and fostering a secure work environment.
In the United Kingdom, the fall protection market finds extensive application in construction, telecommunications, and utilities. Stringent regulations and a focus on workplace safety contribute to the widespread adoption of fall protection systems, especially in high-risk environments.
The notable CAGR underscores the proactive approach in the United Kingdom toward safeguarding workers from fall-related hazards across diverse industries.
South Korea utilizes fall protection solutions predominantly in the construction and manufacturing sectors. As an industrial powerhouse, ensuring worker safety is paramount.
Fall protection measures are integral to construction sites and manufacturing facilities, aligning with the commitment to fostering a secure work environment in South Korea. The substantial CAGR reflects the growing awareness and investment in fall protection systems to enhance workplace safety standards.Top of Form
The table below provides an overview of the fall protection landscape on the basis of type and end-use. Soft Goods are projected to lead the type of market at a 6.9% CAGR by 2035, while construction in the end user category is likely to expand at a CAGR of 6.7% by 2035.
Advancements in materials and technology play a pivotal role in driving the growth of the soft goods segment in the fall protection market.
A growing emphasis on user comfort and compliance further propels the soft goods segment.
| Category | CAGR by 2035 |
|---|---|
| Soft Goods | 6.9% |
| Construction | 6.7% |
Soft Goods, a prominent type in fall protection, is anticipated to lead the market with a projected CAGR of 6.9% by 2035. Soft Goods encompass a range of safety equipment like harnesses, lanyards, and other fabric-based products designed to provide comfort and flexibility while ensuring effective fall protection.
The steady growth in this category is attributed to advancements in materials and design, enhancing the overall performance and user experience of soft goods in fall prevention.
Construction emerges as a significant segment in the end-user category, poised to expand at a CAGR of 6.7% by 2035. This projection underscores the critical role of fall protection measures in the construction industry, where workers often operate at elevated heights.
The demand for robust fall protection solutions in construction is driven by stringent safety regulations, increasing awareness, and the inherent risks of working in elevated and potentially hazardous environments.
The anticipated growth in construction as an end-user segment reflects the sustained emphasis on worker safety and regulatory compliance within the industry.

The competitive landscape of the fall protection market is characterized by the presence of established players and a continual influx of new entrants, fostering innovation and market dynamism.
The companies often engage in strategic collaborations, mergers, and acquisitions to strengthen their market foothold and expand their offerings. Emerging players, focusing on niche segments or introducing innovative technologies, contribute to the competitive diversity within the market, challenging established norms and promoting healthy competition.
Market dynamics are further influenced by ongoing research and development activities, with companies striving to introduce cutting-edge fall protection solutions. Customization of products to suit industry-specific needs and compliance with evolving safety standards are critical factors in gaining a competitive edge.
Some of the recent developments are:
| Attributes | Details |
|---|---|
| Estimated Market Size in 2025 | USD 3.4 billion |
| Projected Market Valuation in 2035 | USD 6.8 billion |
| CAGR Share from 2025 to 2035 | 7.0% |
| Forecast Period | 2025 to 2035 |
| Historical Data Available for | 2020 to 2025 |
| Market Analysis | Value in USD billion |
| Key Regions Covered | North America; Latin America; Western Europe; Eastern Europe; South Asia and Pacific; East Asia; Middle East and Africa |
| Key Market Segments Covered | By Type, By End Use, By Region |
| Key Countries Profiled | The United States, Canada, Brazil, Mexico, Germany, The United Kingdom, France, Spain, Italy, Poland, Russia, Czech Republic, Romania, India, Bangladesh, Australia, New Zealand, China, Japan, South Korea, GCC Countries, South Africa, Israel |
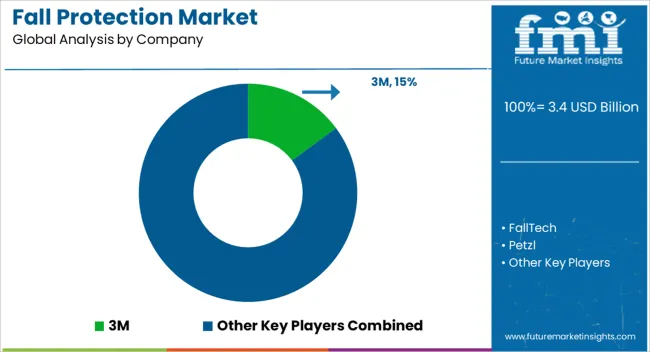
| Key Companies Profiled | FallTech; Petzl; SKYLOTEC; WernerCo.; Guardian Fall; MSA Safety; Honeywell International; 3M; W.W. Grainger Inc.; Gravitec Systems Inc. |
The global fall protection market is estimated to be valued at USD 3.4 billion in 2025.
The market size for the fall protection market is projected to reach USD 6.8 billion by 2035.
The fall protection market is expected to grow at a 7.0% CAGR between 2025 and 2035.
The key product types in fall protection market are soft goods, hard goods and others.
In terms of end use, construction segment to command 35.7% share in the fall protection market in 2025.


Our Research Products

The "Full Research Suite" delivers actionable market intel, deep dives on markets or technologies, so clients act faster, cut risk, and unlock growth.

The Leaderboard benchmarks and ranks top vendors, classifying them as Established Leaders, Leading Challengers, or Disruptors & Challengers.

Locates where complements amplify value and substitutes erode it, forecasting net impact by horizon

We deliver granular, decision-grade intel: market sizing, 5-year forecasts, pricing, adoption, usage, revenue, and operational KPIs—plus competitor tracking, regulation, and value chains—across 60 countries broadly.

Spot the shifts before they hit your P&L. We track inflection points, adoption curves, pricing moves, and ecosystem plays to show where demand is heading, why it is changing, and what to do next across high-growth markets and disruptive tech

Real-time reads of user behavior. We track shifting priorities, perceptions of today’s and next-gen services, and provider experience, then pace how fast tech moves from trial to adoption, blending buyer, consumer, and channel inputs with social signals (#WhySwitch, #UX).

Partner with our analyst team to build a custom report designed around your business priorities. From analysing market trends to assessing competitors or crafting bespoke datasets, we tailor insights to your needs.
Supplier Intelligence
Discovery & Profiling
Capacity & Footprint
Performance & Risk
Compliance & Governance
Commercial Readiness
Who Supplies Whom
Scorecards & Shortlists
Playbooks & Docs
Category Intelligence
Definition & Scope
Demand & Use Cases
Cost Drivers
Market Structure
Supply Chain Map
Trade & Policy
Operating Norms
Deliverables
Buyer Intelligence
Account Basics
Spend & Scope
Procurement Model
Vendor Requirements
Terms & Policies
Entry Strategy
Pain Points & Triggers
Outputs
Pricing Analysis
Benchmarks
Trends
Should-Cost
Indexation
Landed Cost
Commercial Terms
Deliverables
Brand Analysis
Positioning & Value Prop
Share & Presence
Customer Evidence
Go-to-Market
Digital & Reputation
Compliance & Trust
KPIs & Gaps
Outputs
Full Research Suite comprises of:
Market outlook & trends analysis
Interviews & case studies
Strategic recommendations
Vendor profiles & capabilities analysis
5-year forecasts
8 regions and 60+ country-level data splits
Market segment data splits
12 months of continuous data updates
DELIVERED AS:
PDF EXCEL ONLINE
Fall Detection System Market Insights – Size & Forecast 2025 to 2035
Flu Protection Kits Market Size and Share Forecast Outlook 2025 to 2035
Eye Protection Equipment Market Size and Share Forecast Outlook 2025 to 2035
Teleprotection Market Growth – Trends & Forecast 2025 to 2035
ESD Protection Devices Market Insights – Trends & Demand 2023-2033
Head Protection Equipment Market Forecast Outlook 2025 to 2035
Fire Protection Materials Market Size and Share Forecast Outlook 2025 to 2035
CBRN Protection Equipment Market Size and Share Forecast Outlook 2025 to 2035
Fire Protection System Pipes Market Size and Share Forecast Outlook 2025 to 2035
DDoS Protection Market Size and Share Forecast Outlook 2025 to 2035
Fire Protection Systems for Industrial Cooking Market Growth - Trends & Forecast 2025 to 2035
DDoS Protection & Mitigation Security Market Growth - Trends & Forecast through 2034
Data Protection as a Service (DPaaS) Market
Surge Protection Device Market Size and Share Forecast Outlook 2025 to 2035
Brand Protection Tools Market Analysis - Size, Share, and Forecast 2025 to 2035
Market Share Distribution Among Brand Protection Tools Providers
Market Share Breakdown of Paint Protection Film Manufacturers
Memory Protection System Market Size and Share Forecast Outlook 2025 to 2035
Hernia Protection Market Analysis - Size, Share, and Forecast Outlook 2025 to 2035
Surface Protection Service Market Size and Share Forecast Outlook 2025 to 2035

Thank you!
You will receive an email from our Business Development Manager. Please be sure to check your SPAM/JUNK folder too.
Chat With
MaRIA