Reports

- Global Locations -

Headquarters

Future Market Insights, Inc.

Christiana Corporate, 200
Continental Drive, Suite 401,
Newark, Delaware - 19713,
United States

T: +1-845-579-5705

Americas

Future Market Insights, Inc.

616 Corporate Way, Suite 2-9018,
Valley Cottage, NY 10989, United States

T: +1-347-918-3531

MEA

Future Market Insights

1602-6 Jumeirah Bay X2 Tower, Plot No: JLT-PH2-X2A,
Jumeirah Lakes Towers, Dubai,
United Arab Emirates

Europe

Future Market Insights

3rd Floor, 207 Regent Street,
W1B 3HH London
United Kingdom

T: + 44 (0) 20 8123 9659
D: +44 (0) 20 3287 4268

Asia Pacific

Future Market Insights

IndiaLand Global Tech Park, Unit UG-1, Behind Grand HighStreet, Phase 1, Hinjawadi, MH, Pune – 411057, India

Cybersecurity Insurance Market Snapshot (2022 to 2032)

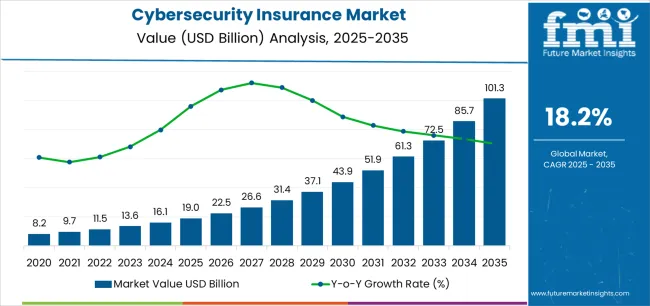
[307 Pages Report] The cybersecurity insurance revenue totaled at US$ 9.5 Billion in 2021. The cybersecurity insurance market is expected to reach US$ 61.2 Billion by 2032, exhibiting growth at 18.2% CAGR between 2022 and 2032.

Businesses are increasingly embracing premium and dynamic infrastructures in order to reduce problems and security breaches, which is expected to fuel the cybersecurity market's growth in the coming years.

Attributes Details
Cybersecurity Insurance Market CAGR (2022 to 2032) 18.2%
Market Size (2022) US$ 11.5 Billion
Market Size (2032) US$ 61.2 Billion

MGAs (managing general agents) specializing in cyber insurance and Cybersecurity are taking advantage of the growing need for fully packaged solutions in the market. There are significant differences in terms, conditions, coverages, and limits of cyber insurance policies.

Despite being not fully intentional, the variation in cyber policies is a natural evolution of the process. Nevertheless, it results in misunderstandings for policyholders about which policies are suitable. As a result, reinsurers also have a difficult time assessing their risk exposure concerning different risks.

With the COVID-19 pandemic crisis looming, multiple governments and regulatory agencies have mandated that public and private organizations adopt new practices for implementing remote work and social distancing. Since then, various organizations have become more and more dependent on digital business continuity planning strategies in the market.

Hardware supply was the major issue affecting the market. In the wake of the pandemic, work-from-home setups became an increasingly common practice, putting workplaces at risk from sophisticated cyber-attacks. With the popularity of BYOD devices, the WFH phenomenon, and the use of the internet in every corner of the globe, markets turned to digitization, pushing the need for cyber insurance policies against cyber-attacks.

Don't pay for what you don't need

Customize your report by selecting specific countries or regions and save 30%!

Key Drivers Encouraging Uptake Of Cybersecurity Insurance

Regulations Mandating Cybersecurity to Boost Demand for Cybersecurity Insurance

Cybersecurity insurance is growing in popularity across small, medium, and large-scale industries, driven by technological advances. In addition, the increasing media coverage of business attacks increased the desire for businesses to secure cyber insurance policies in the market. Cyber threats are being regulated more rigorously, with increased stipulations on underwriting and risk management.

In addition, regulations for cyber insurance are expected to grow in the coming years, as a growing number of regulatory bodies will require a higher standard of information to gather and report on cybercrimes.

For a reporting system that is easily accessible and standard across the board, specific data collection requirements will be needed in the market. This will bring about the adoption of adaptive cyber policies in many organizations in the coming years.

Cybersecurity Insurance Market

In addition, government agencies throughout the world have taken numerous initiatives to ensure an increased level of data security and protection in various businesses. Since the advent of COVID-19, policyholders, advisors, insurers, and insurance brokers have seen an increased need for cyber insurance policies in the market.

Growing adoption of digitization, rapid developments in the technologies, cloud-based storage systems, Big Data, IoT, and artificial intelligence (AI) in business are frequently exposed to security breaches which have led various industry firms to adopt cybersecurity insurance in the market.

The growing use of social media platforms and easy access to personal information over the internet has prompted cybercriminals to commit crimes involving the sale of personal information like credit card numbers, identities, medical records, and more on the dark web. As a result, it has contributed to an increase in the demand for cybersecurity insurance in the market.

Cloud computing has eroded traditional IT boundaries, opened up new markets, promoted mobile devices, and helped to advance unified communications. As a result, modern cybersecurity is pushing firms to use more sophisticated insurance models to protect sensitive data on the cloud. All these factors are propelling the growth of the cybersecurity insurance market.

Market Challenges For Cybersecurity Insurance

The dearth of Knowledge concerning Cybersecurity Insurance to Restrain Growth

Deloitte's report says it is too early to determine the risks carriers will face or to develop a set of integrated products and services that will attract clients to the market. The law does not require most companies to report data breaches outside of those that affect consumer data, which means many hacks remain unreported. Therefore, the insurance industry suffers from a rampant bias in reporting that hinders the creation of policies in the market.

As governments and organizations became more aware of security risks and the possibility of financial loss due to threats, they increased spending on cybersecurity. Security solutions are heavily invested by businesses worldwide, but cyber insurance is often neglected.

The alarming increase in cybercrime and cyberattacks indicates companies should get cyber insurance as a means of reducing risks and financial losses. A third-party service working with a wide variety of businesses might be hacked, resulting in service failures for users of the service. Such events could be chaotic for the insurance industry.

Insurance companies must continuously adapt to new kinds of attacks as underlying exposures shift. As a result, risk management is a constant challenge. Cyber-attacks are also posing new operational vulnerabilities in businesses caused by developments in IoT and autonomous vehicles that must be assessed and insured in the market.

The commoditization of coverage and its price sensitivity severely limits insurer growth and profits over the long term. This negatively affects the growth of the various vertical industries in the market.

Sudip Saha
Sudip Saha

Principal Consultant

Talk to Analyst

Find your sweet spots for generating winning opportunities in this market.

Comparative View Of Cybersecurity Insurance Market

Cybersecurity Insurance Market:

Attributes Cybersecurity Insurance Market
CAGR (2022 to 2032) 18.2%
Market Value (2032) US$ 61.2 Billion
Growth Factor Data breaches, stringent cybersecurity regulations, high recovery rates, and increased frequency and sophistication of cyber-attacks are all factors that are driving growth in the cyber insurance market.
Opportunity Cyberattacks are on the rise with the increasing usage of social media and IoT usage. Casualty insurers have realized that the rise in cyber exposures has also risen with the proliferation of digital devices and advances in new technologies to open up new markets.

Industrial Cybersecurity Market:

Attributes Industrial Cybersecurity Market
CAGR (2022 to 2032) 7.7%
Market Value (2032) US$ 43.5 Billion
Growth Factor Demand for industrial cybersecurity solutions and services is rising as it helps firms in a variety of industries safeguard their data and other secret information from cyber-attacks. These industrial cybersecurity services assist businesses in monitoring and controlling a wide range of process outputs and inputs on the job site.
Opportunity Manufacturing and industrial facilities are increasingly adopting cloud-based ICS-as-a-service and industrial robots based on artificial intelligence platforms, which is driving the demand for industrial cybersecurity solutions. Industrial robots have cybersecurity solutions installed to protect them from cyber-attacks and keep them running properly.

Cybersecurity Market:

Attributes Cybersecurity Market
CAGR (2022 to 2032) 10.5%
Market Value (2032) US$ 582 Billion
Growth Factor Key drivers of this market include the implementation of tight government regulations on data privacy, increasing cyber threats, and an increasing number of data centers. The market offers various benefits such as improved security of cyberspaces, increased cyber safety, and faster response time to national crises.
Opportunity Rising awareness among Internet users about the sensitivity of their private data and impending legal actions also prompt businesses to ensure information security by following the best cyber security practices.

A cybersecurity policy will assist in covering legal expenses. Any legal costs incurred by the company and its employees as a result of a cyberattack will likely be covered by cyber insurance. With the industry's growing understanding of cyber risk, there will be more data available to reveal how preventative behavior - such as strengthening security controls, impacts the company's threat profile when a cyber event happens.

Based on a re-evaluation of positive behaviors and risk levels, this could result in monthly premiums or credit mechanisms for add-on services.

The increased frequency of cybersecurity incidents has led to the addition of more types of cyber policies. It could provide valuable coverage for small businesses storing sensitive information online or on computers.

Companies that invest heavily in information technology or send sensitive data, such as credit card numbers, regularly need cybersecurity insurance. Businesses that invest significant resources in their IT infrastructure - in terms of both hardware and software invest in cyber insurance.

Cyber experts will be hired as part of insurers' core risk management teams, even with the introduction of more advanced cyber risk modeling capabilities, since their knowledge will help them better determine their cyber exposures and use third-party cyber models effectively.

Cyber insurance will be flooded with alternative capital. In addition, increasing press coverage of cyberattacks on businesses encourages businesses to seek insurance protection against cyber risk.

Category-Wise Insights

By Organization Size, which Enterprises need Cybersecurity Insurance the most?

Large Enterprises are likely to benefit from Cybersecurity Insurance

The business world keeps investing heavily in cybersecurity, but few have signed up for cyber insurance to make their firms safer after an attack. Although big companies often purchase insurance, the majority of these companies still run the risk of being exposed to the market. In large enterprises, cybersecurity insurance will grow at a CAGR of 17.8% during the forecast period.

By insuring themselves against cyber-related risks and liabilities, large businesses can minimize cyber liability. The costs of cyber insurance are reasonable when compared to the benefits. Therefore, the majority of large to medium-sized businesses opt for cybersecurity insurance to ensure their safety.

Cyber insurance can help minimize the financial risk of businesses with valuable assets. Larger companies have more valuable data that could be ransomed, so the costs of cyber incidents can be hard to predict. For smaller companies with limited revenue, the cost of cybersecurity premiums might be difficult to justify if they estimate that the costs of recovering from a data breach are lower than the cost of the premiums.

Businesses storing financial data or any personal information about their clients may want to consider first-party protection. A cybersecurity policy could be particularly valuable for companies with a large customer base. Companies might face regulatory fines following a data breach.

Policies can help cover these fines under insurance. State laws often require companies to notify customers if they experience a data breach, and first-party insurance plans may cover this expense, which is important for large companies in the market.

By End User, which Category of Cybersecurity Insurance will grow the Fastest?

By end user, insurance providers are expected to remain prominent, projected to grow at a CAGR of 18% during the forecast period. To minimize aggregation risk in businesses, insurance providers adopt stricter underwriting policies. To better pool underwriting resources across the industry, insurance companies implement risk-informed models rather than definitive predictive models in the market.

Due to the relatively new nature of cybersecurity, it can be difficult to find an insurance provider that can educate companies about cybersecurity risks and ways to mitigate them.

Competitive advantage and a value-added service for their insured are one of the ways carriers can develop insights-driven tools that help businesses prepare for upcoming risks like data breaches. In banking and financial institutions, cybersecurity insurance is becoming an increasingly vital component.

Get the data you need at a Fraction of the cost

Personalize your report by choosing insights you need
and save 40%!

Region-Wise Insights

What is the market opportunity across North America for cybersecurity insurance?

Due to its established and sustainable economies, North America is capable of investing heavily in Research and Development activities, which in turn contributes to the advancement of cyber insurance technology in the market. The presence of a majority of key players in the cyber insurance market is expected to drive the market in this region.

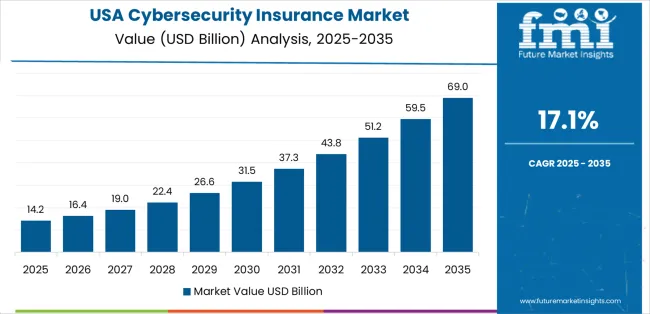
Globally, cybersecurity insurance is dominated by the USA. During the forecast period, the cybersecurity insurance market in this region is projected to grow by 18%. As a result, of the significantly increased number of connected devices across the region, cyberattacks have risen at an alarming pace in the country.

Consumers in the region are increasingly using public clouds and loading their personal information into various mobile apps to be able to conveniently shop, bank, communicate, and use other services over the devices.

The Identity Theft Resource Center published a report in 2022 that found 1,789 data breaches had occurred. With so many data breaches occurring across several industries, organizations are increasingly opting for cybersecurity insurance, resulting in market growth.

By October 2016, only 29% of USA companies had purchased cyber insurance, according to a survey conducted by the Council of Insurance Agents and Brokers (CIAB).

According to a report published in October 2021, the National Association of Insurance Commissioners (NAIC) calculated that the US cybersecurity insurance market, including both domestic insurers and foreign insurers, generated direct premiums of about $4.1 billion in 2020. The total is 29.1% higher than the prior year, and it is expected to increase significantly once the figures for 2021 are confirmed.

Security Breaches in Developing Countries will drive the Growth of Cyber Insurance in the Asia Pacific

The Asia Pacific is predicted to be the most lucrative region for cybersecurity insurance. In this region, cyber insurance is experiencing high growth opportunities as a result of effective government regulations and technological advancements in the market.

Technology is advancing at an accelerated rate in this region, including business intelligence tools, cloud computing, analytics, and rapid infrastructure development. China, Japan, South Korea, India, and Singapore are some of the emerging economies in this region.

The rapid growth in connectivity and the rapid pace of digital transformation in the region make it particularly vulnerable to cyberattacks due to the rapid development of these technologies in the market. The increase in regulations in China, together with fines and penalties for noncompliance, is expected to boost the market for cyber security insurance.

An increasing number of cyber-attacks in China have prompted organizations to adopt cyber liability insurance, which should propel the demand for cyber insurance during the forecast period. The presence of mobile manufacturers and IT companies in this region is driving the growth of the cybersecurity insurance market.

Cybersecurity insurance in China is projected to grow by 17.5% over the forecast period. Wireless communication devices, along with network connectivity, will fuel growth in this region over the forecast period.

The increase in Internet penetration, the large consumer base, rapid income growth, and technological advances, of which continue to support cybersecurity insurance growth in this region. Japan is expected to grow at a CAGR of 16.5% over the forecast period. South Korea is projected to grow at a CAGR of 16.1% during the forecast period.

Potential Growth Prospects for the UK Cybersecurity Insurance Market

Cybercrime, which has grown significantly in the UK as digitalized services and online shopping have proliferated, has prompted greater public and private spending on security in the market. Cyber solutions have also become more sophisticated and personalized as organizations' IT footprints have grown complex. Market growth for cyber security insurance is projected at 17.1% in the United Kingdom during the forecast period.

Technologies such as the Internet of Things, analytics, machine learning, and artificial intelligence can create new markets for innovative cyber products in this region. In addition to more and more services being provided online, both the federal and local governments are investing heavily in safeguarding citizen data in the market.

As part of the National Cyber Security Center, a part of GCHQ acts as a bridge between government and industry, providing a collective source of advice, information, and guidance on cyber security, including incident response. All these factors propel growth for cybersecurity insurance in the market.

Cybersecurity Insurance Market: Competitive Landscape

By partnering with other manufacturers, manufacturing companies can increase revenue and market share. When new technologies are introduced, there is a growth of potential threats in the market, which will likely provide an opportunity for end-users to benefit from these insurance policies.

The ability to expand a company's production capabilities is one of the potential benefits of a strategic partnership.

  • As of January 2022, Tech Mahindra acquired CTC, an IT solutions and services provider for clients in the insurance and financial services sectors. The acquisition was valued at US$ 352 Million. In addition, Tech Mahindra acquired 25% of the following two InsurTech companies, SWFT, which uses SaaS technology to engage insurance customers, and Surance, an end-to-end solution for personal cyber protection, vulnerability assessment, and cyber insurance coverage.
  • In May 2022, new cyber insurance provided by At-Bay is backed by two of the leading players in specialty insurance - Trisura Specialty Insurance Company and The Hartford Steam Boiler (HSB). At-Bay's top capital provider and lead reinsurer, HSB, has increased its capital commitment for 2022 compared to last year, while the cyber and tech errors and omissions (E&O) program is now underwritten by Trisura. At-Bay's newly formed captive reinsurance company, as well as reinsurance partners, are contributing to At-Bay's new program, providing a group of companies that are working together to support long-term growth initiatives.

Key Players

  • BitSight
  • Prevalent
  • RedSeal
  • SecurityScorecard
  • Cyber Indemnity Solutions
  • Allianz
  • AIG
  • Aon
  • Arthur J. Gallagher & Co
  • Travelers Insurance
  • AXA XL
  • Axis

Key Segments Covered In The Cybersecurity Insurance Market

By Component:

  • Solutions
    • Analytics platform
    • Disaster recovery and business continuity
    • Other Cybersecurity Solutions
  • Services
    • Consulting/ Advisory
    • Security awareness training
    • Others (infrastructure services, implementation, and support and maintenance)

By Insurance Coverage:

  • Data Breach
  • Data Loss
    • Denial of service and downtime
    • Ransomware attacks
    • Others (third-party data, business disruption, and social engineering)
  • Cybersecurity Liability
    • Type
    • Source/Target

By Insurance Type:

  • Packaged
  • Stand-alone

By Organization Size:

  • Large Enterprises
  • SMEs

By End User:

  • Technology Providers
    • Insurance Companies
    • Third-party administrators, brokers, and consultancies
    • Government Agencies
  • Insurance Providers
    • Financial Services
    • IT and ITES
    • Healthcare and Life Science
    • Retail and E-commerce
    • Telecom
    • Travel, tourism, and hospitality
    • Others (Education, Manufacturing, Energy and Utilities, and Government)

By Region:

  • North America
  • Europe
  • Asia Pacific
  • Middle East and Africa
  • Latin America

Frequently Asked Questions

What is the growth outlook for the cybersecurity insurance market?

The cybersecurity insurance market is expected to grow at a steady CAGR of 18.2% over the forecast period

What was the size of the cybersecurity insurance market size in 2021?

The global market for cybersecurity insurance was valued at US$ 9.5 Billion 2021

What organization size is the most valuable in the cybersecurity insurance market?

Large Enterprises are projected to have the highest market with a CAGR of 17.8% during the forecast period

Which region dominates the global cybersecurity insurance market?

USA leads the global cybersecurity insurance market with a CAGR of 18% during the forecast period

What will be the market size of cybersecurity insurance by 2032?

The market for cybersecurity insurance is expected to grow by nearly US$ 61.2 Billion by 2032

Which end-user type is forecast to drive market growth during the forecast period?

The insurance providers segment is expected to reach a CAGR of 18% during the forecast period

What is the estimated market value of the China Market?

China is expected to grow at 17.5% CAGR in cybersecurity insurance from 2022 to 2032.

Table of Content

1. Executive Summary | Cybersecurity Insurance Market

    1.1. Global Market Outlook

    1.2. Summary of Statistics

    1.3. Key Market Characteristics & Attributes

    1.4. FMI Analysis and Recommendations

2. Market Overview

    2.1. Market Coverage / Taxonomy

    2.2. Market Definition / Scope / Limitations

3. Market Risks and Trends Assessment

    3.1. Risk Assessment

        3.1.1. COVID-19 Crisis and Impact on Demand

        3.1.2. COVID-19 Impact Benchmark with Previous Crisis

        3.1.3. Impact on Market Value (US$ Million)

        3.1.4. Assessment by Key Countries

        3.1.5. Assessment by Key Market Segments

        3.1.6. Action Points and Recommendation for Suppliers

    3.2. Key Trends Impacting the Market

    3.3. Formulation and Product Development Trends

4. Market Background

    4.1. Market, by Key Countries

    4.2. Market Opportunity Assessment (US$ Million)

        4.2.1. Total Available Market

        4.2.2. Serviceable Addressable Market

        4.2.3. Serviceable Obtainable Market

    4.3. Market Scenario Forecast

        4.3.1. Demand in Optimistic Scenario

        4.3.2. Demand in Likely Scenario

        4.3.3. Demand in Conservative Scenario

    4.4. Investment Feasibility Analysis

        4.4.1. Investment in Established Markets

            4.4.1.1. In Short Term

            4.4.1.2. In Long Term

        4.4.2. Investment in Emerging Markets

            4.4.2.1. In Short Term

            4.4.2.2. In Long Term

    4.5. Forecast Factors - Relevance & Impact

        4.5.1. Top Companies Historical Growth

        4.5.2. Growth in Automation, By Country

        4.5.3. Adoption Rate, By Country

    4.6. Market Dynamics

        4.6.1. Market Driving Factors and Impact Assessment

        4.6.2. Prominent Market Challenges and Impact Assessment

        4.6.3. Market Opportunities

        4.6.4. Prominent Trends in the Global Market & Their Impact Assessment

5. Key Success Factors

    5.1. Manufacturers’ Focus on Low Penetration High Growth Markets

    5.2. Banking on with Segments High Incremental Opportunity

    5.3. Peer Benchmarking

6. Global Market Demand Analysis 2015 to 2021 and Forecast, 2022 to 2032

    6.1. Historical Market Analysis, 2015 to 2021

    6.2. Current and Future Market Projections, 2022 to 2032

    6.3. Y-o-Y Growth Trend Analysis

7. Global Market Value Analysis 2015 to 2021 and Forecast, 2022 to 2032

    7.1. Historical Market Value (US$ Million) Analysis, 2015 to 2021

    7.2. Current and Future Market Value (US$ Million) Projections, 2022 to 2032

        7.2.1. Y-o-Y Growth Trend Analysis

        7.2.2. Absolute $ Opportunity Analysis

8. Global Market Analysis 2015 to 2021 and Forecast 2022 to 2032, By Component

    8.1. Introduction / Key Findings

    8.2. Historical Market Value (US$ Million) and Analysis By Component, 2015 to 2021

    8.3. Current and Future Market Value (US$ Million) and Analysis and Forecast By Component, 2022 to 2032

        8.3.1. Solution

            8.3.1.1. Analytics platform

            8.3.1.2. Disaster Recovery and business continuity

            8.3.1.3. Cybersecurity Solution

        8.3.2. Services

            8.3.2.1. Consulting/ Advisory

            8.3.2.2. Security Awareness Training

            8.3.2.3. Others (infrastructure services, implementation, and support and maintenance)

    8.4. Market Attractiveness Analysis By Component

9. Global Market Analysis 2015 to 2021 and Forecast 2022 to 2032, By Insurance coverage

    9.1. Introduction / Key Findings

    9.2. Historical Market Value (US$ Million) and Analysis By Insurance Coverage, 2015 to 2021

    9.3. Current and Future Market Value (US$ Million) and Analysis and Forecast By Insurance Coverage, 2022 to 2032

        9.3.1. Data Breach

            9.3.1.1. Data loss

            9.3.1.2. Denial of service and downtime

            9.3.1.3. Ransomware attacks

            9.3.1.4. Others (third-party data, business disruption, and social engineering)

        9.3.2. Cybersecurity Liability

            9.3.2.1. Type

            9.3.2.2. Source/ Target

    9.4. Market Attractiveness Analysis By Insurance Coverage

10. Global Market Analysis 2015 to 2021 and Forecast 2022 to 2032, By Insurance Type

    10.1. Introduction / Key Findings

    10.2. Historical Market Value (US$ Million) and Analysis By Insurance Type, 2015 to 2021

    10.3. Current and Future Market Value (US$ Million) and Analysis and Forecast By Insurance Type, 2022 to 2032

        10.3.1. Packaged

        10.3.2. Stand-alone

    10.4. Market Attractiveness Analysis By Insurance Type

11. Global Market Analysis 2015 to 2021 and Forecast 2022 to 2032, By Organization Size

    11.1. Introduction / Key Findings

    11.2. Historical Market Value (US$ Million) and Analysis By Organization Size, 2015 to 2021

    11.3. Current and Future Market Value (US$ Million) and Analysis and Forecast By Organization Size, 2022 to 2032

        11.3.1. Large Enterprises

        11.3.2. SMEs

    11.4. Market Attractiveness Analysis By Organization Size

12. Global Market Analysis 2015 to 2021 and Forecast 2022 to 2032, By End User

    12.1. Introduction / Key Findings

    12.2. Historical Market Value (US$ Million) and Analysis By End User, 2015 to 2021

    12.3. Current and Future Market Value (US$ Million) and Analysis and Forecast By End User, 2022 to 2032

        12.3.1. Technology Provider

            12.3.1.1. Insurance companies

            12.3.1.2. Third-party administrators, brokers, and consultancies

            12.3.1.3. Government Agencies

        12.3.2. Insurance Provider

            12.3.2.1. Financial services

            12.3.2.2. IT and ITES

            12.3.2.3. Healthcare and life science

            12.3.2.4. Retail and E-commerce

            12.3.2.5. Telecom

            12.3.2.6. Travel, tourism, and hospitality

            12.3.2.7. Others (Education, Manufacturing, Energy and Utilities, and Government)

    12.4. Market Attractiveness Analysis By End User

13. Global Market Analysis 2015 to 2021 and Forecast 2022 to 2032, By Region

    13.1. Introduction

    13.2. Historical Market Value (US$ Million) and Analysis By Region, 2015 to 2021

    13.3. Current Market Size (US$ Million) & Analysis and Forecast By Region, 2022 to 2032

        13.3.1. North America

        13.3.2. Latin America

        13.3.3. Europe

        13.3.4. Asia Pacific

        13.3.5. Middle East and Africa (MEA)

    13.4. Market Attractiveness Analysis By Region

14. North America Market Analysis 2015 to 2021 and Forecast 2022 to 2032

    14.1. Introduction

    14.2. Pricing Analysis

    14.3. Historical Market Value (US$ Million) and Trend Analysis By Market Taxonomy, 2015 to 2021

    14.4. Market Value (US$ Million) & Forecast By Market Taxonomy, 2022 to 2032

        14.4.1. By Country

            14.4.1.1. United States of America

            14.4.1.2. Canada

            14.4.1.3. Rest of North America

        14.4.2. By Insurance Type

        14.4.3. By Component

        14.4.4. By Insurance coverage

        14.4.5. By Organization Size

        14.4.6. By End User

    14.5. Market Attractiveness Analysis

        14.5.1. By Country

        14.5.2. By Insurance Type

        14.5.3. By Component

        14.5.4. By Insurance coverage

        14.5.5. By Organization Size

        14.5.6. By End User

15. Latin America Market Analysis 2015 to 2021 and Forecast 2022 to 2032

    15.1. Introduction

    15.2. Pricing Analysis

    15.3. Historical Market Value (US$ Million) and Trend Analysis By Market Taxonomy, 2015 to 2021

    15.4. Market Value (US$ Million) & Forecast By Market Taxonomy, 2022 to 2032

        15.4.1. By Country

            15.4.1.1. Brazil

            15.4.1.2. Mexico

            15.4.1.3. Rest of Latin America

        15.4.2. By Insurance Type

        15.4.3. By Component

        15.4.4. By Insurance coverage

        15.4.5. By Organization Size

        15.4.6. By End User

    15.5. Market Attractiveness Analysis

        15.5.1. By Country

        15.5.2. By Insurance Type

        15.5.3. By Component

        15.5.4. By Insurance coverage

        15.5.5. By Organization Size

        15.5.6. By End User

16. Europe Market Analysis 2015 to 2021 and Forecast 2022 to 2032

    16.1. Introduction

    16.2. Pricing Analysis

    16.3. Historical Market Value (US$ Million) and Trend Analysis By Market Taxonomy, 2015 to 2021

    16.4. Market Value (US$ Million) & Forecast By Market Taxonomy, 2022 to 2032

        16.4.1. By Country

            16.4.1.1. Germany

            16.4.1.2. France

            16.4.1.3. United Kingdom

            16.4.1.4. Italy

            16.4.1.5. Russia

            16.4.1.6. Rest of Europe

        16.4.2. By Insurance Type

        16.4.3. By Component

        16.4.4. By Insurance coverage

        16.4.5. By Organization Size

        16.4.6. By End User

    16.5. Market Attractiveness Analysis

        16.5.1. By Country

        16.5.2. By Insurance Type

        16.5.3. By Component

        16.5.4. By Insurance coverage

        16.5.5. By Organization Size

        16.5.6. By End User

17. Asia Pacific Market Analysis 2015 to 2021 and Forecast 2022 to 2032

    17.1. Introduction

    17.2. Pricing Analysis

    17.3. Historical Market Value (US$ Million) and Trend Analysis By Market Taxonomy, 2015 to 2021

    17.4. Market Value (US$ Million) & Forecast By Market Taxonomy, 2022 to 2032

        17.4.1. By Country

            17.4.1.1. China

            17.4.1.2. Japan

            17.4.1.3. South Korea

            17.4.1.4. Rest of Asia Pacific

        17.4.2. By Insurance Type

        17.4.3. By Component

        17.4.4. By Insurance coverage

        17.4.5. By Organization Size

        17.4.6. By End User

    17.5. Market Attractiveness Analysis

        17.5.1. By Country

        17.5.2. By Insurance Type

        17.5.3. By Component

        17.5.4. By Insurance coverage

        17.5.5. By Organization Size

        17.5.6. By End User

18. Middle East and Africa Market Analysis 2015 to 2021 and Forecast 2022 to 2032

    18.1. Introduction

    18.2. Pricing Analysis

    18.3. Historical Market Value (US$ Million) and Trend Analysis By Market Taxonomy, 2015 to 2021

    18.4. Market Value (US$ Million) & Forecast By Market Taxonomy, 2022 to 2032

        18.4.1. By Country

            18.4.1.1. GCC Countries

            18.4.1.2. South Africa

            18.4.1.3. Turkey

            18.4.1.4. Rest of Middle East and Africa

        18.4.2. By Insurance Type

        18.4.3. By Component

        18.4.4. By Insurance coverage

        18.4.5. By Organization Size

        18.4.6. By End User

    18.5. Market Attractiveness Analysis

        18.5.1. By Country

        18.5.2. By Insurance Type

        18.5.3. By Component

        18.5.4. By Insurance coverage

        18.5.5. By Organization Size

        18.5.6. By End User

19. Key Countries Market Analysis 2015 to 2021 and Forecast 2022 to 2032

    19.1. Introduction

        19.1.1. Market Value Proportion Analysis, By Key Countries

        19.1.2. Global Vs. Country Growth Comparison

    19.2. US Market Analysis

        19.2.1. Value Proportion Analysis by Market Taxonomy

        19.2.2. Value & Analysis and Forecast by Market Taxonomy, 2015 to 2032

            19.2.2.1. By Insurance Type

            19.2.2.2. By Component

            19.2.2.3. By Insurance coverage

            19.2.2.4. By Organization Size

            19.2.2.5. By End User

    19.3. Canada Market Analysis

        19.3.1. Value Proportion Analysis by Market Taxonomy

        19.3.2. Value & Analysis and Forecast by Market Taxonomy, 2015 to 2032

            19.3.2.1. By Insurance Type

            19.3.2.2. By Component

            19.3.2.3. By Insurance coverage

            19.3.2.4. By Organization Size

            19.3.2.5. By End User

    19.4. Mexico Market Analysis

        19.4.1. Value Proportion Analysis by Market Taxonomy

        19.4.2. Value & Analysis and Forecast by Market Taxonomy, 2015 to 2032

            19.4.2.1. By Insurance Type

            19.4.2.2. By Component

            19.4.2.3. By Insurance coverage

            19.4.2.4. By Organization Size

            19.4.2.5. By End User

    19.5. Brazil Market Analysis

        19.5.1. Value Proportion Analysis by Market Taxonomy

        19.5.2. Value & Analysis and Forecast by Market Taxonomy, 2015 to 2032

            19.5.2.1. By Insurance Type

            19.5.2.2. By Component

            19.5.2.3. By Insurance coverage

            19.5.2.4. By Organization Size

            19.5.2.5. By End User

    19.6. Germany Market Analysis

        19.6.1. Value Proportion Analysis by Market Taxonomy

        19.6.2. Value & Analysis and Forecast by Market Taxonomy, 2015 to 2032

            19.6.2.1. By Insurance Type

            19.6.2.2. By Component

            19.6.2.3. By Insurance coverage

            19.6.2.4. By Organization Size

            19.6.2.5. By End User

    19.7. France Market Analysis

        19.7.1. Value Proportion Analysis by Market Taxonomy

        19.7.2. Value & Analysis and Forecast by Market Taxonomy, 2015 to 2032

            19.7.2.1. By Insurance Type

            19.7.2.2. By Component

            19.7.2.3. By Insurance coverage

            19.7.2.4. By Organization Size

            19.7.2.5. By End User

    19.8. Italy Market Analysis

        19.8.1. Value Proportion Analysis by Market Taxonomy

        19.8.2. Value & Analysis and Forecast by Market Taxonomy, 2015 to 2032

            19.8.2.1. By Insurance Type

            19.8.2.2. By Component

            19.8.2.3. By Insurance coverage

            19.8.2.4. By Organization Size

            19.8.2.5. By End User

    19.9. Russia Market Analysis

        19.9.1. Value Proportion Analysis by Market Taxonomy

        19.9.2. Value & Analysis and Forecast by Market Taxonomy, 2015 to 2032

            19.9.2.1. By Insurance Type

            19.9.2.2. By Component

            19.9.2.3. By Insurance coverage

            19.9.2.4. By Organization Size

            19.9.2.5. By End User

    19.10. UK Market Analysis

        19.10.1. Value Proportion Analysis by Market Taxonomy

        19.10.2. Value & Analysis and Forecast by Market Taxonomy, 2015 to 2032

            19.10.2.1. By Insurance Type

            19.10.2.2. By Component

            19.10.2.3. By Insurance coverage

            19.10.2.4. By Organization Size

            19.10.2.5. By End User

    19.11. China Market Analysis

        19.11.1. Value Proportion Analysis by Market Taxonomy

        19.11.2. Value & Analysis and Forecast by Market Taxonomy, 2015 to 2032

            19.11.2.1. By Insurance Type

            19.11.2.2. By Component

            19.11.2.3. By Insurance coverage

            19.11.2.4. By Organization Size

            19.11.2.5. By End User

    19.12. Japan Market Analysis

        19.12.1. Value Proportion Analysis by Market Taxonomy

        19.12.2. Value & Analysis and Forecast by Market Taxonomy, 2015 to 2032

            19.12.2.1. By Insurance Type

            19.12.2.2. By Component

            19.12.2.3. By Insurance coverage

            19.12.2.4. By Organization Size

            19.12.2.5. By End User

    19.13. South Korea Market Analysis

        19.13.1. Value Proportion Analysis by Market Taxonomy

        19.13.2. Value & Analysis and Forecast by Market Taxonomy, 2015 to 2032

            19.13.2.1. By Insurance Type

            19.13.2.2. By Component

            19.13.2.3. By Insurance coverage

            19.13.2.4. By Organization Size

            19.13.2.5. By End User

    19.14. GCC Countries Market Analysis

        19.14.1. Value Proportion Analysis by Market Taxonomy

        19.14.2. Value & Analysis and Forecast by Market Taxonomy, 2015 to 2032

            19.14.2.1. By Insurance Type

            19.14.2.2. By Component

            19.14.2.3. By Insurance coverage

            19.14.2.4. By Organization Size

            19.14.2.5. By End User

    19.15. South Africa Market Analysis

        19.15.1. Value Proportion Analysis by Market Taxonomy

        19.15.2. Value & Analysis and Forecast by Market Taxonomy, 2015 to 2032

            19.15.2.1. By Insurance Type

            19.15.2.2. By Component

            19.15.2.3. By Insurance coverage

            19.15.2.4. By Organization Size

            19.15.2.5. By End User

    19.16. Turkey Market Analysis

        19.16.1. Value Proportion Analysis by Market Taxonomy

        19.16.2. Value & Analysis and Forecast by Market Taxonomy, 2015 to 2032

            19.16.2.1. By Insurance Type

            19.16.2.2. By Component

            19.16.2.3. By Insurance coverage

            19.16.2.4. By Organization Size

            19.16.2.5. By End User

        19.16.3. Competition Landscape and Player Concentration in the Country

20. Market Structure Analysis

    20.1. Market Analysis by Tier of Companies

    20.2. Market Concentration

    20.3. Market Share Analysis of Top Players

    20.4. Market Presence Analysis

        20.4.1. By Regional Footprint of Players

        20.4.2. Product Footprint by Players

21. Competition Analysis

    21.1. Competition Dashboard

    21.2. Competition Benchmarking

    21.3. Competition Deep Dive

        21.3.1. BitSight

            21.3.1.1. Overview

            21.3.1.2. Product Portfolio

            21.3.1.3. Sales Footprint

            21.3.1.4. Strategy Overview

        21.3.2. Prevalent

            21.3.2.1. Overview

            21.3.2.2. Product Portfolio

            21.3.2.3. Sales Footprint

            21.3.2.4. Strategy Overview

        21.3.3. RedSeal

            21.3.3.1. Overview

            21.3.3.2. Product Portfolio

            21.3.3.3. Sales Footprint

            21.3.3.4. Strategy Overview

        21.3.4. SecurityScorecard

            21.3.4.1. Overview

            21.3.4.2. Product Portfolio

            21.3.4.3. Sales Footprint

            21.3.4.4. Strategy Overview

        21.3.5. Cyber IndeMillionity Solutions

            21.3.5.1. Overview

            21.3.5.2. Product Portfolio

            21.3.5.3. Sales Footprint

            21.3.5.4. Strategy Overview

        21.3.6. Allianz

            21.3.6.1. Overview

            21.3.6.2. Product Portfolio

            21.3.6.3. Sales Footprint

            21.3.6.4. Strategy Overview

        21.3.7. AIG

            21.3.7.1. Overview

            21.3.7.2. Product Portfolio

            21.3.7.3. Sales Footprint

            21.3.7.4. Strategy Overview

        21.3.8. Aon

            21.3.8.1. Overview

            21.3.8.2. Product Portfolio

            21.3.8.3. Sales Footprint

            21.3.8.4. Strategy Overview

        21.3.9. Arthur J. Gallagher & Co

            21.3.9.1. Overview

            21.3.9.2. Product Portfolio

            21.3.9.3. Sales Footprint

            21.3.9.4. Strategy Overview

        21.3.10. Travelers Insurance

            21.3.10.1. Overview

            21.3.10.2. Product Portfolio

            21.3.10.3. Sales Footprint

            21.3.10.4. Strategy Overview

        21.3.11. AXA XL

            21.3.11.1. Overview

            21.3.11.2. Product Portfolio

            21.3.11.3. Sales Footprint

            21.3.11.4. Strategy Overview

        21.3.12. AXIS Capital

            21.3.12.1. Overview

            21.3.12.2. Product Portfolio

            21.3.12.3. Sales Footprint

            21.3.12.4. Strategy Overview

22. Assumptions and Acronyms Used

23. Research Methodology

Don't pay for what you don't need

Customize your report by selecting specific countries or regions and save 30%!

List of Tables

Table 01: Global Market Value (US$ Million), By Insurance Type, 2015 to 2021

Table 02: Global Market Value (US$ Million), By Insurance Type, 2022 to 2032

Table 03: Global Market Value (US$ Million), By Component, 2015 to 2021

Table 04: Global Market Value (US$ Million), By Component, 2022 to 2032

Table 05: Global Market Value (US$ Million), By Insurance Coverage, 2015 to 2021

Table 06: Global Market Value (US$ Million), By Insurance Coverage, 2022 to 2032

Table 07: Global Market Value (US$ Million), By End User, 2015 to 2021

Table 08: Global Market Value (US$ Million), By End User, 2022 to 2032

Table 09: Global Market Value (US$ Million), By Organization Size, 2015 to 2021

Table 10: Global Market Value (US$ Million), By Organization Size, 2022 to 2032

Table 11: Global Market, By Region, 2015 to 2021

Table 12: Global Market, By Region, 2022 to 2032

Table 13: North America Market Value (US$ Million), By Insurance Type, 2015 to 2021

Table 14: North America Market Value (US$ Million), By Insurance Type, 2022 to 2032

Table 15: North America Market Value (US$ Million), By Component, 2015 to 2021

Table 16: North America Market Value (US$ Million), By Component, 2022 to 2032

Table 17: North America Market Value (US$ Million), By Insurance Coverage, 2015 to 2021

Table 18: North America Market Value (US$ Million), By Insurance Coverage, 2022 to 2032

Table 19: North America Market Value (US$ Million), By End User, 2015 to 2021

Table 20: North America Market Value (US$ Million), By End User, 2022 to 2032

Table 21: North America Market Value (US$ Million), By Organization Size, 2015 to 2021

Table 22: North America Market Value (US$ Million), By Organization Size, 2022 to 2032

Table 23: North America Market, By Country, 2015 to 2021

Table 24: North America Market, By Country, 2022 to 2032

Table 25: Latin America Market Value (US$ Million), By Insurance Type, 2015 to 2021

Table 26: Latin America Market Value (US$ Million), By Insurance Type, 2022 to 2032

Table 27: Latin America Market Value (US$ Million), By Component, 2015 to 2021

Table 28: Latin America Market Value (US$ Million), By Component, 2022 to 2032

Table 29: Latin America Market Value (US$ Million), By Insurance Coverage, 2015 to 2021

Table 30: Latin America Market Value (US$ Million), By Insurance Coverage, 2022 to 2032

Table 31: Latin America Market Value (US$ Million), By End User, 2015 to 2021

Table 32: Latin America Market Value (US$ Million), By End User, 2022 to 2032

Table 33: Latin America Market Value (US$ Million), By Organization Size, 2015 to 2021

Table 34: Latin America Market Value (US$ Million), By Organization Size, 2022 to 2032

Table 35: Latin America Market, By Country, 2015 to 2021

Table 36: Latin America Market, By Country, 2022 to 2032

Table 37: Europe Market Value (US$ Million), By Insurance Type, 2015 to 2021

Table 38: Europe Market Value (US$ Million), By Insurance Type, 2022 to 2032

Table 39: Europe Market Value (US$ Million), By Component, 2015 to 2021

Table 40: Europe Market Value (US$ Million), By Component, 2022 to 2032

Table 41: Europe Market Value (US$ Million), By Insurance Coverage, 2015 to 2021

Table 42: Europe Market Value (US$ Million), By Insurance Coverage, 2022 to 2032

Table 43: Europe Market Value (US$ Million), By End User, 2015 to 2021

Table 44: Europe Market Value (US$ Million), By End User, 2022 to 2032

Table 45: Europe Market Value (US$ Million), By Organization Size, 2015 to 2021

Table 46: Europe Market Value (US$ Million), By Organization Size, 2022 to 2032

Table 47: Europe Market, By Country, 2015 to 2021

Table 48: Europe Market, By Country, 2022 to 2032

Table 49: Asia Pacific Market Value (US$ Million), By Insurance Type, 2015 to 2021

Table 50: Asia Pacific Market Value (US$ Million), By Insurance Type, 2022 to 2032

Table 51: Asia Pacific Market Value (US$ Million), By Component, 2015 to 2021

Table 52: Asia Pacific Market Value (US$ Million), By Component, 2022 to 2032

Table 53: Asia Pacific Market Value (US$ Million), By Insurance Coverage, 2015 to 2021

Table 54: Asia Pacific Market Value (US$ Million), By Insurance Coverage, 2022 to 2032

Table 55: Asia Pacific Market Value (US$ Million), By End User, 2015 to 2021

Table 56: Asia Pacific Market Value (US$ Million), By End User, 2022 to 2032

Table 57: Asia Pacific Market Value (US$ Million), By Organization Size, 2015 to 2021

Table 58: Asia Pacific Market Value (US$ Million), By Organization Size, 2022 to 2032

Table 59: Asia Pacific Market, By Country, 2015 to 2021

Table 60: Asia Pacific Market, By Country, 2022 to 2032

Table 61: MEA Market Value (US$ Million), By Insurance Type, 2015 to 2021

Table 62: MEA Market Value (US$ Million), By Insurance Type, 2022 to 2032

Table 63: MEA Market Value (US$ Million), By Component, 2015 to 2021

Table 64: MEA Market Value (US$ Million), By Component, 2022 to 2032

Table 65: MEA Market Value (US$ Million), By Insurance Coverage, 2015 to 2021

Table 66: MEA Market Value (US$ Million), By Insurance Coverage, 2022 to 2032

Table 67: MEA Market Value (US$ Million), By End User, 2015 to 2021

Table 68: MEA Market Value (US$ Million), By End User, 2022 to 2032

Table 69: MEA Market Value (US$ Million), By Organization Size, 2015 to 2021

Table 70: MEA Market Value (US$ Million), By Organization Size, 2022 to 2032

Table 71: MEA Market, By Country, 2015 to 2021

Table 72: MEA Market, By Country, 2022 to 2032
Sudip Saha
Sudip Saha

Principal Consultant

Talk to Analyst

Find your sweet spots for generating winning opportunities in this market.

List of Charts

Figure 01: Global Market Value (US$ Million) and Year-on-Year Growth, 2015 to 2032

Figure 02: Global Market Absolute $ Historical Gain (2015 to 2021) and Opportunity (2022 to 2032), US$ Million

Figure 03: Global Market Share, By Insurance Type, 2022 & 2032

Figure 04: Global Market Y-o-Y Growth Projections, By Insurance Type - 2022 to 2032

Figure 05: Global Market Attractiveness Index, By Insurance Type - 2022 to 2032

Figure 06: Global Market Share, By Component, 2022 & 2032

Figure 07: Global Market Y-o-Y Growth Projections, By Component - 2022 to 2032

Figure 08: Global Market Attractiveness Index, By Component - 2022 to 2032

Figure 09: Global Market Share, By End User, 2022 & 2032

Figure 10: Global Market Y-o-Y Growth Projections, By End User - 2022 to 2032

Figure 11: Global Market Attractiveness Index, By End User - 2022 to 2032

Figure 12: Global Market Share, By Insurance Coverage, 2022 & 2032

Figure 13: Global Market Y-o-Y Growth Projections, By Insurance Coverage - 2022 to 2032

Figure 14: Global Market Attractiveness Index, By Insurance Coverage - 2022 to 2032

Figure 15: Global Market Share, By Organization Size, 2022 & 2032

Figure 16: Global Market Y-o-Y Growth Projections, By Organization Size - 2022 to 2032

Figure 17: Global Market Attractiveness Index, By Organization Size - 2022 to 2032

Figure 18: Global Market Share, By Region, 2022 & 2032

Figure 19: Global Market Y-o-Y Growth Projections, By Region - 2022 to 2032

Figure 20: Global Market Attractiveness Index, By Region - 2022 to 2032

Figure 21: North America Market Value (US$ Million) and Year-on-Year Growth, 2015 to 2032

Figure 22: North America Market Absolute $ Historical Gain (2015 to 2021) and Opportunity (2022 to 2032), US$ Million

Figure 23: North America Market Share, By Insurance Type, 2022 & 2032

Figure 24: North America Market Y-o-Y Growth Projections, By Insurance Type - 2022 to 2032

Figure 25: North America Market Attractiveness Index, By Insurance Type - 2022 to 2032

Figure 26: North America Market Share, By Component, 2022 & 2032

Figure 27: North America Market Y-o-Y Growth Projections, By Component - 2022 to 2032

Figure 28: North America Market Attractiveness Index, By Component - 2022 to 2032

Figure 29: North America Market Share, By End User, 2022 & 2032

Figure 30: North America Market Y-o-Y Growth Projections, By End User - 2022 to 2032

Figure 31: North America Market Attractiveness Index, By End User - 2022 to 2032

Figure 32: North America Market Share, By Insurance Coverage, 2022 & 2032

Figure 33: North America Market Y-o-Y Growth Projections, By Insurance Coverage - 2022 to 2032

Figure 34: North America Market Attractiveness Index, By Insurance Coverage - 2022 to 2032

Figure 35: North America Market Share, By Organization Size, 2022 & 2032

Figure 36: North America Market Y-o-Y Growth Projections, By Organization Size - 2022 to 2032

Figure 37: North America Market Attractiveness Index, By Organization Size - 2022 to 2032

Figure 38: North America Market Share, By Country, 2022 & 2032

Figure 39: North America Market Y-o-Y Growth Projections, By Country - 2022 to 2032

Figure 40: North America Market Attractiveness Index, By Country - 2022 to 2032

Figure 41: Latin America Market Value (US$ Million) and Year-on-Year Growth, 2015 to 2032

Figure 42: Latin America Market Absolute $ Historical Gain (2015 to 2021) and Opportunity (2022 to 2032), US$ Million

Figure 43: Latin America Market Share, By Insurance Type, 2022 & 2032

Figure 44: Latin America Market Y-o-Y Growth Projections, By Insurance Type - 2022 to 2032

Figure 45: Latin America Market Attractiveness Index, By Insurance Type - 2022 to 2032

Figure 46: Latin America Market Share, By Component, 2022 & 2032

Figure 47: Latin America Market Y-o-Y Growth Projections, By Component - 2022 to 2032

Figure 48: Latin America Market Attractiveness Index, By Component - 2022 to 2032

Figure 49: Latin America Market Share, By End User, 2022 & 2032

Figure 50: Latin America Market Y-o-Y Growth Projections, By End User - 2022 to 2032

Figure 51: Latin America Market Attractiveness Index, By End User - 2022 to 2032

Figure 52: Latin America Market Share, By Insurance Coverage, 2022 & 2032

Figure 53: Latin America Market Y-o-Y Growth Projections, By Insurance Coverage - 2022 to 2032

Figure 54: Latin America Market Attractiveness Index, By Insurance Coverage - 2022 to 2032

Figure 55: Latin America Market Share, By Organization Size, 2022 & 2032

Figure 56: Latin America Market Y-o-Y Growth Projections, By Organization Size - 2022 to 2032

Figure 57: Latin America Market Attractiveness Index, By Organization Size - 2022 to 2032

Figure 58: Latin America Market Share, By Country, 2022 & 2032

Figure 59: Latin America Market Y-o-Y Growth Projections, By Country - 2022 to 2032

Figure 60: Latin America Market Attractiveness Index, By Country - 2022 to 2032

Figure 61: Europe Market Value (US$ Million) and Year-on-Year Growth, 2015 to 2032

Figure 62: Europe Market Absolute $ Historical Gain (2015 to 2021) and Opportunity (2022 to 2032), US$ Million

Figure 63: Europe Market Share, By Insurance Type, 2022 & 2032

Figure 64: Europe Market Y-o-Y Growth Projections, By Insurance Type - 2022 to 2032

Figure 65: Europe Market Attractiveness Index, By Insurance Type - 2022 to 2032

Figure 66: Europe Market Share, By Component, 2022 & 2032

Figure 67: Europe Market Y-o-Y Growth Projections, By Component - 2022 to 2032

Figure 68: Europe Market Attractiveness Index, By Component - 2022 to 2032

Figure 69: Europe Market Share, By End User, 2022 & 2032

Figure 70: Europe Market Y-o-Y Growth Projections, By End User - 2022 to 2032

Figure 71: Europe Market Attractiveness Index, By End User - 2022 to 2032

Figure 72: Europe Market Share, By Insurance Coverage, 2022 & 2032

Figure 73: Europe Market Y-o-Y Growth Projections, By Insurance Coverage - 2022 to 2032

Figure 74: Europe Market Attractiveness Index, By Insurance Coverage - 2022 to 2032

Figure 75: Europe Market Share, By Organization Size, 2022 & 2032

Figure 76: Europe Market Y-o-Y Growth Projections, By Organization Size - 2022 to 2032

Figure 77: Europe Market Attractiveness Index, By Organization Size - 2022 to 2032

Figure 78: Europe Market Share, By Country, 2022 & 2032

Figure 79: Europe Market Y-o-Y Growth Projections, By Country - 2022 to 2032

Figure 80: Europe Market Attractiveness Index, By Country - 2022 to 2032

Figure 81: Asia Pacific Market Value (US$ Million) and Year-on-Year Growth, 2015 to 2032

Figure 82: Asia Pacific Market Absolute $ Historical Gain (2015 to 2021) and Opportunity (2022 to 2032), US$ Million

Figure 83: Asia Pacific Market Share, By Insurance Type, 2022 & 2032

Figure 84: Asia Pacific Market Y-o-Y Growth Projections, By Insurance Type - 2022 to 2032

Figure 85: Asia Pacific Market Attractiveness Index, By Insurance Type - 2022 to 2032

Figure 86: Asia Pacific Market Share, By Component, 2022 & 2032

Figure 87: Asia Pacific Market Y-o-Y Growth Projections, By Component - 2022 to 2032

Figure 88: Asia Pacific Market Attractiveness Index, By Component - 2022 to 2032

Figure 89: Asia Pacific Market Share, By End User, 2022 & 2032

Figure 90: Asia Pacific Market Y-o-Y Growth Projections, By End User - 2022 to 2032

Figure 91: Asia Pacific Market Attractiveness Index, By End User - 2022 to 2032

Figure 92: Asia Pacific Market Share, By Insurance Coverage, 2022 & 2032

Figure 93: Asia Pacific Market Y-o-Y Growth Projections, By Insurance Coverage - 2022 to 2032

Figure 94: Asia Pacific Market Attractiveness Index, By Insurance Coverage - 2022 to 2032

Figure 95: Asia Pacific Market Share, By Organization Size, 2022 & 2032

Figure 96: Asia Pacific Market Y-o-Y Growth Projections, By Organization Size - 2022 to 2032

Figure 97: Asia Pacific Market Attractiveness Index, By Organization Size - 2022 to 2032

Figure 98: Asia Pacific Market Share, By Country, 2022 & 2032

Figure 99: Asia Pacific Market Y-o-Y Growth Projections, By Country - 2022 to 2032

Figure 100: Asia Pacific Market Attractiveness Index, By Country - 2022 to 2032

Figure 101: MEA Market Value (US$ Million) and Year-on-Year Growth, 2015 to 2032

Figure 102: MEA Market Absolute $ Historical Gain (2015 to 2021) and Opportunity (2022 to 2032), US$ Million

Figure 103: MEA Market Share, By Insurance Type, 2022 & 2032

Figure 104: MEA Market Y-o-Y Growth Projections, By Insurance Type - 2022 to 2032

Figure 105: MEA Market Attractiveness Index, By Insurance Type - 2022 to 2032

Figure 106: MEA Market Share, By Component, 2022 & 2032

Figure 107: MEA Market Y-o-Y Growth Projections, By Component - 2022 to 2032

Figure 108: MEA Market Attractiveness Index, By Component - 2022 to 2032

Figure 109: MEA Market Share, By End User, 2022 & 2032

Figure 110: MEA Market Y-o-Y Growth Projections, By End User - 2022 to 2032

Figure 111: MEA Market Attractiveness Index, By End User - 2022 to 2032

Figure 112: MEA Market Share, By Insurance Coverage, 2022 & 2032

Figure 113: MEA Market Y-o-Y Growth Projections, By Insurance Coverage - 2022 to 2032

Figure 114: MEA Market Attractiveness Index, By Insurance Coverage - 2022 to 2032

Figure 115: MEA Market Share, By Organization Size, 2022 & 2032

Figure 116: MEA Market Y-o-Y Growth Projections, By Organization Size - 2022 to 2032

Figure 117: MEA Market Attractiveness Index, By Organization Size - 2022 to 2032

Figure 118: MEA Market Share, By Country, 2022 & 2032

Figure 119: MEA Market Y-o-Y Growth Projections, By Country - 2022 to 2032

Figure 120: MEA Market Attractiveness Index, By Country - 2022 to 2032

Recommendations

Technology

CDN Security Market

Published : October 2023

Technology

Cyber Security in Robotics Market

Published : April 2023

Explore Technology Insights

View Reports

Cybersecurity Insurance Market