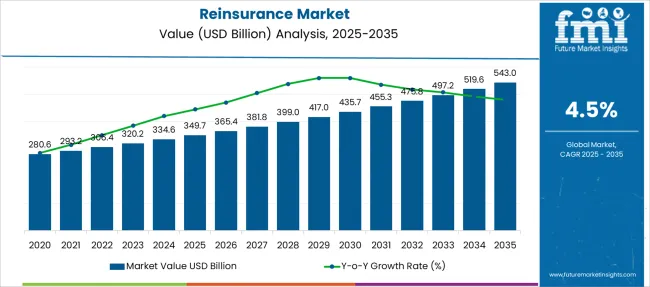
The Reinsurance Market is estimated to be valued at USD 349.7 billion in 2025 and is projected to reach USD 543.0 billion by 2035, registering a compound annual growth rate (CAGR) of 4.5% over the forecast period.
| Metric | Value |
|---|---|
| Reinsurance Market Estimated Value in (2025 E) | USD 349.7 billion |
| Reinsurance Market Forecast Value in (2035 F) | USD 543.0 billion |
| Forecast CAGR (2025 to 2035) | 4.5% |
The reinsurance market is experiencing steady growth fueled by the increasing complexity of risks and the expanding need for risk transfer solutions. The rise in natural disasters and global economic uncertainties have intensified the demand for reinsurance coverage that can provide financial stability to insurers.
Market participants have focused on improving risk management frameworks and expanding capacity to address growing exposures. Distribution channels have evolved to prioritize brokers who play a crucial role in connecting primary insurers with reinsurers and structuring tailored coverage.
Additionally, regulatory developments and the increasing frequency of large claims have influenced the market dynamics. The future outlook points to growth driven by innovation in reinsurance products, emerging market penetration, and the broadening scope of insurable risks. Segment growth is expected to be led by brokers in the distribution channel and non-life/property and casualty reinsurance as the dominant end-user segment.
The market is segmented by Distribution Channel and End-User and region. By Distribution Channel, the market is divided into Broker and Direct Writing. In terms of End-User, the market is classified into Non-Life/Property & Casualty Reinsurance and Life & Health Reinsurance. Regionally, the market is classified into North America, Latin America, Western Europe, Eastern Europe, Balkan & Baltic Countries, Russia & Belarus, Central Asia, East Asia, South Asia & Pacific, and the Middle East & Africa.
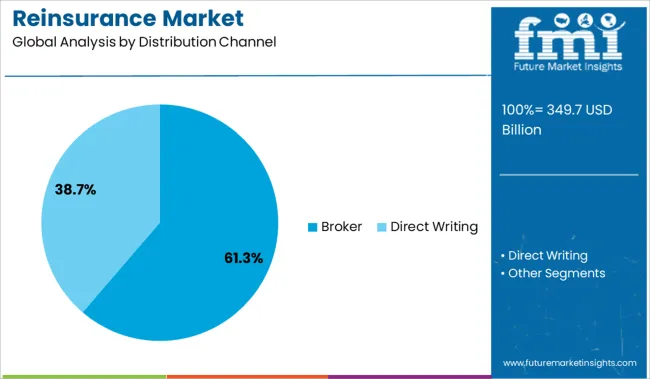
The Broker segment is projected to account for 61.3% of the reinsurance market revenue in 2025, maintaining its dominance as the primary distribution channel. This growth is attributed to brokers’ expertise in navigating complex risk portfolios and their ability to negotiate favorable terms on behalf of insurers. Brokers act as intermediaries who facilitate efficient market access and ensure customized reinsurance solutions.
Their advisory role in structuring coverage and risk placement has strengthened their position. The segment has also benefited from the growing demand for advisory services in emerging markets and specialized reinsurance products.
As insurers increasingly rely on brokers to manage their reinsurance needs effectively, the Broker segment is expected to retain its leading role in the distribution landscape.
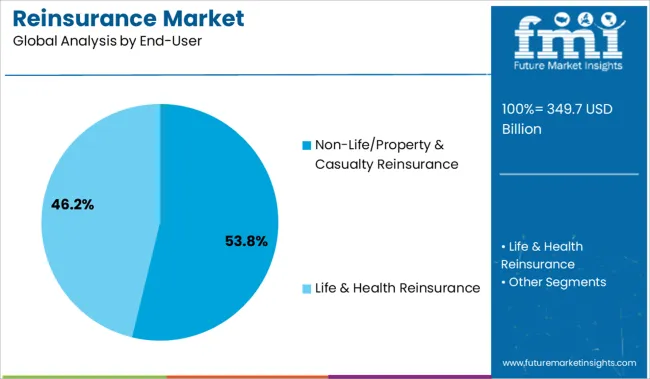
The Non-Life/Property & Casualty Reinsurance segment is projected to contribute 53.8% of the market revenue in 2025, establishing itself as the largest end-user segment. Growth in this segment is driven by the heightened exposure of insurers to property and casualty risks resulting from natural disasters, industrial accidents, and liability claims.
The need for capital relief and risk diversification has made non-life reinsurance an essential component of insurers’ risk management strategies. Additionally, regulatory requirements for solvency and risk retention have prompted increased reinsurance purchasing.
The segment has benefited from advancements in risk modeling and catastrophe prediction, enabling more accurate pricing and coverage structuring. As risk complexity and frequency rise, the Non-Life/Property & Casualty Reinsurance segment is expected to sustain its market leadership.
As per the Reinsurance Market research by Future Market Insights - a market research and competitive intelligence provider, historically, from 2020 to 2024, market value of the Reinsurance Market increased at around 4.9% CAGR.
Reinsurance, like primary markets, is experiencing an oversupply of capital. Almost all global reinsurance firms have expanded their footprint, seeking to do more business in Asia and Latin America, while "local" and regional firms have also sought to expand globally, beyond their home markets. Furthermore, over the last decade, the distinction between primary insurance and reinsurance has blurred, with most companies offering both. Only a few pure-play reinsurance companies offer both non-life and life/health coverage.
The corporate sector requires indemnification in the event of major losses, and consumers seek asset protection in an era of rising crime, as well as health care and retirement income, as economic and social conditions involving liberalization, privatization, and de-monopolization stimulate demand for insurance.
Most countries permit reinsurers to operate independently on both domestic and international level. Some companies, however, limit individual insurers' placement to a single reinsurer or market. To name a few, Latvia, Lithuania, Moldova, Romania, and Slovenia require international placement only when domestic reinsurers are unable to acknowledge the industry.
The reinsurance industry is experiencing a new normal as a result of this digital transformation. Customers are becoming more aware of digital risks, and there is a growing demand for greater digital transparency and accountability. Digital trust and confidence in data handling are required for digital technologies to reach their full potential. Swiss Re is one of only two companies that have had their digital products tested and certified by the Swiss Digital Initiative's Digital Trust Label, which is the world's first digital responsibility label. Under the Swiss Digital Trust Label, a person can identify trustworthy digital services, and digital service providers can confidently proclaim one's digital obligation.
The current pricing movement is influenced by rising loss cost inflation, natural calamities, and historically low investment gains. Market discipline has increased as a result of an uncertain economic environment and natural disasters, including tighter terms and conditions. Hurricane Katrina's economic toll was estimated to be more than USD 160 Billion. Insurance companies in the United States paid USD 41 Billion on 1.7 Million claims, and an additional USD 8 Billion for damage to offshore energy facilities in the Gulf of Mexico. Hurricane Katrina resulted in total insured losses of more than USD 65 Billion, including USD 16.3 Billion in publicly insured losses to FEMA's National Flood Insurance Program. Now it can be estimated at nearly USD 86 Billion after considering inflation.
As primary carriers seek consistent results and operational efficiencies in an uncertain environment, demand for reinsurance capacity is rising. Unfavorable loss cost trends and increased catastrophe activity continue to dampen capital returns, highlighting the need for further rate hikes. After several years of significant property disaster events, as well as commodity and labour demand surges and near-term inflation, third-party capital has become cautious. Life reinsurance markets are dominated by a few well-capitalized firms, resulting in less competitive pressure.
Increased adoption of artificial intelligence and machine learning in various sectors stimulated various reinsurance companies to adopt it in their operations. With its new CertAI validation service, Munich Re is increasing the acceptance of artificial intelligence and paving the way for responsible AI application use. Companies from a variety of industries are investing in R&D and artificial intelligence deployment in order to capitalize on promising business opportunities. CertAI validates the trustworthiness of artificial intelligence in new product solutions in an independent and objective manner, demonstrating its quality to clients, investors, and regulatory authorities.
Asia Pacific is the most lucrative region with the highest projected growth. Demographic development and digital transformation dynamics are expected to drive significant business growth for reinsurance companies in APAC in the future. There is also opportunities to close the protection gap in low-insurance-penetration countries as the companies share their extensive product knowledge with regional clients and offer solutions based on their professional insurance expertise.
Asia Pacific Reinsurance market has increased as domestic insurers seek financial resources to cover massive risks. China and India have been among the fastest growing life and general insurance markets in the world. Domestic reinsurer revenue has increased in these countries as a result of mandatory cession regulation and a growing insurance industry. Singapore and Hong Kong have emerged as global reinsurance hubs due to their well-established regulatory frameworks and strong financial infrastructure. The headquarters of key global reinsurers such as Swiss Re, Munich Re, SCOR, and Hannover Re are located in these countries.
Climate volatility, which has exacerbated natural disaster risks, is another area of focus for reinsurers. Natural disaster losses in the region are expected to total USD 334.6 Billion in 2024, with only 4.5% insured, indicating a significant gap and opportunity for both insurance and reinsurance firms.
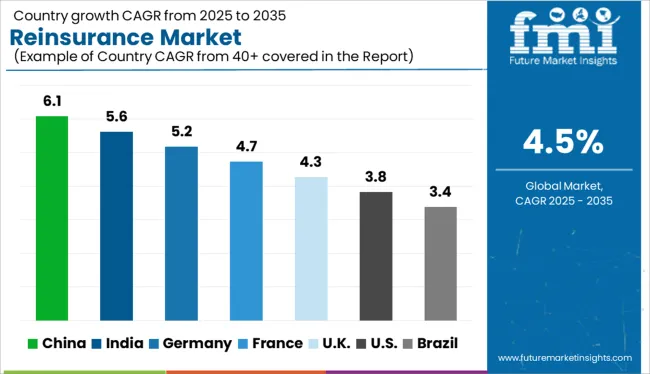
The United States is expected to have the highest market share of USD 543 Billion by the end of 2035 accounting for approximately 40% of the worldwide share. An increasing number of casualty insurers are using reinsurance to supplement their own development and capital positions. This rise in casualty reinsurance has coincided with a greater appetite for corporate reinsurance among reinsurers who had previously concentrated on assets and other short-tail lines. As the property insurance market deteriorated, the reinsurers' portfolios diversified to include casualty lines. Clients' need to support their own growth and capital has driven much of the recent growth in casualty reinsurance. Excess reinsurance demand has remained relatively stable in recent years.
Covid-19 outbreak in 2024 had also affected the reinsurance market in United States. Since the outbreak of the COVID-19 pandemic, Reinsurance Group of America has seen an increase in demand for its life reinsurance service. RGA has also seen an increase in demand for coverage and expertise, which is expected to continue as the importance of these services becomes more widely recognised.
Reinsurance revenue through Broker channels is forecasted to grow at the highest CAGR of over 4.6% during 2025-2035. The reinsurance broker's primary function is to connect the reinsured and reinsurer's insurance needs in order to secure reinsurance terms that are mutually acceptable. The reinsurance broker frequently assists the reinsured in the planning and development of its reinsurance program, such as gathering the reinsurance proposition and relevant premium and loss statistical data to present to the reinsurance market when seeking reinsurance support, proposing the reinsurer's terms and conditions, placing firm orders on the reinsurer's behalf, and preparing the reinsurance slip for the reinsured.
Brokers reporting increased demand for cyber reinsurance in 2024 across a variety of market structures, according to PartnerRe's most recent annual cyber insurance market survey. In collaboration with Advisen, PartnerRe, a Bermuda-based reinsurance firm, undertook a survey of the cyber insurance market, conducting interviews of 260 cyber insurance agents and 190 cyber underwriters globally. According to survey findings, understanding of cyber insurance coverage has significantly improved in recent years, with the consistency in pricing and coverage provided.
Simultaneously, insureds are consistently requesting higher limits of coverage from their cyber insurers, indicating that the market will continue to expand steadily.
Reinsurance revenue through Non-Life/Property & Casualty Reinsurance Companies segment is forecasted to grow at the highest CAGR of over 4.3% during 2025-2035. Technological advancements, alternative capital, financial market structuring methodologies, and the integration of value-added services with reinsurance will shape the global non-life reinsurance industry's prospects. The growth of exchange-traded secondary markets and automated placement is also affecting the non-life reinsurance industry.
The dramatic increase in demand for property and casualty reinsurance claims caused by major casualty events and natural disasters such as hurricanes, tsunamis, and storms, among others, has strained insurance companies. As a result, insurers rely more on reinsurance. Natural disasters are becoming more common, the investment environment and financial markets are volatile, and economic growth is a few of the key drivers and trends driving growth in Property and Casualty Reinsurance companies.
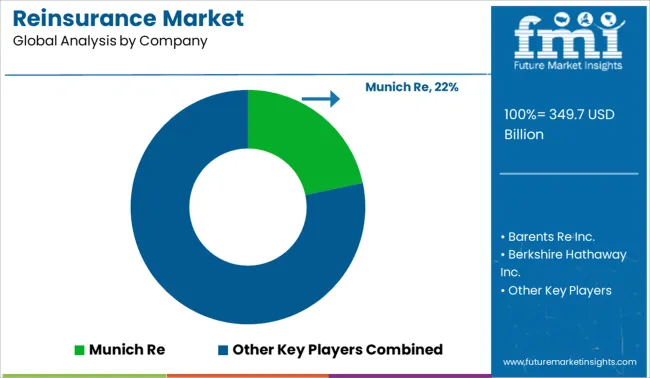
Among the leading players in the global Reinsurance market are Barents Re Reinsurance, Inc., Berkshire Hathaway Inc., BMS Group Ltd., China Reinsurance (Group) Corporation, Everest Re Group, Ltd. To gain a competitive advantage in the industry, these market players are investing in product launches, partnerships, mergers and acquisitions, and expansions.
Market growth is expected to be fueled by collaborations among current players to improve quality throughout the research period. Over the projection period, established market players are expected to diversify their portfolios and offer one-stop solutions to combat fierce competition.
In March 2025, Swiss Re and Singapore's composite insurer, NTUC Income collaborated to create the country's first longevity plan. This partnership will help NTUC Income to protect its annuity book from future fluctuations by splitting any future payments to annuitants who live longer than their age expectancy with Swiss Re. Because annuities are a long-term business, various solvency regimes may impose high capital requirements. This collaboration enables Income to increase its capital efficiency and strengthen its solvency.
In July 2024, Bluefire Insurance, a Managing General Agency, and AXA XL Reinsurance, headquartered in Bermuda fulfilled a reinsurance transaction wherein Bluefire will presume uncertainty out of its personal auto portfolio through a securitized reinsurance arrangement with AXA XL.
In February 2025, SCOR, a global reinsurer completed a USD 6.6 Billion longevity reinsurance transaction on behalf of more than 17,000 Lloyds Bank Pension Scheme No. 1 members. Since SCOR provides 100% longevity reinsurance coverage, Scottish Widows Limited, a division of Lloyds Banking Group, acts as a third-party insurer in the contract.
Similarly, recent developments related to reinsurance companies have been tracked by the team at Future Market Insights, which are available in the full report.
The global reinsurance market is estimated to be valued at USD 349.7 billion in 2025.
The market size for the reinsurance market is projected to reach USD 543.0 billion by 2035.
The reinsurance market is expected to grow at a 4.5% CAGR between 2025 and 2035.
The key product types in reinsurance market are broker and direct writing.
In terms of end-user, non-life/property & casualty reinsurance segment to command 53.8% share in the reinsurance market in 2025.


Full Research Suite comprises of:
Market outlook & trends analysis
Interviews & case studies
Strategic recommendations
Vendor profiles & capabilities analysis
5-year forecasts
8 regions and 60+ country-level data splits
Market segment data splits
12 months of continuous data updates
DELIVERED AS:
PDF EXCEL ONLINE

Thank you!
You will receive an email from our Business Development Manager. Please be sure to check your SPAM/JUNK folder too.
Chat With
MaRIA