Reports

- Global Locations -

Headquarters

Future Market Insights, Inc.

Christiana Corporate, 200
Continental Drive, Suite 401,
Newark, Delaware - 19713,
United States

T: +1-845-579-5705

Americas

Future Market Insights, Inc.

616 Corporate Way, Suite 2-9018,
Valley Cottage, NY 10989, United States

T: +1-347-918-3531

MEA

Future Market Insights

1602-6 Jumeirah Bay X2 Tower, Plot No: JLT-PH2-X2A,
Jumeirah Lakes Towers, Dubai,
United Arab Emirates

Europe

Future Market Insights

3rd Floor, 207 Regent Street,
W1B 3HH London
United Kingdom

T: + 44 (0) 20 8123 9659
D: +44 (0) 20 3287 4268

Asia Pacific

Future Market Insights

IndiaLand Global Tech Park, Unit UG-1, Behind Grand HighStreet, Phase 1, Hinjawadi, MH, Pune – 411057, India

Sales Intelligence Software Market Outlook (2022 to 2032)

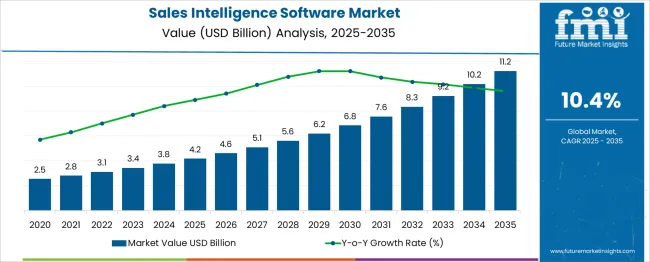
[324 Pages Report] The sales intelligence software market is anticipated to record a CAGR of 10.4% during the forecast period (2022 to 2032). The sales intelligence software market is expected to be valued at US$ 3.1 Billion in 2022 and is likely to reach US$ 8.4 Billion by 2032.

The growing momentum of the sales intelligence software market can be majorly attributed to its feature of improving the quality and quantity of sales leads by utilizing data to identify new opportunities.

The rising demand for sales intelligence software is also due to the infusion of Artificial Intelligence (AI) and machine learning (ML) capabilities to automate pre-sales processes. Increased use of company technographic to identify buying intent and improve prospecting, is expected to create numerous sales intelligence software market opportunities.

Attributes Details
Sales Intelligence Software Market CAGR (2022 to 2032) 10.4%
Sales Intelligence Software Market Value (2022) US$ 3.1 Billion
Sales Intelligence Software Market Value (2032) US$ 8.4 Billion

Don't pay for what you don't need

Customize your report by selecting specific countries or regions and save 30%!

What Are The Changes Undergone By The Sales Intelligence Software Market Due To COVID-19?

Covid-19 affected nearly every aspect of our lives, and while its personal impact is fading, pandemic-related business adaptations are likely to shape the sales intelligence software market future trends. The COVID-19 outbreak has posed numerous challenges and uncertainties to the sales intelligence software market.

On the flip side, the pandemic has had a positive impact on the sales intelligence software market growth, owing to an increase in investments by various companies in emerging technologies such as AI and machine learning.

This pandemic has also accelerated certain activities related to the speed of automation and digital transformation leading to a higher rate of adoption of sales intelligence software in several countries.

Several industry verticals have demonstrated a greater level of acceptance for digital approaches to lead generation and client interaction thereby shifting to a virtual mode, facilitating the sales intelligence software market outlook. In addition, sales intelligence software market size is enlarging as key players are leveraging technologies such as to boost productivity and resilience.

What Are The Key Sales Intelligence Software Market Dynamics?

Sales intelligence software enables businesses to make better use of internal and external data in order to increase sales and improve sales processes thereby augmenting the demand for sales intelligence software.

The rapid adoption of advanced solutions for improved customer targeting drives the global sales intelligence software market growth forward. Furthermore, sales intelligence software market key trends & opportunities are significantly fostered by the increased demand for content optimization and data enrichment tools.

However, differences in data privacy, the accuracy rate of company/client information, and industry-specific requirements stymie the sales intelligence software market size.

On the contrary, the incorporation of AI and ML capabilities to automate pre-sales processes is expected to provide lucrative sales intelligence software market opportunities during the forecast period. One of the major factors impeding the sales intelligence software adoption trends is a lack of awareness about the software.

Technological advancements are generating numerous sales intelligence software market trends and forecasts by aiding businesses in obtaining a clear picture of their clients, which is critical for effective sales and marketing.

Sudip Saha
Sudip Saha

Principal Consultant

Talk to Analyst

Find your sweet spots for generating winning opportunities in this market.

Comparative View Of Adjacent Sales Intelligence Software Market

Sales Intelligence Software Market:

Attributes Sales Intelligence Software Market
CAGR (2022 to 2032) 10.4%
Market Value (2026) US$ 4.6 Billion
Growth Factor The rapid adoption of advanced solutions for improved customer targeting drives the global sales intelligence software market growth forward.
Opportunity The incorporation of Artificial Intelligence (AI) to automate pre-sales processes, as well as the increased use of company technographic to identify buying intent and improve prospecting, are expected to generate numerous opportunities.
Key Trends Usage of knowledge connections, domain-enriched Machine Learning (ML), and Natural Language Processing (NLP) by companies to provide better sales intelligence software and services.

Industrial Operational Intelligence Solutions Market:

Attributes Industrial Operational Intelligence Solutions Market
CAGR (2022 to 2032) 9%
Market Value (2026) US$ 4.06 Billion
Growth Factor The focus of companies to improve market responses and performance as well as the necessity to upgrade their processes are the major driving factors for the growth of the global industrial operational intelligence solutions market.
Opportunity The increased amount of data in the oil and gas, automotive, and healthcare industries is expected to provide the market with lucrative growth opportunities.
Key Trends The upcoming food & beverages sector, electronics, and logistics industries in various countries are considered key market trends.

Business Intelligence and Analytics Software Market:

Attributes Business Intelligence and Analytics Software Market
CAGR (2022 to 2032) 9.5%
Market Value (2026) US$ 43.3 Billion
Growth Factor The advancement of technology and continuous improvement of user benefits are some of the primary factors driving the growth of the business intelligence market.
Opportunity Players are demonstrating their distinct competencies by introducing specific solutions and applications to address the needs and demands of a specific department or process.
Key Trends The popularity of cloud deployment options has provided enormous benefits to SMBs and increased their adoption rate significantly and this trend is likely to continue in near future.

Recent technological advancements have paved the way for artificial intelligence in sales and marketing operations and the same has opened up a wide array of sales intelligence software market opportunities.

Several companies are using knowledge connections, natural language processing (NLP), and domain-enriched Machine Learning (ML) to provide the best sales intelligence tools.

Many businesses have entire teams dedicated to finding new sales intelligence software market opportunities. In recent years, researchers have made tremendous progress toward developing the ultimate human-machine interaction systems.

By implementing computer vision, natural language processing (NLP), and machine learning programs, AI sales software is used to capture audio, text, and imagery data from various vendor/internal databases and public sources.

Emerging trends in the sales intelligence software market include the shift by sales professionals from traditional sales tools like in-person events or face-to-face meetings to sales enablement and sales intelligence technology that they previously avoided.

Which Segment Dominates The Sales Intelligence Software Market, By Offering?

The software segment is projected to take the lead in the sales intelligence software market with a CAGR of 10.1% during the forecast period. To create sales intelligence software, the developers use analytical algorithms and natural language processing (NLP) technology to find meaning in massive amounts of unstructured textual data. This is the primary driver of the market's expansion in software sales intelligence.

Get the data you need at a Fraction of the cost

Personalize your report by choosing insights you need
and save 40%!

Which Segment Is Likely To Lead The Sales Intelligence Software Market, By Application?

Based on application, the lead management segment is expected to be at the forefront of the sales intelligence software market, advancing at a CAGR of 9.7% from 2022 to 2032.

The adoption of sales intelligence software for lead management is high as lead management provides coverage on the entire process starting from lead generation, gathering insights on leads, and lead scoring to build a comprehensive list of leads.

Lead generation also provides them with effective lead scoring and account-level insights, thereby helping them improve their prospecting strategies, which is another factor that adds to the sales intelligence software adoption trends.
What Is The Regional Analysis For The Sales Intelligence Software Market?

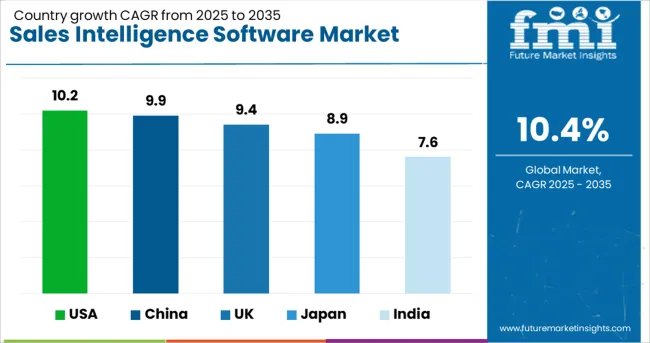
Regions CAGR (2022 to 2032)
USA Market 10.2%
UK Market 9.4%
China Market 9.9%
Japan Market 8.9%
India Market 7.6%

Due to increased technology adoption in the US for improving sales productivity and the presence of a large number of sales intelligence vendors, the US is expected to account for the largest sales intelligence software market share.

The USA sales intelligence software market is anticipated to advance at a CAGR of 10.2% during the forecast period (2022 to 2032). However, China and Japan markets are expected to grow rapidly during the forecast period, owing to an increase in demand for sales intelligence solutions in the BFSI sector to improve customer experience.

Sales intelligence is becoming a viable solution for detecting customer behavior in the regional insurance industry, which is predicted to propel the sales intelligence software market size in China and Japan.
How Is The Competition In The Sales Intelligence Software Market?

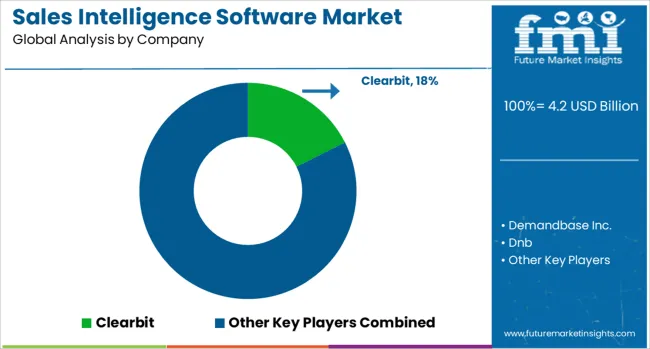
Market players are focusing on growing their customer base in order to gain a competitive advantage in the sales intelligence software market.

As a result, key players are undertaking a number of strategic initiatives, such as mergers and acquisitions, partnerships, and collaborations with other industry key players thereby expanding their sales intelligence software market share.

A couple of such recent developments in the sales intelligence software market are:

  • Exabel, a FinTech company based in Norway, has partnered with 1010data, Inc., a data provider to the retail, consumer goods, and banking and finance industries based in the USA. Both companies are working together to create COVID-19 impact dashboards that derive useful insights from multiple sets of live credit and debit transaction data. These findings are expected to provide investors with real-time data on how the epidemic affects consumer spending in the retail, grocery, general merchandise, and travel industries across the USA.
  • Black Knight, Bilcar, the Investor Group, led by CC Capital, LLC, and Thomas H. Lee Partners, Cannae Holdings Inc., L.P., announced the merger of dnb. co.in, India-based data analytics and reporting solutions provider.

This merger was expected to result in improved business solutions around the world and create numerous sales intelligence software market opportunities.

Key Players In The Sales Intelligence Market Are

  • Clearbit
  • Demandbase Inc.
  • dnb.co.in.
  • DueDil Ltd
  • EverString Technology

Key Segments

By Offering:

  • Software
  • Service

By Application:

  • Analytics and Reporting
  • Data Management
  • Lead Management
  • Others

By Deployment Mode:

  • Cloud
  • On-Premise

By Organization Size:

  • SMEs
  • Large Enterprises

By Vertical:

  • BFSI
  • IT & Telecom
  • Retail & E-Commerce
  • Healthcare
  • Media & Entertainment
  • Others

By Region:

  • North America
  • Europe
  • Asia Pacific
  • Middle East and Africa
  • Latin America

Frequently Asked Questions

What is the CAGR of the Sales Intelligence Software Market?

The sales intelligence software market is projected to register a CAGR of 10.4% during the forecast period (2022 to 2032).

Which is the Leading Region in the Sales Intelligence Software Market?

During the projected period, the USA is expected to lead the software intelligence software market with a CAGR of 10.2% through 2032.

Which Segment Leads in the Sales Intelligence Software Market by Offering?

Software segment is expected to dominate the sales intelligence software market over the forecast period based on offering.

What is the Growth Estimated for the Sales Intelligence Software Market by 2032?

The sales intelligence software market is expected to be valued at US$ 8.4 Billion by 2032.

Which was the Historical Size of the Sales Intelligence Software Market?

The sales intelligence software market size accounted for around US$ 2.8 Billion in 2021.

Table of Content

1. Executive Summary | Sales Intelligence Software Market

    1.1. Global Market Outlook

    1.2. Summary of Statistics

    1.3. Key Market Characteristics & Attributes

    1.4. Analysis and Recommendations

2. Market Overview

    2.1. Market Coverage / Taxonomy

    2.2. Market Definition / Scope / Limitations

3. Market Risks and Trends Assessment 

    3.1. Risk Assessment

        3.1.1. COVID-19 Crisis and Impact on Demand

        3.1.2. COVID-19 Impact Benchmark with Previous Crisis

        3.1.3. Impact on Market Value (US$ Million)

        3.1.4. Assessment by Key Countries

        3.1.5. Assessment by Key Market Segments

        3.1.6. Action Points and Recommendation for Suppliers

    3.2. Key Trends Impacting the Market

    3.3. Formulation and Product Development Trends

4. Market Background 

    4.1. Market, by Key Countries

    4.2. Market Opportunity Assessment (US$ Million)

        4.2.1. Total Available Market

        4.2.2. Serviceable Addressable Market

        4.2.3. Serviceable Obtainable Market

    4.3. Market Scenario Forecast

        4.3.1. Demand in Optimistic Scenario

        4.3.2. Demand in Likely Scenario

        4.3.3. Demand in Conservative Scenario

    4.4. Investment Feasibility Analysis

        4.4.1. Investment in Established Markets

            4.4.1.1. In Short Term

            4.4.1.2. In Long Term

        4.4.2. Investment in Emerging Markets

            4.4.2.1. In Short Term

            4.4.2.2. In Long Term

    4.5. Forecast Factors - Relevance & Impact

        4.5.1. Top Companies Historical Growth

        4.5.2. Growth in Automation, By Country

        4.5.3. Adoption Rate, By Country

    4.6. Market Dynamics

        4.6.1. Market Driving Factors and Impact Assessment

        4.6.2. Prominent Market Challenges and Impact Assessment

        4.6.3. Market Opportunities

        4.6.4. Prominent Trends in the Global Market & Their Impact Assessment

5. Key Success Factors 

    5.1. Manufacturers’ Focus on Low Penetration High Growth Markets

    5.2. Banking on with Segments High Incremental Opportunity

    5.3. Peer Benchmarking

6. Global Market Demand Analysis 2015 to 2021 and Forecast, 2022 to 2032

    6.1. Historical Market Analysis, 2015 to 2021

    6.2. Current and Future Market Projections, 2022 to 2032

    6.3. Y-o-Y Growth Trend Analysis

7. Global Market Value Analysis 2015 to 2021 and Forecast, 2022 to 2032

    7.1. Historical Market Value (US$ Million) Analysis, 2015 to 2021

    7.2. Current and Future Market Value (US$ Million) Projections, 2022 to 2032

        7.2.1. Y-o-Y Growth Trend Analysis

        7.2.2. Absolute $ Opportunity Analysis

8. Global Market Analysis 2015 to 2021 and Forecast 2022 to 2032, By Offering

    8.1. Introduction / Key Findings

    8.2. Historical Market Value (US$ Million) and Analysis By Offering, 2015 to 2021

    8.3. Current and Future Market Value (US$ Million) and Analysis and Forecast By Offering, 2022 to 2032

        8.3.1. Software

        8.3.2. Services

    8.4. Market Attractiveness Analysis By Offering

9. Global Market Analysis 2015 to 2021 and Forecast 2022 to 2032, By Application

    9.1. Introduction / Key Findings

    9.2. Historical Market Value (US$ Million) and Analysis By Application, 2015 to 2021

    9.3. Current and Future Market Value (US$ Million) and Analysis and Forecast By Application, 2022 to 2032

        9.3.1. Analytics and Reporting

        9.3.2. Data Management

        9.3.3. Lead Management

        9.3.4. Others

    9.4. Market Attractiveness Analysis By Application

10. Global Market Analysis 2015 to 2021 and Forecast 2022 to 2032, By Deployment Mode

    10.1. Introduction / Key Findings

    10.2. Historical Market Value (US$ Million) and Analysis By Deployment Mode, 2015 to 2021

    10.3. Current and Future Market Value (US$ Million) and Analysis and Forecast By Deployment Mode, 2022 to 2032

        10.3.1. Cloud

        10.3.2. On-Premises

    10.4. Market Attractiveness Analysis By Deployment Mode

11. Global Market Analysis 2015 to 2021 and Forecast 2022 to 2032, By Organization Size

    11.1. Introduction / Key Findings

    11.2. Historical Market Value (US$ Million) and Analysis By Organization Size, 2015 to 2021

    11.3. Current and Future Market Value (US$ Million) and Analysis and Forecast By Organization Size, 2022 to 2032

        11.3.1. SMEs

        11.3.2. Large Enterprises

    11.4. Market Attractiveness Analysis By Organization Size

12. Global Market Analysis 2015 to 2021 and Forecast 2022 to 2032, By Vertical

    12.1. Introduction / Key Findings

    12.2. Historical Market Value (US$ Million) and Analysis By Vertical, 2015 to 2021

    12.3. Current and Future Market Value (US$ Million) and Analysis and Forecast By Vertical, 2022 to 2032

        12.3.1. BFSI

        12.3.2. IT & Telecom

        12.3.3. Retail & E-Commerce

        12.3.4. Healthcare

        12.3.5. Media & Entertainment

        12.3.6. Others

    12.4. Market Attractiveness Analysis By Vertical

13. Global Market Analysis 2015 to 2021 and Forecast 2022 to 2032, By Region

    13.1. Introduction

    13.2. Historical Market Value (US$ Million) and Analysis By Region, 2015 to 2021

    13.3. Current Market Size (US$ Million) & Analysis and Forecast By Region, 2022 to 2032

        13.3.1. North America

        13.3.2. Latin America

        13.3.3. Europe

        13.3.4. Asia Pacific

        13.3.5. Middle East and Africa (MEA)

    13.4. Market Attractiveness Analysis By Region

14. North America Market Analysis 2015 to 2021 and Forecast 2022 to 2032

    14.1. Introduction

    14.2. Pricing Analysis

    14.3. Historical Market Value (US$ Million) and Trend Analysis By Market Taxonomy, 2015 to 2021

    14.4. Market Value (US$ Million) & Forecast By Market Taxonomy, 2022 to 2032

        14.4.1. By Country

            14.4.1.1. United States of America

            14.4.1.2. Canada

            14.4.1.3. Rest of North America

        14.4.2. By Deployment Mode

        14.4.3. By Offering

        14.4.4. By Application

        14.4.5. By Organization Size

        14.4.6. By Vertical

    14.5. Market Attractiveness Analysis

        14.5.1. By Country

        14.5.2. By Deployment Mode

        14.5.3. By Offering

        14.5.4. By Application

        14.5.5. By Organization Size

        14.5.6. By Vertical

15. Latin America Market Analysis 2015 to 2021 and Forecast 2022 to 2032

    15.1. Introduction

    15.2. Pricing Analysis

    15.3. Historical Market Value (US$ Million) and Trend Analysis By Market Taxonomy, 2015 to 2021

    15.4. Market Value (US$ Million) & Forecast By Market Taxonomy, 2022 to 2032

        15.4.1. By Country

            15.4.1.1. Brazil

            15.4.1.2. Mexico

            15.4.1.3. Rest of Latin America

        15.4.2. By Deployment Mode

        15.4.3. By Offering

        15.4.4. By Application

        15.4.5. By Organization Size

        15.4.6. By Vertical

    15.5. Market Attractiveness Analysis

        15.5.1. By Country

        15.5.2. By Deployment Mode

        15.5.3. By Offering

        15.5.4. By Application

        15.5.5. By Organization Size

        15.5.6. By Vertical

16. Europe Market Analysis 2015 to 2021 and Forecast 2022 to 2032

    16.1. Introduction

    16.2. Pricing Analysis

    16.3. Historical Market Value (US$ Million) and Trend Analysis By Market Taxonomy, 2015 to 2021

    16.4. Market Value (US$ Million) & Forecast By Market Taxonomy, 2022 to 2032

        16.4.1. By Country

            16.4.1.1. Germany

            16.4.1.2. France

            16.4.1.3. United Kingdom

            16.4.1.4. Italy

            16.4.1.5. Russia

            16.4.1.6. Rest of Europe

        16.4.2. By Deployment Mode

        16.4.3. By Offering

        16.4.4. By Application

        16.4.5. By Organization Size

        16.4.6. By Vertical

    16.5. Market Attractiveness Analysis

        16.5.1. By Country

        16.5.2. By Deployment Mode

        16.5.3. By Offering

        16.5.4. By Application

        16.5.5. By Organization Size

        16.5.6. By Vertical

17. Asia Pacific Market Analysis 2015 to 2021 and Forecast 2022 to 2032

    17.1. Introduction

    17.2. Pricing Analysis

    17.3. Historical Market Value (US$ Million) and Trend Analysis By Market Taxonomy, 2015 to 2021

    17.4. Market Value (US$ Million) & Forecast By Market Taxonomy, 2022 to 2032

        17.4.1. By Country

            17.4.1.1. China

            17.4.1.2. Japan

            17.4.1.3. South Korea

            17.4.1.4. Rest of Asia Pacific

        17.4.2. By Deployment Mode

        17.4.3. By Offering

        17.4.4. By Application

        17.4.5. By Organization Size

        17.4.6. By Vertical

    17.5. Market Attractiveness Analysis

        17.5.1. By Country

        17.5.2. By Deployment Mode

        17.5.3. By Offering

        17.5.4. By Application

        17.5.5. By Organization Size

        17.5.6. By Vertical

18. Middle East and Africa Market Analysis 2015 to 2021 and Forecast 2022 to 2032

    18.1. Introduction

    18.2. Pricing Analysis

    18.3. Historical Market Value (US$ Million) and Trend Analysis By Market Taxonomy, 2015 to 2021

    18.4. Market Value (US$ Million) & Forecast By Market Taxonomy, 2022 to 2032

        18.4.1. By Country

            18.4.1.1. GCC Countries

            18.4.1.2. South Africa

            18.4.1.3. Turkey

            18.4.1.4. Rest of Middle East and Africa

        18.4.2. By Deployment Mode

        18.4.3. By Offering

        18.4.4. By Application

        18.4.5. By Organization Size

        18.4.6. By Vertical

    18.5. Market Attractiveness Analysis

        18.5.1. By Country

        18.5.2. By Deployment Mode

        18.5.3. By Offering

        18.5.4. By Application

        18.5.5. By Organization Size

        18.5.6. By Vertical

19. Key Countries Market Analysis 2015 to 2021 and Forecast 2022 to 2032

    19.1. Introduction

        19.1.1. Market Value Proportion Analysis, By Key Countries

        19.1.2. Global Vs. Country Growth Comparison

    19.2. US Market Analysis

        19.2.1. Value Proportion Analysis by Market Taxonomy

        19.2.2. Value & Analysis and Forecast by Market Taxonomy, 2015 to 2032

            19.2.2.1. By Deployment Mode

            19.2.2.2. By Offering

            19.2.2.3. By Application

            19.2.2.4. By Organization Size

            19.2.2.5. By Vertical

    19.3. Canada Market Analysis

        19.3.1. Value Proportion Analysis by Market Taxonomy

        19.3.2. Value & Analysis and Forecast by Market Taxonomy, 2015 to 2032

            19.3.2.1. By Deployment Mode

            19.3.2.2. By Offering

            19.3.2.3. By Application

            19.3.2.4. By Organization Size

            19.3.2.5. By Vertical

    19.4. Mexico Market Analysis

        19.4.1. Value Proportion Analysis by Market Taxonomy

        19.4.2. Value & Analysis and Forecast by Market Taxonomy, 2015 to 2032

            19.4.2.1. By Deployment Mode

            19.4.2.2. By Offering

            19.4.2.3. By Application

            19.4.2.4. By Organization Size

            19.4.2.5. By Vertical

    19.5. Brazil Market Analysis

        19.5.1. Value Proportion Analysis by Market Taxonomy

        19.5.2. Value & Analysis and Forecast by Market Taxonomy, 2015 to 2032

            19.5.2.1. By Deployment Mode

            19.5.2.2. By Offering

            19.5.2.3. By Application

            19.5.2.4. By Organization Size

            19.5.2.5. By Vertical

    19.6. Germany Market Analysis

        19.6.1. Value Proportion Analysis by Market Taxonomy

        19.6.2. Value & Analysis and Forecast by Market Taxonomy, 2015 to 2032

            19.6.2.1. By Deployment Mode

            19.6.2.2. By Offering

            19.6.2.3. By Application

            19.6.2.4. By Organization Size

            19.6.2.5. By Vertical

    19.7. France Market Analysis

        19.7.1. Value Proportion Analysis by Market Taxonomy

        19.7.2. Value & Analysis and Forecast by Market Taxonomy, 2015 to 2032

            19.7.2.1. By Deployment Mode

            19.7.2.2. By Offering

            19.7.2.3. By Application

            19.7.2.4. By Organization Size

            19.7.2.5. By Vertical

    19.8. Italy Market Analysis

        19.8.1. Value Proportion Analysis by Market Taxonomy

        19.8.2. Value & Analysis and Forecast by Market Taxonomy, 2015 to 2032

            19.8.2.1. By Deployment Mode

            19.8.2.2. By Offering

            19.8.2.3. By Application

            19.8.2.4. By Organization Size

            19.8.2.5. By Vertical

    19.9. Russia Market Analysis

        19.9.1. Value Proportion Analysis by Market Taxonomy

        19.9.2. Value & Analysis and Forecast by Market Taxonomy, 2015 to 2032

            19.9.2.1. By Deployment Mode

            19.9.2.2. By Offering

            19.9.2.3. By Application

            19.9.2.4. By Organization Size

            19.9.2.5. By Vertical

    19.10. UK Market Analysis

        19.10.1. Value Proportion Analysis by Market Taxonomy

        19.10.2. Value & Analysis and Forecast by Market Taxonomy, 2015 to 2032

            19.10.2.1. By Deployment Mode

            19.10.2.2. By Offering

            19.10.2.3. By Application

            19.10.2.4. By Organization Size

            19.10.2.5. By Vertical

    19.11. China Market Analysis

        19.11.1. Value Proportion Analysis by Market Taxonomy

        19.11.2. Value & Analysis and Forecast by Market Taxonomy, 2015 to 2032

            19.11.2.1. By Deployment Mode

            19.11.2.2. By Offering

            19.11.2.3. By Application

            19.11.2.4. By Organization Size

            19.11.2.5. By Vertical

    19.12. Japan Market Analysis

        19.12.1. Value Proportion Analysis by Market Taxonomy

        19.12.2. Value & Analysis and Forecast by Market Taxonomy, 2015 to 2032

            19.12.2.1. By Deployment Mode

            19.12.2.2. By Offering

            19.12.2.3. By Application

            19.12.2.4. By Organization Size

            19.12.2.5. By Vertical

    19.13. South Korea Market Analysis

        19.13.1. Value Proportion Analysis by Market Taxonomy

        19.13.2. Value & Analysis and Forecast by Market Taxonomy, 2015 to 2032

            19.13.2.1. By Deployment Mode

            19.13.2.2. By Offering

            19.13.2.3. By Application

            19.13.2.4. By Organization Size

            19.13.2.5. By Vertical

    19.14. GCC Countries Market Analysis

        19.14.1. Value Proportion Analysis by Market Taxonomy

        19.14.2. Value & Analysis and Forecast by Market Taxonomy, 2015 to 2032

            19.14.2.1. By Deployment Mode

            19.14.2.2. By Offering

            19.14.2.3. By Application

            19.14.2.4. By Organization Size

            19.14.2.5. By Vertical

    19.15. South Africa Market Analysis

        19.15.1. Value Proportion Analysis by Market Taxonomy

        19.15.2. Value & Analysis and Forecast by Market Taxonomy, 2015 to 2032

            19.15.2.1. By Deployment Mode

            19.15.2.2. By Offering

            19.15.2.3. By Application

            19.15.2.4. By Organization Size

            19.15.2.5. By Vertical

    19.16. Turkey Market Analysis

        19.16.1. Value Proportion Analysis by Market Taxonomy

        19.16.2. Value & Analysis and Forecast by Market Taxonomy, 2015 to 2032

            19.16.2.1. By Deployment Mode

            19.16.2.2. By Offering

            19.16.2.3. By Application

            19.16.2.4. By Organization Size

            19.16.2.5. By Vertical

        19.16.3. Competition Landscape and Player Concentration in the Country

20. Market Structure Analysis

    20.1. Market Analysis by Tier of Companies

    20.2. Market Concentration

    20.3. Market Share Analysis of Top Players

    20.4. Market Presence Analysis

        20.4.1. By Regional Footprint of Players

        20.4.2. Product Footprint by Players

21. Competition Analysis

    21.1. Competition Dashboard

    21.2. Competition Benchmarking

    21.3. Competition Deep Dive

        21.3.1. Clearbit

            21.3.1.1. Overview

            21.3.1.2. Product Portfolio

            21.3.1.3. Sales Footprint

            21.3.1.4. Strategy Overview

        21.3.2. Demandbase Inc.

            21.3.2.1. Overview

            21.3.2.2. Product Portfolio

            21.3.2.3. Sales Footprint

            21.3.2.4. Strategy Overview

        21.3.3. Dnb

            21.3.3.1. Overview

            21.3.3.2. Product Portfolio

            21.3.3.3. Sales Footprint

            21.3.3.4. Strategy Overview

        21.3.4. DueDil Ltd

            21.3.4.1. Overview

            21.3.4.2. Product Portfolio

            21.3.4.3. Sales Footprint

            21.3.4.4. Strategy Overview

        21.3.5. EverString Technology

            21.3.5.1. Overview

            21.3.5.2. Product Portfolio

            21.3.5.3. Sales Footprint

            21.3.5.4. Strategy Overview

        21.3.6. FullContact

            21.3.6.1. Overview

            21.3.6.2. Product Portfolio

            21.3.6.3. Sales Footprint

            21.3.6.4. Strategy Overview

        21.3.7. Gryphon Networks

            21.3.7.1. Overview

            21.3.7.2. Product Portfolio

            21.3.7.3. Sales Footprint

            21.3.7.4. Strategy Overview

        21.3.8. Infogroup

            21.3.8.1. Overview

            21.3.8.2. Product Portfolio

            21.3.8.3. Sales Footprint

            21.3.8.4. Strategy Overview

        21.3.9. Inside view

            21.3.9.1. Overview

            21.3.9.2. Product Portfolio

            21.3.9.3. Sales Footprint

            21.3.9.4. Strategy Overview

        21.3.10. LeadGenius

            21.3.10.1. Overview

            21.3.10.2. Product Portfolio

            21.3.10.3. Sales Footprint

            21.3.10.4. Strategy Overview

22. Assumptions and Acronyms Used

23. Research Methodology

Don't pay for what you don't need

Customize your report by selecting specific countries or regions and save 30%!

List of Tables

Table 01: Global Market Value (US$ Million), By Deployment Mode, 2015 to 2021

Table 02: Global Market Value (US$ Million), By Deployment Mode, 2022 to 2032

Table 03: Global Market Value (US$ Million), By Offering, 2015 to 2021

Table 04: Global Market Value (US$ Million), By Offering, 2022 to 2032

Table 05: Global Market Value (US$ Million), By Application, 2015 to 2021

Table 06: Global Market Value (US$ Million), By Application, 2022 to 2032

Table 07: Global Market Value (US$ Million), By Vertical, 2015 to 2021

Table 08: Global Market Value (US$ Million), By Vertical, 2022 to 2032

Table 09: Global Market Value (US$ Million), By Organization Size, 2015 to 2021

Table 10: Global Market Value (US$ Million), By Organization Size, 2022 to 2032

Table 11: Global Market, By Region, 2015 to 2021

Table 12: Global Market, By Region, 2022 to 2032

Table 13: North America Market Value (US$ Million), By Deployment Mode, 2015 to 2021

Table 14: North America Market Value (US$ Million), By Deployment Mode, 2022 to 2032

Table 15: North America Market Value (US$ Million), By Offering, 2015 to 2021

Table 16: North America Market Value (US$ Million), By Offering, 2022 to 2032

Table 17: North America Market Value (US$ Million), By Application, 2015 to 2021

Table 18: North America Market Value (US$ Million), By Application, 2022 to 2032

Table 19: North America Market Value (US$ Million), By Vertical, 2015 to 2021

Table 20: North America Market Value (US$ Million), By Vertical, 2022 to 2032

Table 21: North America Market Value (US$ Million), By Organization Size, 2015 to 2021

Table 22: North America Market Value (US$ Million), By Organization Size, 2022 to 2032

Table 23: North America Market, By Country, 2015 to 2021

Table 24: North America Market, By Country, 2022 to 2032

Table 25: Latin America Market Value (US$ Million), By Deployment Mode, 2015 to 2021

Table 26: Latin America Market Value (US$ Million), By Deployment Mode, 2022 to 2032

Table 27: Latin America Market Value (US$ Million), By Offering, 2015 to 2021

Table 28: Latin America Market Value (US$ Million), By Offering, 2022 to 2032

Table 29: Latin America Market Value (US$ Million), By Application, 2015 to 2021

Table 30: Latin America Market Value (US$ Million), By Application, 2022 to 2032

Table 31: Latin America Market Value (US$ Million), By Vertical, 2015 to 2021

Table 32: Latin America Market Value (US$ Million), By Vertical, 2022 to 2032

Table 33: Latin America Market Value (US$ Million), By Organization Size, 2015 to 2021

Table 34: Latin America Market Value (US$ Million), By Organization Size, 2022 to 2032

Table 35: Latin America Market, By Country, 2015 to 2021

Table 36: Latin America Market, By Country, 2022 to 2032

Table 37: Europe Market Value (US$ Million), By Deployment Mode, 2015 to 2021

Table 38: Europe Market Value (US$ Million), By Deployment Mode, 2022 to 2032

Table 39: Europe Market Value (US$ Million), By Offering, 2015 to 2021

Table 40: Europe Market Value (US$ Million), By Offering, 2022 to 2032

Table 41: Europe Market Value (US$ Million), By Application, 2015 to 2021

Table 42: Europe Market Value (US$ Million), By Application, 2022 to 2032

Table 43: Europe Market Value (US$ Million), By Vertical, 2015 to 2021

Table 44: Europe Market Value (US$ Million), By Vertical, 2022 to 2032

Table 45: Europe Market Value (US$ Million), By Organization Size, 2015 to 2021

Table 46: Europe Market Value (US$ Million), By Organization Size, 2022 to 2032

Table 47: Europe Market, By Country, 2015 to 2021

Table 48: Europe Market, By Country, 2022 to 2032

Table 49: Asia Pacific Market Value (US$ Million), By Deployment Mode, 2015 to 2021

Table 50: Asia Pacific Market Value (US$ Million), By Deployment Mode, 2022 to 2032

Table 51: Asia Pacific Market Value (US$ Million), By Offering, 2015 to 2021

Table 52: Asia Pacific Market Value (US$ Million), By Offering, 2022 to 2032

Table 53: Asia Pacific Market Value (US$ Million), By Application, 2015 to 2021

Table 54: Asia Pacific Market Value (US$ Million), By Application, 2022 to 2032

Table 55: Asia Pacific Market Value (US$ Million), By Vertical, 2015 to 2021

Table 56: Asia Pacific Market Value (US$ Million), By Vertical, 2022 to 2032

Table 57: Asia Pacific Market Value (US$ Million), By Organization Size, 2015 to 2021

Table 58: Asia Pacific Market Value (US$ Million), By Organization Size, 2022 to 2032

Table 59: Asia Pacific Market, By Country, 2015 to 2021

Table 60: Asia Pacific Market, By Country, 2022 to 2032

Table 61: MEA Market Value (US$ Million), By Deployment Mode, 2015 to 2021

Table 62: MEA Market Value (US$ Million), By Deployment Mode, 2022 to 2032

Table 63: MEA Market Value (US$ Million), By Offering, 2015 to 2021

Table 64: MEA Market Value (US$ Million), By Offering, 2022 to 2032

Table 65: MEA Market Value (US$ Million), By Application, 2015 to 2021

Table 66: MEA Market Value (US$ Million), By Application, 2022 to 2032

Table 67: MEA Market Value (US$ Million), By Vertical, 2015 to 2021

Table 68: MEA Market Value (US$ Million), By Vertical, 2022 to 2032

Table 69: MEA Market Value (US$ Million), By Organization Size, 2015 to 2021

Table 70: MEA Market Value (US$ Million), By Organization Size, 2022 to 2032

Table 71: MEA Market, By Country, 2015 to 2021

Table 72: MEA Market, By Country, 2022 to 2032
Sudip Saha
Sudip Saha

Principal Consultant

Talk to Analyst

Find your sweet spots for generating winning opportunities in this market.

List of Charts

Figure 01: Global Market Value (US$ Million) and Year-on-Year Growth, 2015 to 2032

Figure 02: Global Market Absolute $ Historical Gain (2015 to 2021) and Opportunity (2022 to 2032), US$ Million

Figure 03: Global Market Share, By Deployment Mode, 2022 & 2032

Figure 04: Global Market Y-o-Y Growth Projections, By Deployment Mode - 2022 to 2032

Figure 05: Global Market Attractiveness Index, By Deployment Mode - 2022 to 2032

Figure 06: Global Market Share, By Offering, 2022 & 2032

Figure 07: Global Market Y-o-Y Growth Projections, By Offering - 2022 to 2032

Figure 08: Global Market Attractiveness Index, By Offering - 2022 to 2032

Figure 09: Global Market Share, By Vertical, 2022 & 2032

Figure 10: Global Market Y-o-Y Growth Projections, By Vertical - 2022 to 2032

Figure 11: Global Market Attractiveness Index, By Vertical - 2022 to 2032

Figure 12: Global Market Share, By Application, 2022 & 2032

Figure 13: Global Market Y-o-Y Growth Projections, By Application - 2022 to 2032

Figure 14: Global Market Attractiveness Index, By Application - 2022 to 2032

Figure 15: Global Market Share, By Organization Size, 2022 & 2032

Figure 16: Global Market Y-o-Y Growth Projections, By Organization Size - 2022 to 2032

Figure 17: Global Market Attractiveness Index, By Organization Size - 2022 to 2032

Figure 18: Global Market Share, By Region, 2022 & 2032

Figure 19: Global Market Y-o-Y Growth Projections, By Region - 2022 to 2032

Figure 20: Global Market Attractiveness Index, By Region - 2022 to 2032

Figure 21: North America Market Value (US$ Million) and Year-on-Year Growth, 2015 to 2032

Figure 22: North America Market Absolute $ Historical Gain (2015 to 2021) and Opportunity (2022 to 2032), US$ Million

Figure 23: North America Market Share, By Deployment Mode, 2022 & 2032

Figure 24: North America Market Y-o-Y Growth Projections, By Deployment Mode - 2022 to 2032

Figure 25: North America Market Attractiveness Index, By Deployment Mode - 2022 to 2032

Figure 26: North America Market Share, By Offering, 2022 & 2032

Figure 27: North America Market Y-o-Y Growth Projections, By Offering - 2022 to 2032

Figure 28: North America Market Attractiveness Index, By Offering - 2022 to 2032

Figure 29: North America Market Share, By Vertical, 2022 & 2032

Figure 30: North America Market Y-o-Y Growth Projections, By Vertical - 2022 to 2032

Figure 31: North America Market Attractiveness Index, By Vertical - 2022 to 2032

Figure 32: North America Market Share, By Application, 2022 & 2032

Figure 33: North America Market Y-o-Y Growth Projections, By Application - 2022 to 2032

Figure 34: North America Market Attractiveness Index, By Application - 2022 to 2032

Figure 35: North America Market Share, By Organization Size, 2022 & 2032

Figure 36: North America Market Y-o-Y Growth Projections, By Organization Size - 2022 to 2032

Figure 37: North America Market Attractiveness Index, By Organization Size - 2022 to 2032

Figure 38: North America Market Share, By Country, 2022 & 2032

Figure 39: North America Market Y-o-Y Growth Projections, By Country - 2022 to 2032

Figure 40: North America Market Attractiveness Index, By Country - 2022 to 2032

Figure 41: Latin America Market Value (US$ Million) and Year-on-Year Growth, 2015 to 2032

Figure 42: Latin America Market Absolute $ Historical Gain (2015 to 2021) and Opportunity (2022 to 2032), US$ Million

Figure 43: Latin America Market Share, By Deployment Mode, 2022 & 2032

Figure 44: Latin America Market Y-o-Y Growth Projections, By Deployment Mode - 2022 to 2032

Figure 45: Latin America Market Attractiveness Index, By Deployment Mode - 2022 to 2032

Figure 46: Latin America Market Share, By Offering, 2022 & 2032

Figure 47: Latin America Market Y-o-Y Growth Projections, By Offering - 2022 to 2032

Figure 48: Latin America Market Attractiveness Index, By Offering - 2022 to 2032

Figure 49: Latin America Market Share, By Vertical, 2022 & 2032

Figure 50: Latin America Market Y-o-Y Growth Projections, By Vertical - 2022 to 2032

Figure 51: Latin America Market Attractiveness Index, By Vertical - 2022 to 2032

Figure 52: Latin America Market Share, By Application, 2022 & 2032

Figure 53: Latin America Market Y-o-Y Growth Projections, By Application - 2022 to 2032

Figure 54: Latin America Market Attractiveness Index, By Application - 2022 to 2032

Figure 55: Latin America Market Share, By Organization Size, 2022 & 2032

Figure 56: Latin America Market Y-o-Y Growth Projections, By Organization Size - 2022 to 2032

Figure 57: Latin America Market Attractiveness Index, By Organization Size - 2022 to 2032

Figure 58: Latin America Market Share, By Country, 2022 & 2032

Figure 59: Latin America Market Y-o-Y Growth Projections, By Country - 2022 to 2032

Figure 60: Latin America Market Attractiveness Index, By Country - 2022 to 2032

Figure 61: Europe Market Value (US$ Million) and Year-on-Year Growth, 2015 to 2032

Figure 62: Europe Market Absolute $ Historical Gain (2015 to 2021) and Opportunity (2022 to 2032), US$ Million

Figure 63: Europe Market Share, By Deployment Mode, 2022 & 2032

Figure 64: Europe Market Y-o-Y Growth Projections, By Deployment Mode - 2022 to 2032

Figure 65: Europe Market Attractiveness Index, By Deployment Mode - 2022 to 2032

Figure 66: Europe Market Share, By Offering, 2022 & 2032

Figure 67: Europe Market Y-o-Y Growth Projections, By Offering - 2022 to 2032

Figure 68: Europe Market Attractiveness Index, By Offering - 2022 to 2032

Figure 69: Europe Market Share, By Vertical, 2022 & 2032

Figure 70: Europe Market Y-o-Y Growth Projections, By Vertical - 2022 to 2032

Figure 71: Europe Market Attractiveness Index, By Vertical - 2022 to 2032

Figure 72: Europe Market Share, By Application, 2022 & 2032

Figure 73: Europe Market Y-o-Y Growth Projections, By Application - 2022 to 2032

Figure 74: Europe Market Attractiveness Index, By Application - 2022 to 2032

Figure 75: Europe Market Share, By Organization Size, 2022 & 2032

Figure 76: Europe Market Y-o-Y Growth Projections, By Organization Size - 2022 to 2032

Figure 77: Europe Market Attractiveness Index, By Organization Size - 2022 to 2032

Figure 78: Europe Market Share, By Country, 2022 & 2032

Figure 79: Europe Market Y-o-Y Growth Projections, By Country - 2022 to 2032

Figure 80: Europe Market Attractiveness Index, By Country - 2022 to 2032

Figure 81: Asia Pacific Market Value (US$ Million) and Year-on-Year Growth, 2015 to 2032

Figure 82: Asia Pacific Market Absolute $ Historical Gain (2015 to 2021) and Opportunity (2022 to 2032), US$ Million

Figure 83: Asia Pacific Market Share, By Deployment Mode, 2022 & 2032

Figure 84: Asia Pacific Market Y-o-Y Growth Projections, By Deployment Mode - 2022 to 2032

Figure 85: Asia Pacific Market Attractiveness Index, By Deployment Mode - 2022 to 2032

Figure 86: Asia Pacific Market Share, By Offering, 2022 & 2032

Figure 87: Asia Pacific Market Y-o-Y Growth Projections, By Offering - 2022 to 2032

Figure 88: Asia Pacific Market Attractiveness Index, By Offering - 2022 to 2032

Figure 89: Asia Pacific Market Share, By Vertical, 2022 & 2032

Figure 90: Asia Pacific Market Y-o-Y Growth Projections, By Vertical - 2022 to 2032

Figure 91: Asia Pacific Market Attractiveness Index, By Vertical - 2022 to 2032

Figure 92: Asia Pacific Market Share, By Application, 2022 & 2032

Figure 93: Asia Pacific Market Y-o-Y Growth Projections, By Application - 2022 to 2032

Figure 94: Asia Pacific Market Attractiveness Index, By Application - 2022 to 2032

Figure 95: Asia Pacific Market Share, By Organization Size, 2022 & 2032

Figure 96: Asia Pacific Market Y-o-Y Growth Projections, By Organization Size - 2022 to 2032

Figure 97: Asia Pacific Market Attractiveness Index, By Organization Size - 2022 to 2032

Figure 98: Asia Pacific Market Share, By Country, 2022 & 2032

Figure 99: Asia Pacific Market Y-o-Y Growth Projections, By Country - 2022 to 2032

Figure 100: Asia Pacific Market Attractiveness Index, By Country - 2022 to 2032

Figure 101: MEA Market Value (US$ Million) and Year-on-Year Growth, 2015 to 2032

Figure 102: MEA Market Absolute $ Historical Gain (2015 to 2021) and Opportunity (2022 to 2032), US$ Million

Figure 103: MEA Market Share, By Deployment Mode, 2022 & 2032

Figure 104: MEA Market Y-o-Y Growth Projections, By Deployment Mode - 2022 to 2032

Figure 105: MEA Market Attractiveness Index, By Deployment Mode - 2022 to 2032

Figure 106: MEA Market Share, By Offering, 2022 & 2032

Figure 107: MEA Market Y-o-Y Growth Projections, By Offering - 2022 to 2032

Figure 108: MEA Market Attractiveness Index, By Offering - 2022 to 2032

Figure 109: MEA Market Share, By Vertical, 2022 & 2032

Figure 110: MEA Market Y-o-Y Growth Projections, By Vertical - 2022 to 2032

Figure 111: MEA Market Attractiveness Index, By Vertical - 2022 to 2032

Figure 112: MEA Market Share, By Application, 2022 & 2032

Figure 113: MEA Market Y-o-Y Growth Projections, By Application - 2022 to 2032

Figure 114: MEA Market Attractiveness Index, By Application - 2022 to 2032

Figure 115: MEA Market Share, By Organization Size, 2022 & 2032

Figure 116: MEA Market Y-o-Y Growth Projections, By Organization Size - 2022 to 2032

Figure 117: MEA Market Attractiveness Index, By Organization Size - 2022 to 2032

Figure 118: MEA Market Share, By Country, 2022 & 2032

Figure 119: MEA Market Y-o-Y Growth Projections, By Country - 2022 to 2032

Figure 120: MEA Market Attractiveness Index, By Country - 2022 to 2032

Recommendations

Technology

Enterprise Manufacturing Intelligence Market

Published : March 2023

Technology

Industrial Operational Intelligence Solutions Market

Published : December 2022

Technology

MEA Enterprise Software Market

Published : September 2022

Technology

Energy Intelligence Solution Market

Published : June 2022

Explore Technology Insights

View Reports

Sales Intelligence Software Market