Reports

- Global Locations -

Headquarters

Future Market Insights, Inc.

Christiana Corporate, 200
Continental Drive, Suite 401,
Newark, Delaware - 19713,
United States

T: +1-845-579-5705

Americas

Future Market Insights, Inc.

616 Corporate Way, Suite 2-9018,
Valley Cottage, NY 10989, United States

T: +1-347-918-3531

MEA

Future Market Insights

1602-6 Jumeirah Bay X2 Tower, Plot No: JLT-PH2-X2A,
Jumeirah Lakes Towers, Dubai,
United Arab Emirates

Europe

Future Market Insights

3rd Floor, 207 Regent Street,
W1B 3HH London
United Kingdom

T: + 44 (0) 20 8123 9659
D: +44 (0) 20 3287 4268

Asia Pacific

Future Market Insights

IndiaLand Global Tech Park, Unit UG-1, Behind Grand HighStreet, Phase 1, Hinjawadi, MH, Pune – 411057, India

Analytical Study of Tourism Industry in the Middle East (2024 to 2034)

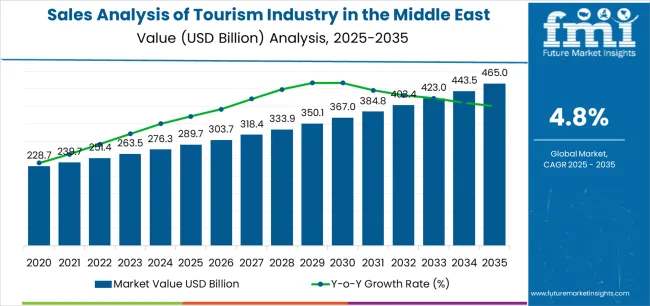
Instagram reels and TikTok videos are making more millennials and Gen Z travelers loosen their pockets and visit the Middle East. As such, tourism industry expansion in the Middle East is estimated at a 5.10% CAGR until 2034. The tourism industry in the Middle East is on the way to reaching US$ 453.28 billion by 2034. In 2024, the industry is anticipated to be worth US$ 275.64 billion.

Attributes Details
Industry Size in 2024 US$ 275.64 billion
Expected Industry Size in 2034 US$ 453.28 billion
Forecasted CAGR between 2024 to 2034 5.10%

Don't pay for what you don't need

Customize your report by selecting specific countries or regions and save 30%!

Key Trends Influencing the Industry Through 2034

  • More Millennials and Gen Zers Make Visits to the Middle East

Millennials and Gen Z are changing travel and tourism. They tend to care more about experiences than things and want authentic trips. They use technology a lot to plan trips and share their experiences online.

They look for unique and meaningful travel experiences that match their values. Because they travel a lot to the Middle East, businesses are changing how they offer services and advertise to meet their needs. It shows that younger people have a big influence on the tourism industry.

  • Governments Know the Importance of Tourism and Their Policies Highlight it

In the Middle East, governments are focusing on tourism to grow their economies. They are making it easier for tourists to visit the region by changing visa rules and improving entry procedures. Hosting big events and cultural exhibitions helps to show off the region's attractions to people from around the world.

Governments also help tourism by building better roads and facilities, running ads to attract tourists, and making rules that support the industry. All these efforts make it easier for tourism to grow, bringing in more investment and creating jobs for people in different fields. An example is the UAE’s Tourism Strategy 2031. It fortifies UAE’s position as a leading tourism destination. This policy is helping in developing and diversifying tourism products and services.

  • Infrastructure Development is Happening at Lightning Pace

Countries like the UAE, Qatar, and Saudi Arabia are seeing the building of lots of fancy attractions to entice tourists. With nice hotels and easy transportation, more tourists want to come and have a good time. This helps the tourism industry grow and makes these countries popular destinations for travelers.

The chairman of Abu Dhabi's Department of Culture and Tourism announced plans to invest more than US$ 10 billion in infrastructure as part of the emirate's new tourism strategy. To complement the Abu Dhabi Tourism Strategy 2030, the emirate plans to increase the number of hotel rooms to 52,000 from the existing 34,000.

In February 2024, the Emirates Tourism Council released the 'National Tourism Charter', which is an important component of the National Tourism Strategy 2031. The program intends to coordinate national efforts to promote the UAE tourism industry's long-term growth and competitiveness at the global and regional levels.

It will assist in establishing the country as an important contributor in the global travel and tourism environment, as well as encourage collaboration among the seven emirates to improve tourism destinations and products.

Key Insights - Highlights on the Emerging Opportunities in the Middle East Tourism Industry

  • Space tourism can be promoted. Mohammad Bin Rashid Space Center is a prominent example of a space tourism attraction with potential. Businesses can benefit from the interest in space by developing space-themed tours and attractions.
  • Hospitals and wellness centers can attract patients from other countries. This can be achieved by offering special treatments and wellness programs. They can team up with hotels, travel agencies, and others to make complete medical tourism packages.
  • Businesses can team up with schools and universities to offer tours and study abroad programs. These give students hands-on learning and cultural experiences. Tours can include visits to museums, historical sites, and workshops.
Ronak Shah
Ronak Shah

Principal Consultant

Talk to Analyst

Find your sweet spots for generating winning opportunities in this market.

Comparative View of Adjacent Industries

Demand for Tourism in the Middle East:

Attributes Demand for Tourism in the Middle East
CAGR (2024 to 2034) 5.10%
Valuation (2024) US$ 275.64 billion
Key Trend Growing adoption of robotics and automation
Key Challenge Rising geopolitical tensions

Demand for Tourism at the Global Level:

Attributes Demand for Tourism at the Global Level
CAGR (2024 to 2034) 5.0%
Key Trend Rise in adventure tourism, art tourism, and medical tourism
Key Challenge Disease outbreak in specific countries affects revenues

Adoption Scenario of Tourism Security in the Middle East and Africa:

Attributes Adoption Scenario of Tourism Security in the Middle East and Africa
CAGR (2024 to 2034) 2.0%
Key Trend Rising adoption due to escalating safety concerns in major attraction places
Key Challenge Consumer concern about ineffectiveness of security in the Middle East

Category-wise Insights

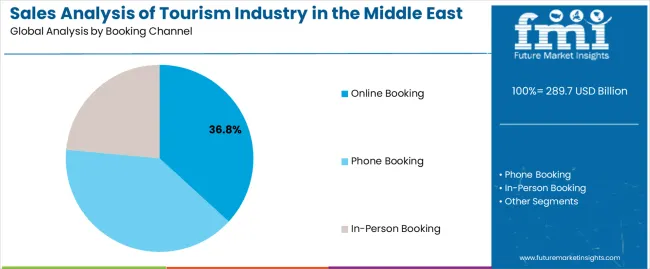
Online Booking Dominates as Leading Booking Channel

Leading Booking Channel for Tourism in the Middle East Online Booking
Total Value Share (2024) 36.80%

Online booking platforms make planning trips to the Middle East easy. With smartphones and an internet connection, travel booking can be done anytime, anywhere. Visitors can choose hotels, flights, and activities that fit their budget and preferences. These platforms also offer good deals and discounts, saving money for travelers. Plus, they confirm bookings instantly, so travelers don't have to wait. If plans change, they can modify or cancel easily without extra fees.

Websites like Expedia, MakeMyTrip, Booking.com, and Airbnb are user-friendly. They also offer customer support that is available 24/7. Travelers feel safe because of secure payment systems and the protection of personal information. Overall, online booking platforms have changed how people travel in the Middle East, making it simpler, more flexible, and more secure.

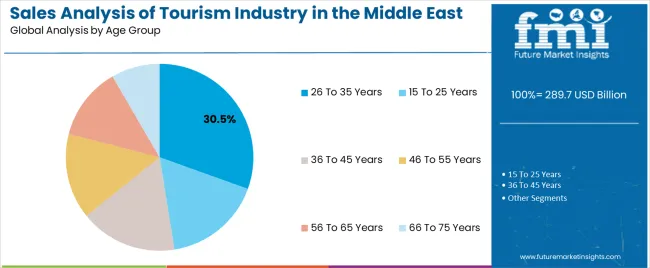
Leading Age Group for Tourism in the Middle East 26 to 35 Years
Total Value Share (2024) 30.50%

People in this age group mostly have more money to spend because they've finished their schooling and have stable jobs. They may travel for work, weddings, or family vacations. Social media also influences them to travel by showing them cool places and experiences.

Some tourists in this age group are also entrepreneurs looking for inspiration and business connections. Some are also concerned about the environment and choose eco-friendly travel options. They care about sustainability and want to support conservation efforts. Many have flexible jobs, so they can take longer trips or work while traveling. Traveling helps them learn about themselves and other cultures. They can easily find travel information online and plan their trips.

Get the data you need at a Fraction of the cost

Personalize your report by choosing insights you need
and save 40%!

Tourism Hotspots in the Middle East Driving the Industry

When we think about the Middle East, the Hajj comes to mind first. Muslim followers from all over the world visit Mecca for the Hajj pilgrimage, which is revered as a holy place for Muslims worldwide. Situated in Saudi Arabia, this hotspot significantly adds to the demand for Middle Eastern tourism.

Here are some other tourism hotspots that boost revenues in the Middle East

Petra, Jordan: Petra is an ancient city in southern Jordan, renowned for its stunning architecture and archaeological significance. Highlights of this Middle Eastern tourist place include the Treasury (Al-Khazneh), the Monastery (Ad Deir), and the Siq, a narrow canyon leading to the city's entrance. Jordan’s tourism sector added nearly 14.6% to the GDP in 2023 despite challenges.

Jerusalem, Israel: Jerusalem is a sacred city revered by three monotheistic religions - Judaism, Christianity, and Islam. The country had nearly 2.5 million tourists in 2023. The tourism sector in Israel accounts for 2.8% of the GDP and nearly 3.5% of total employment. In 2023, Israel’s tourism income was US$ 5.955 billion.

Cappadocia, Türkiye: Cappadocia is famous for its surreal landscape of fairy chimneys, rock formations, and underground cities. Türkiye’s tourism revenues reached US$ 54.32 billion in 2023, marking a 17% increase from 2022’s US$ 46.48 billion.

In recent years, however, there has been a recorded uptick in violence across the Middle East. According to press sources, Iraq and Syria are insecure due to incidents of violence and disorder, as well as the influence of some extreme organizations. The rising tension between Israel and Palestine over the Gaza Strip has made the region less safe as well.
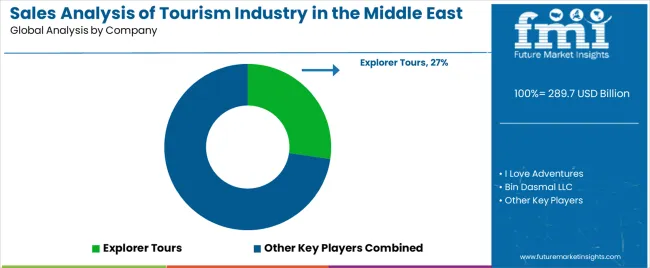
Competitive Landscape

The Middle East tourism industry is intensely competitive, with prominent airlines, hotels, and internet booking platforms fighting for share. Airlines like Emirates, Qatar Airways, and Saudia compete for passengers, while hotel brands like Marriott and Hilton fight for supremacy in key locations like Dubai and Abu Dhabi.

Online travel firms such as Booking.com and Expedia provide another layer of competition by attracting travelers through technology and marketing. Economic considerations, shifting consumer tastes, and geopolitical dynamics shape the environment, necessitating agility and innovation to remain competitive. Differentiation, customer focus, and investment in technology and sustainability are critical tactics for firms looking to flourish in this changing industry.

Recent Developments

  • In October 2023, Abdulla bin Touq, the UAE's Minister of Economy, announced plans for cooperation among Middle Eastern countries to develop a sustainable and creative tourist sector that can support their economies in the long run.
  • In July 2023, Central Hotels & Resorts (UAE), launched a sustainable tourism campaign. As part of the campaign, the brand will engage in efforts like minimizing plastic waste by using wooden alternatives.

Key Coverage in the Tourism Industry Report for the Middle East

  • Outlook for the Middle East’s Travel and Tourism Sector
  • Inbound Visitor Growth in the Middle East
  • Insights into the Middle East Tourism’s Fading Momentum
  • Outbound Visitor Growth in the Middle East
  • Revenue Analysis of the Middle East Healthcare Tourism Industry

Scope of the Report

Attribute Details
Estimated Industry Size in 2024 US$ 275.64 billion
Projected Industry Size by 2034 US$ 453.28 billion
Anticipated CAGR between 2024 to 2034 5.10% CAGR
Historical Analysis of Demand for Tourism in the Middle East 2019 to 2023
Demand Forecast for Tourism in the Middle East 2024 to 2034
Report Coverage Industry Size, Industry Trends, Analysis of Key Factors influencing Tourism in the Middle East, Insights on Global Players and their Industry Strategy in the Middle East, Ecosystem Analysis of Local and Regional Middle East Manufacturers
Key Countries Analyzed While Studying Opportunities in Tourism in the Middle East
  • Saudi Arabia
  • Bahrain
  • Jordan
  • Oman
  • Kuwait
Key Companies Profiled
  • Emirates Group
  • Saudi Arabian Airlines (Saudia)
  • Qatar Airways
  • Etihad Airways
  • Jumeirah Group
  • Marriott International
  • Hilton Worldwide
  • AccorHotels
  • InterContinental Hotels Group (IHG)
  • Emaar Hospitality Group
  • Dubai Tourism
  • Abu Dhabi Tourism & Culture Authority
  • Oman Tourism Development Company (Omran)
  • Jordan Tourism Board
  • Egypt Tourism Authority
  • Royal Caribbean Cruises
  • MSC Cruises
  • Carnival Corporation
  • TUI Group
  • Airbnb

Key Segments

By Booking Channel:

  • Phone Booking
  • Online Booking
  • In-person Booking

By Consumer Orientation:

  • Men
  • Women
  • Children

By Age Group:

  • 15 to 25 years
  • 26 to 35 years
  • 36 to 45 years
  • 46 to 55 years
  • 56 to 65 years
  • 66 to 75 years

By Tour Type:

  • Independent traveler
  • Tour Group
  • Package Traveler

By Tourist Type:

  • Domestic
  • International

Frequently Asked Questions

How Rapidly is the Demand for Tourism in the Middle East Growing? 

The expected CAGR until 2034 stands at 5.10%. 

What is the Demand Outlook for Tourism in the Middle East? 

Demand for tourism in the Middle East is projected to reach US$ 453.28 billion by 2034. 

Which Trends Influence the Demand for Tourism in the Middle East?

Sustainable packaging trends influence the demand for tourism in the Middle East.

What Strategies are used by Tourism Sector Companies in the Middle East?

Tourism services in the Middle East are emphasizing sustainability strategies.

What is the Preferred Booking Channel for Tourism in the Middle East?

Online booking channels are highly popular in the industry.

Table of Content

1. Executive Summary

    1.1. Market Outlook

    1.2. Demand-side Trends

    1.3. Supply-side Trends

    1.4. Technology Roadmap Analysis

    1.5. Analysis and Recommendations

2. Market Overview

    2.1. Market Coverage / Taxonomy

    2.2. Market Definition / Scope / Limitations

3. Market Background

    3.1. Market Dynamics

        3.1.1. Drivers

        3.1.2. Restraints

        3.1.3. Opportunity

        3.1.4. Trends

    3.2. Scenario Forecast

        3.2.1. Demand in Optimistic Scenario

        3.2.2. Demand in Likely Scenario

        3.2.3. Demand in Conservative Scenario

    3.3. Opportunity Map Analysis

    3.4. Investment Feasibility Matrix

    3.5. PESTLE and Porter’s Analysis

    3.6. Regulatory Landscape

        3.6.1. By Key Regions

        3.6.2. By Key Countries

    3.7. Regional Parent Market Outlook

4. Market Analysis 2019 to 2023 and Forecast, 2024 to 2034

    4.1. Historical Market Size Value (US$ Million) Analysis, 2019 to 2023

    4.2. Current and Future Market Size Value (US$ Million) Projections, 2024 to 2034

        4.2.1. Y-o-Y Growth Trend Analysis

        4.2.2. Absolute $ Opportunity Analysis

5. Market Analysis 2019 to 2023 and Forecast 2024 to 2034, By Booking Channel

    5.1. Introduction / Key Findings

    5.2. Historical Market Size Value (US$ Million) Analysis By Booking Channel, 2019 to 2023

    5.3. Current and Future Market Size Value (US$ Million) Analysis and Forecast By Booking Channel, 2024 to 2034

        5.3.1. Phone Booking

        5.3.2. Online Booking

        5.3.3. In-Person Booking

    5.4. Y-o-Y Growth Trend Analysis By Booking Channel, 2019 to 2023

    5.5. Absolute $ Opportunity Analysis By Booking Channel, 2024 to 2034

6. Market Analysis 2019 to 2023 and Forecast 2024 to 2034, By Consumer Orientation

    6.1. Introduction / Key Findings

    6.2. Historical Market Size Value (US$ Million) Analysis By Consumer Orientation, 2019 to 2023

    6.3. Current and Future Market Size Value (US$ Million) Analysis and Forecast By Consumer Orientation, 2024 to 2034

        6.3.1. Men

        6.3.2. Women

        6.3.3. Children

    6.4. Y-o-Y Growth Trend Analysis By Consumer Orientation, 2019 to 2023

    6.5. Absolute $ Opportunity Analysis By Consumer Orientation, 2024 to 2034

7. Market Analysis 2019 to 2023 and Forecast 2024 to 2034, By Age group 

    7.1. Introduction / Key Findings

    7.2. Historical Market Size Value (US$ Million) Analysis By Age group, 2019 to 2023

    7.3. Current and Future Market Size Value (US$ Million) Analysis and Forecast By Age group, 2024 to 2034

        7.3.1. 15-25 years

        7.3.2. 26-35 years

        7.3.3. 36-45 years

        7.3.4. 46-55 years

        7.3.5. 56-65 years

        7.3.6. 66-75 years

    7.4. Y-o-Y Growth Trend Analysis By Age group, 2019 to 2023

    7.5. Absolute $ Opportunity Analysis By Age group, 2024 to 2034

8. Market Analysis 2019 to 2023 and Forecast 2024 to 2034, By Tour Type

    8.1. Introduction / Key Findings

    8.2. Historical Market Size Value (US$ Million) Analysis By Tour Type, 2019 to 2023

    8.3. Current and Future Market Size Value (US$ Million) Analysis and Forecast By Tour Type, 2024 to 2034

        8.3.1. Independent Traveller

        8.3.2. Tour Group

        8.3.3. Package Traveller

    8.4. Y-o-Y Growth Trend Analysis By Tour Type, 2019 to 2023

    8.5. Absolute $ Opportunity Analysis By Tour Type, 2024 to 2034

9. Market Analysis 2019 to 2023 and Forecast 2024 to 2034, By Tourist Type

    9.1. Introduction / Key Findings

    9.2. Historical Market Size Value (US$ Million) Analysis By Tourist Type, 2019 to 2023

    9.3. Current and Future Market Size Value (US$ Million) Analysis and Forecast By Tourist Type, 2024 to 2034

        9.3.1. Domestic Tourist

        9.3.2. International Tourist

    9.4. Y-o-Y Growth Trend Analysis By Tourist Type, 2019 to 2023

    9.5. Absolute $ Opportunity Analysis By Tourist Type, 2024 to 2034

10. Market Analysis 2019 to 2023 and Forecast 2024 to 2034, By Country

    10.1. Introduction

    10.2. Historical Market Size Value (US$ Million) Analysis By Country, 2019 to 2023

    10.3. Current Market Size Value (US$ Million) Analysis and Forecast By Country, 2024 to 2034

        10.3.1. Saudi Arabia

        10.3.2. UAE

        10.3.3. Qatar

        10.3.4. Kuwait

        10.3.5. Bahrain

        10.3.6. Turkey

        10.3.7. Rest of Middle East

    10.4. Market Attractiveness Analysis By Country

11. Saudi Arabia Market Analysis 2019 to 2023 and Forecast 2024 to 2034, By Region

    11.1. Historical Market Size Value (US$ Million) Trend Analysis By Market Taxonomy, 2019 to 2023

    11.2. Market Size Value (US$ Million) Forecast By Market Taxonomy, 2024 to 2034

        11.2.1. By Region

        11.2.2. By Booking Channel

        11.2.3. By Consumer Orientation

        11.2.4. By Age group

        11.2.5. By Tour Type

        11.2.6. By Tourist Type

    11.3. Market Attractiveness Analysis

        11.3.1. By Region

        11.3.2. By Booking Channel

        11.3.3. By Consumer Orientation

        11.3.4. By Age group

        11.3.5. By Tour Type

        11.3.6. By Tourist Type

    11.4. Key Takeaways

12. UAE Market Analysis 2019 to 2023 and Forecast 2024 to 2034, By Region

    12.1. Historical Market Size Value (US$ Million) Trend Analysis By Market Taxonomy, 2019 to 2023

    12.2. Market Size Value (US$ Million) Forecast By Market Taxonomy, 2024 to 2034

        12.2.1. By Region

        12.2.2. By Booking Channel

        12.2.3. By Consumer Orientation

        12.2.4. By Age group

        12.2.5. By Tour Type

        12.2.6. By Tourist Type

    12.3. Market Attractiveness Analysis

        12.3.1. By Region

        12.3.2. By Booking Channel

        12.3.3. By Consumer Orientation

        12.3.4. By Age group

        12.3.5. By Tour Type

        12.3.6. By Tourist Type

    12.4. Key Takeaways

13. Qatar Market Analysis 2019 to 2023 and Forecast 2024 to 2034, By Region

    13.1. Historical Market Size Value (US$ Million) Trend Analysis By Market Taxonomy, 2019 to 2023

    13.2. Market Size Value (US$ Million) Forecast By Market Taxonomy, 2024 to 2034

        13.2.1. By Region

        13.2.2. By Booking Channel

        13.2.3. By Consumer Orientation

        13.2.4. By Age group

        13.2.5. By Tour Type

        13.2.6. By Tourist Type

    13.3. Market Attractiveness Analysis

        13.3.1. By Region

        13.3.2. By Booking Channel

        13.3.3. By Consumer Orientation

        13.3.4. By Age group

        13.3.5. By Tour Type

        13.3.6. By Tourist Type

    13.4. Key Takeaways

14. Kuwait Market Analysis 2019 to 2023 and Forecast 2024 to 2034, By Region

    14.1. Historical Market Size Value (US$ Million) Trend Analysis By Market Taxonomy, 2019 to 2023

    14.2. Market Size Value (US$ Million) Forecast By Market Taxonomy, 2024 to 2034

        14.2.1. By Region

        14.2.2. By Booking Channel

        14.2.3. By Consumer Orientation

        14.2.4. By Age group

        14.2.5. By Tour Type

        14.2.6. By Tourist Type

    14.3. Market Attractiveness Analysis

        14.3.1. By Region

        14.3.2. By Booking Channel

        14.3.3. By Consumer Orientation

        14.3.4. By Age group

        14.3.5. By Tour Type

        14.3.6. By Tourist Type

    14.4. Key Takeaways

15. Bahrain Market Analysis 2019 to 2023 and Forecast 2024 to 2034, By Region

    15.1. Historical Market Size Value (US$ Million) Trend Analysis By Market Taxonomy, 2019 to 2023

    15.2. Market Size Value (US$ Million) Forecast By Market Taxonomy, 2024 to 2034

        15.2.1. By Region

        15.2.2. By Booking Channel

        15.2.3. By Consumer Orientation

        15.2.4. By Age group

        15.2.5. By Tour Type

        15.2.6. By Tourist Type

    15.3. Market Attractiveness Analysis

        15.3.1. By Region

        15.3.2. By Booking Channel

        15.3.3. By Consumer Orientation

        15.3.4. By Age group

        15.3.5. By Tour Type

        15.3.6. By Tourist Type

    15.4. Key Takeaways

16. Turkey Market Analysis 2019 to 2023 and Forecast 2024 to 2034, By Region

    16.1. Historical Market Size Value (US$ Million) Trend Analysis By Market Taxonomy, 2019 to 2023

    16.2. Market Size Value (US$ Million) Forecast By Market Taxonomy, 2024 to 2034

        16.2.1. By Region

        16.2.2. By Booking Channel

        16.2.3. By Consumer Orientation

        16.2.4. By Age group

        16.2.5. By Tour Type

        16.2.6. By Tourist Type

    16.3. Market Attractiveness Analysis

        16.3.1. By Region

        16.3.2. By Booking Channel

        16.3.3. By Consumer Orientation

        16.3.4. By Age group

        16.3.5. By Tour Type

        16.3.6. By Tourist Type

    16.4. Key Takeaways

17. Market Analysis 2019 to 2023 and Forecast 2024 to 2034, By Country

    17.1. Historical Market Size Value (US$ Million) Trend Analysis By Market Taxonomy, 2019 to 2023

    17.2. Market Size Value (US$ Million) Forecast By Market Taxonomy, 2024 to 2034

        17.2.1. By Country

        17.2.2. By Booking Channel

        17.2.3. By Consumer Orientation

        17.2.4. By Age group

        17.2.5. By Tour Type

        17.2.6. By Tourist Type

    17.3. Market Attractiveness Analysis

        17.3.1. By Country

        17.3.2. By Booking Channel

        17.3.3. By Consumer Orientation

        17.3.4. By Age group

        17.3.5. By Tour Type

        17.3.6. By Tourist Type

    17.4. Key Takeaways

18. Market Structure Analysis

    18.1. Competition Dashboard

    18.2. Competition Benchmarking

    18.3. Market Share Analysis of Top Players

        18.3.1. By Country

        18.3.2. By Booking Channel

        18.3.3. By Consumer Orientation

        18.3.4. By Age group

        18.3.5. By Tour Type

        18.3.6. By Tourist Type

19. Competition Analysis

    19.1. Competition Deep Dive

        19.1.1. Explorer Tours

            19.1.1.1. Overview

            19.1.1.2. Product Portfolio

            19.1.1.3. Profitability by Market Segments

            19.1.1.4. Sales Footprint

            19.1.1.5. Strategy Overview

                19.1.1.5.1. Marketing Strategy

        19.1.2. I Love Adventures

            19.1.2.1. Overview

            19.1.2.2. Product Portfolio

            19.1.2.3. Profitability by Market Segments

            19.1.2.4. Sales Footprint

            19.1.2.5. Strategy Overview

                19.1.2.5.1. Marketing Strategy

        19.1.3. Bin Dasmal LLC

            19.1.3.1. Overview

            19.1.3.2. Product Portfolio

            19.1.3.3. Profitability by Market Segments

            19.1.3.4. Sales Footprint

            19.1.3.5. Strategy Overview

                19.1.3.5.1. Marketing Strategy

        19.1.4. Compass International Tours

            19.1.4.1. Overview

            19.1.4.2. Product Portfolio

            19.1.4.3. Profitability by Market Segments

            19.1.4.4. Sales Footprint

            19.1.4.5. Strategy Overview

                19.1.4.5.1. Marketing Strategy

        19.1.5. Al Majid Travel and Tourism

            19.1.5.1. Overview

            19.1.5.2. Product Portfolio

            19.1.5.3. Profitability by Market Segments

            19.1.5.4. Sales Footprint

            19.1.5.5. Strategy Overview

                19.1.5.5.1. Marketing Strategy

        19.1.6. Expedia

            19.1.6.1. Overview

            19.1.6.2. Product Portfolio

            19.1.6.3. Profitability by Market Segments

            19.1.6.4. Sales Footprint

            19.1.6.5. Strategy Overview

                19.1.6.5.1. Marketing Strategy

        19.1.7. Kurban Tours

            19.1.7.1. Overview

            19.1.7.2. Product Portfolio

            19.1.7.3. Profitability by Market Segments

            19.1.7.4. Sales Footprint

            19.1.7.5. Strategy Overview

                19.1.7.5.1. Marketing Strategy

        19.1.8. Sun and Sand & Travel

            19.1.8.1. Overview

            19.1.8.2. Product Portfolio

            19.1.8.3. Profitability by Market Segments

            19.1.8.4. Sales Footprint

            19.1.8.5. Strategy Overview

                19.1.8.5.1. Marketing Strategy

        19.1.9. Thomas Cook

            19.1.9.1. Overview

            19.1.9.2. Product Portfolio

            19.1.9.3. Profitability by Market Segments

            19.1.9.4. Sales Footprint

            19.1.9.5. Strategy Overview

                19.1.9.5.1. Marketing Strategy

        19.1.10. Saadi Tours and Travels

            19.1.10.1. Overview

            19.1.10.2. Product Portfolio

            19.1.10.3. Profitability by Market Segments

            19.1.10.4. Sales Footprint

            19.1.10.5. Strategy Overview

                19.1.10.5.1. Marketing Strategy

20. Assumptions & Acronyms Used

21. Research Methodology

Don't pay for what you don't need

Customize your report by selecting specific countries or regions and save 30%!

List of Tables

Table 1: Market Value (US$ Million) Forecast by Country, 2019 to 2034

Table 2: Market Value (US$ Million) Forecast by Booking Channel, 2019 to 2034

Table 3: Market Value (US$ Million) Forecast by Consumer Orientation, 2019 to 2034

Table 4: Market Value (US$ Million) Forecast by Age group, 2019 to 2034

Table 5: Market Value (US$ Million) Forecast by Tour Type, 2019 to 2034

Table 6: Market Value (US$ Million) Forecast by Tourist Type, 2019 to 2034

Table 7: Saudi Arabia Market Value (US$ Million) Forecast by Region, 2019 to 2034

Table 8: Saudi Arabia Market Value (US$ Million) Forecast by Booking Channel, 2019 to 2034

Table 9: Saudi Arabia Market Value (US$ Million) Forecast by Consumer Orientation, 2019 to 2034

Table 10: Saudi Arabia Market Value (US$ Million) Forecast by Age group, 2019 to 2034

Table 11: Saudi Arabia Market Value (US$ Million) Forecast by Tour Type, 2019 to 2034

Table 12: Saudi Arabia Market Value (US$ Million) Forecast by Tourist Type, 2019 to 2034

Table 13: UAE Market Value (US$ Million) Forecast by Region, 2019 to 2034

Table 14: UAE Market Value (US$ Million) Forecast by Booking Channel, 2019 to 2034

Table 15: UAE Market Value (US$ Million) Forecast by Consumer Orientation, 2019 to 2034

Table 16: UAE Market Value (US$ Million) Forecast by Age group, 2019 to 2034

Table 17: UAE Market Value (US$ Million) Forecast by Tour Type, 2019 to 2034

Table 18: UAE Market Value (US$ Million) Forecast by Tourist Type, 2019 to 2034

Table 19: Qatar Market Value (US$ Million) Forecast by Region, 2019 to 2034

Table 20: Qatar Market Value (US$ Million) Forecast by Booking Channel, 2019 to 2034

Table 21: Qatar Market Value (US$ Million) Forecast by Consumer Orientation, 2019 to 2034

Table 22: Qatar Market Value (US$ Million) Forecast by Age group, 2019 to 2034

Table 23: Qatar Market Value (US$ Million) Forecast by Tour Type, 2019 to 2034

Table 24: Qatar Market Value (US$ Million) Forecast by Tourist Type, 2019 to 2034

Table 25: Kuwait Market Value (US$ Million) Forecast by Region, 2019 to 2034

Table 26: Kuwait Market Value (US$ Million) Forecast by Booking Channel, 2019 to 2034

Table 27: Kuwait Market Value (US$ Million) Forecast by Consumer Orientation, 2019 to 2034

Table 28: Kuwait Market Value (US$ Million) Forecast by Age group, 2019 to 2034

Table 29: Kuwait Market Value (US$ Million) Forecast by Tour Type, 2019 to 2034

Table 30: Kuwait Market Value (US$ Million) Forecast by Tourist Type, 2019 to 2034

Table 31: Bahrain Market Value (US$ Million) Forecast by Region, 2019 to 2034

Table 32: Bahrain Market Value (US$ Million) Forecast by Booking Channel, 2019 to 2034

Table 33: Bahrain Market Value (US$ Million) Forecast by Consumer Orientation, 2019 to 2034

Table 34: Bahrain Market Value (US$ Million) Forecast by Age group, 2019 to 2034

Table 35: Bahrain Market Value (US$ Million) Forecast by Tour Type, 2019 to 2034

Table 36: Bahrain Market Value (US$ Million) Forecast by Tourist Type, 2019 to 2034

Table 37: Turkey Market Value (US$ Million) Forecast by Region, 2019 to 2034

Table 38: Turkey Market Value (US$ Million) Forecast by Booking Channel, 2019 to 2034

Table 39: Turkey Market Value (US$ Million) Forecast by Consumer Orientation, 2019 to 2034

Table 40: Turkey Market Value (US$ Million) Forecast by Age group, 2019 to 2034

Table 41: Turkey Market Value (US$ Million) Forecast by Tour Type, 2019 to 2034

Table 42: Turkey Market Value (US$ Million) Forecast by Tourist Type, 2019 to 2034

Table 43: Market Value (US$ Million) Forecast by Country, 2019 to 2034

Table 44: Market Value (US$ Million) Forecast by Booking Channel, 2019 to 2034

Table 45: Market Value (US$ Million) Forecast by Consumer Orientation, 2019 to 2034

Table 46: Market Value (US$ Million) Forecast by Age group, 2019 to 2034

Table 47: Market Value (US$ Million) Forecast by Tour Type, 2019 to 2034

Table 48: Market Value (US$ Million) Forecast by Tourist Type, 2019 to 2034
Ronak Shah
Ronak Shah

Principal Consultant

Talk to Analyst

Find your sweet spots for generating winning opportunities in this market.

List of Charts

Figure 1: Market Value (US$ Million) by Booking Channel, 2024 to 2034

Figure 2: Market Value (US$ Million) by Consumer Orientation, 2024 to 2034

Figure 3: Market Value (US$ Million) by Age group, 2024 to 2034

Figure 4: Market Value (US$ Million) by Tour Type, 2024 to 2034

Figure 5: Market Value (US$ Million) by Tourist Type, 2024 to 2034

Figure 6: Market Value (US$ Million) by Country, 2024 to 2034

Figure 7: Market Value (US$ Million) Analysis by Country, 2019 to 2034

Figure 8: Market Value Share (%) and BPS Analysis by Country, 2024 to 2034

Figure 9: Market Y-o-Y Growth (%) Projections by Country, 2024 to 2034

Figure 10: Market Value (US$ Million) Analysis by Booking Channel, 2019 to 2034

Figure 11: Market Value Share (%) and BPS Analysis by Booking Channel, 2024 to 2034

Figure 12: Market Y-o-Y Growth (%) Projections by Booking Channel, 2024 to 2034

Figure 13: Market Value (US$ Million) Analysis by Consumer Orientation, 2019 to 2034

Figure 14: Market Value Share (%) and BPS Analysis by Consumer Orientation, 2024 to 2034

Figure 15: Market Y-o-Y Growth (%) Projections by Consumer Orientation, 2024 to 2034

Figure 16: Market Value (US$ Million) Analysis by Age group, 2019 to 2034

Figure 17: Market Value Share (%) and BPS Analysis by Age group, 2024 to 2034

Figure 18: Market Y-o-Y Growth (%) Projections by Age group, 2024 to 2034

Figure 19: Market Value (US$ Million) Analysis by Tour Type, 2019 to 2034

Figure 20: Market Value Share (%) and BPS Analysis by Tour Type, 2024 to 2034

Figure 21: Market Y-o-Y Growth (%) Projections by Tour Type, 2024 to 2034

Figure 22: Market Value (US$ Million) Analysis by Tourist Type, 2019 to 2034

Figure 23: Market Value Share (%) and BPS Analysis by Tourist Type, 2024 to 2034

Figure 24: Market Y-o-Y Growth (%) Projections by Tourist Type, 2024 to 2034

Figure 25: Market Attractiveness by Booking Channel, 2024 to 2034

Figure 26: Market Attractiveness by Consumer Orientation, 2024 to 2034

Figure 27: Market Attractiveness by Age group, 2024 to 2034

Figure 28: Market Attractiveness by Tour Type, 2024 to 2034

Figure 29: Market Attractiveness by Tourist Type, 2024 to 2034

Figure 30: Market Attractiveness by Country, 2024 to 2034

Figure 31: Saudi Arabia Market Value (US$ Million) by Booking Channel, 2024 to 2034

Figure 32: Saudi Arabia Market Value (US$ Million) by Consumer Orientation, 2024 to 2034

Figure 33: Saudi Arabia Market Value (US$ Million) by Age group, 2024 to 2034

Figure 34: Saudi Arabia Market Value (US$ Million) by Tour Type, 2024 to 2034

Figure 35: Saudi Arabia Market Value (US$ Million) by Tourist Type, 2024 to 2034

Figure 36: Saudi Arabia Market Value (US$ Million) by Region, 2024 to 2034

Figure 37: Saudi Arabia Market Value (US$ Million) Analysis by Region, 2019 to 2034

Figure 38: Saudi Arabia Market Value Share (%) and BPS Analysis by Region, 2024 to 2034

Figure 39: Saudi Arabia Market Y-o-Y Growth (%) Projections by Region, 2024 to 2034

Figure 40: Saudi Arabia Market Value (US$ Million) Analysis by Booking Channel, 2019 to 2034

Figure 41: Saudi Arabia Market Value Share (%) and BPS Analysis by Booking Channel, 2024 to 2034

Figure 42: Saudi Arabia Market Y-o-Y Growth (%) Projections by Booking Channel, 2024 to 2034

Figure 43: Saudi Arabia Market Value (US$ Million) Analysis by Consumer Orientation, 2019 to 2034

Figure 44: Saudi Arabia Market Value Share (%) and BPS Analysis by Consumer Orientation, 2024 to 2034

Figure 45: Saudi Arabia Market Y-o-Y Growth (%) Projections by Consumer Orientation, 2024 to 2034

Figure 46: Saudi Arabia Market Value (US$ Million) Analysis by Age group, 2019 to 2034

Figure 47: Saudi Arabia Market Value Share (%) and BPS Analysis by Age group, 2024 to 2034

Figure 48: Saudi Arabia Market Y-o-Y Growth (%) Projections by Age group, 2024 to 2034

Figure 49: Saudi Arabia Market Value (US$ Million) Analysis by Tour Type, 2019 to 2034

Figure 50: Saudi Arabia Market Value Share (%) and BPS Analysis by Tour Type, 2024 to 2034

Figure 51: Saudi Arabia Market Y-o-Y Growth (%) Projections by Tour Type, 2024 to 2034

Figure 52: Saudi Arabia Market Value (US$ Million) Analysis by Tourist Type, 2019 to 2034

Figure 53: Saudi Arabia Market Value Share (%) and BPS Analysis by Tourist Type, 2024 to 2034

Figure 54: Saudi Arabia Market Y-o-Y Growth (%) Projections by Tourist Type, 2024 to 2034

Figure 55: Saudi Arabia Market Attractiveness by Booking Channel, 2024 to 2034

Figure 56: Saudi Arabia Market Attractiveness by Consumer Orientation, 2024 to 2034

Figure 57: Saudi Arabia Market Attractiveness by Age group, 2024 to 2034

Figure 58: Saudi Arabia Market Attractiveness by Tour Type, 2024 to 2034

Figure 59: Saudi Arabia Market Attractiveness by Tourist Type, 2024 to 2034

Figure 60: Saudi Arabia Market Attractiveness by Region, 2024 to 2034

Figure 61: UAE Market Value (US$ Million) by Booking Channel, 2024 to 2034

Figure 62: UAE Market Value (US$ Million) by Consumer Orientation, 2024 to 2034

Figure 63: UAE Market Value (US$ Million) by Age group, 2024 to 2034

Figure 64: UAE Market Value (US$ Million) by Tour Type, 2024 to 2034

Figure 65: UAE Market Value (US$ Million) by Tourist Type, 2024 to 2034

Figure 66: UAE Market Value (US$ Million) by Region, 2024 to 2034

Figure 67: UAE Market Value (US$ Million) Analysis by Region, 2019 to 2034

Figure 68: UAE Market Value Share (%) and BPS Analysis by Region, 2024 to 2034

Figure 69: UAE Market Y-o-Y Growth (%) Projections by Region, 2024 to 2034

Figure 70: UAE Market Value (US$ Million) Analysis by Booking Channel, 2019 to 2034

Figure 71: UAE Market Value Share (%) and BPS Analysis by Booking Channel, 2024 to 2034

Figure 72: UAE Market Y-o-Y Growth (%) Projections by Booking Channel, 2024 to 2034

Figure 73: UAE Market Value (US$ Million) Analysis by Consumer Orientation, 2019 to 2034

Figure 74: UAE Market Value Share (%) and BPS Analysis by Consumer Orientation, 2024 to 2034

Figure 75: UAE Market Y-o-Y Growth (%) Projections by Consumer Orientation, 2024 to 2034

Figure 76: UAE Market Value (US$ Million) Analysis by Age group, 2019 to 2034

Figure 77: UAE Market Value Share (%) and BPS Analysis by Age group, 2024 to 2034

Figure 78: UAE Market Y-o-Y Growth (%) Projections by Age group, 2024 to 2034

Figure 79: UAE Market Value (US$ Million) Analysis by Tour Type, 2019 to 2034

Figure 80: UAE Market Value Share (%) and BPS Analysis by Tour Type, 2024 to 2034

Figure 81: UAE Market Y-o-Y Growth (%) Projections by Tour Type, 2024 to 2034

Figure 82: UAE Market Value (US$ Million) Analysis by Tourist Type, 2019 to 2034

Figure 83: UAE Market Value Share (%) and BPS Analysis by Tourist Type, 2024 to 2034

Figure 84: UAE Market Y-o-Y Growth (%) Projections by Tourist Type, 2024 to 2034

Figure 85: UAE Market Attractiveness by Booking Channel, 2024 to 2034

Figure 86: UAE Market Attractiveness by Consumer Orientation, 2024 to 2034

Figure 87: UAE Market Attractiveness by Age group, 2024 to 2034

Figure 88: UAE Market Attractiveness by Tour Type, 2024 to 2034

Figure 89: UAE Market Attractiveness by Tourist Type, 2024 to 2034

Figure 90: UAE Market Attractiveness by Region, 2024 to 2034

Figure 91: Qatar Market Value (US$ Million) by Booking Channel, 2024 to 2034

Figure 92: Qatar Market Value (US$ Million) by Consumer Orientation, 2024 to 2034

Figure 93: Qatar Market Value (US$ Million) by Age group, 2024 to 2034

Figure 94: Qatar Market Value (US$ Million) by Tour Type, 2024 to 2034

Figure 95: Qatar Market Value (US$ Million) by Tourist Type, 2024 to 2034

Figure 96: Qatar Market Value (US$ Million) by Region, 2024 to 2034

Figure 97: Qatar Market Value (US$ Million) Analysis by Region, 2019 to 2034

Figure 98: Qatar Market Value Share (%) and BPS Analysis by Region, 2024 to 2034

Figure 99: Qatar Market Y-o-Y Growth (%) Projections by Region, 2024 to 2034

Figure 100: Qatar Market Value (US$ Million) Analysis by Booking Channel, 2019 to 2034

Figure 101: Qatar Market Value Share (%) and BPS Analysis by Booking Channel, 2024 to 2034

Figure 102: Qatar Market Y-o-Y Growth (%) Projections by Booking Channel, 2024 to 2034

Figure 103: Qatar Market Value (US$ Million) Analysis by Consumer Orientation, 2019 to 2034

Figure 104: Qatar Market Value Share (%) and BPS Analysis by Consumer Orientation, 2024 to 2034

Figure 105: Qatar Market Y-o-Y Growth (%) Projections by Consumer Orientation, 2024 to 2034

Figure 106: Qatar Market Value (US$ Million) Analysis by Age group, 2019 to 2034

Figure 107: Qatar Market Value Share (%) and BPS Analysis by Age group, 2024 to 2034

Figure 108: Qatar Market Y-o-Y Growth (%) Projections by Age group, 2024 to 2034

Figure 109: Qatar Market Value (US$ Million) Analysis by Tour Type, 2019 to 2034

Figure 110: Qatar Market Value Share (%) and BPS Analysis by Tour Type, 2024 to 2034

Figure 111: Qatar Market Y-o-Y Growth (%) Projections by Tour Type, 2024 to 2034

Figure 112: Qatar Market Value (US$ Million) Analysis by Tourist Type, 2019 to 2034

Figure 113: Qatar Market Value Share (%) and BPS Analysis by Tourist Type, 2024 to 2034

Figure 114: Qatar Market Y-o-Y Growth (%) Projections by Tourist Type, 2024 to 2034

Figure 115: Qatar Market Attractiveness by Booking Channel, 2024 to 2034

Figure 116: Qatar Market Attractiveness by Consumer Orientation, 2024 to 2034

Figure 117: Qatar Market Attractiveness by Age group, 2024 to 2034

Figure 118: Qatar Market Attractiveness by Tour Type, 2024 to 2034

Figure 119: Qatar Market Attractiveness by Tourist Type, 2024 to 2034

Figure 120: Qatar Market Attractiveness by Region, 2024 to 2034

Figure 121: Kuwait Market Value (US$ Million) by Booking Channel, 2024 to 2034

Figure 122: Kuwait Market Value (US$ Million) by Consumer Orientation, 2024 to 2034

Figure 123: Kuwait Market Value (US$ Million) by Age group, 2024 to 2034

Figure 124: Kuwait Market Value (US$ Million) by Tour Type, 2024 to 2034

Figure 125: Kuwait Market Value (US$ Million) by Tourist Type, 2024 to 2034

Figure 126: Kuwait Market Value (US$ Million) by Region, 2024 to 2034

Figure 127: Kuwait Market Value (US$ Million) Analysis by Region, 2019 to 2034

Figure 128: Kuwait Market Value Share (%) and BPS Analysis by Region, 2024 to 2034

Figure 129: Kuwait Market Y-o-Y Growth (%) Projections by Region, 2024 to 2034

Figure 130: Kuwait Market Value (US$ Million) Analysis by Booking Channel, 2019 to 2034

Figure 131: Kuwait Market Value Share (%) and BPS Analysis by Booking Channel, 2024 to 2034

Figure 132: Kuwait Market Y-o-Y Growth (%) Projections by Booking Channel, 2024 to 2034

Figure 133: Kuwait Market Value (US$ Million) Analysis by Consumer Orientation, 2019 to 2034

Figure 134: Kuwait Market Value Share (%) and BPS Analysis by Consumer Orientation, 2024 to 2034

Figure 135: Kuwait Market Y-o-Y Growth (%) Projections by Consumer Orientation, 2024 to 2034

Figure 136: Kuwait Market Value (US$ Million) Analysis by Age group, 2019 to 2034

Figure 137: Kuwait Market Value Share (%) and BPS Analysis by Age group, 2024 to 2034

Figure 138: Kuwait Market Y-o-Y Growth (%) Projections by Age group, 2024 to 2034

Figure 139: Kuwait Market Value (US$ Million) Analysis by Tour Type, 2019 to 2034

Figure 140: Kuwait Market Value Share (%) and BPS Analysis by Tour Type, 2024 to 2034

Figure 141: Kuwait Market Y-o-Y Growth (%) Projections by Tour Type, 2024 to 2034

Figure 142: Kuwait Market Value (US$ Million) Analysis by Tourist Type, 2019 to 2034

Figure 143: Kuwait Market Value Share (%) and BPS Analysis by Tourist Type, 2024 to 2034

Figure 144: Kuwait Market Y-o-Y Growth (%) Projections by Tourist Type, 2024 to 2034

Figure 145: Kuwait Market Attractiveness by Booking Channel, 2024 to 2034

Figure 146: Kuwait Market Attractiveness by Consumer Orientation, 2024 to 2034

Figure 147: Kuwait Market Attractiveness by Age group, 2024 to 2034

Figure 148: Kuwait Market Attractiveness by Tour Type, 2024 to 2034

Figure 149: Kuwait Market Attractiveness by Tourist Type, 2024 to 2034

Figure 150: Kuwait Market Attractiveness by Region, 2024 to 2034

Figure 151: Bahrain Market Value (US$ Million) by Booking Channel, 2024 to 2034

Figure 152: Bahrain Market Value (US$ Million) by Consumer Orientation, 2024 to 2034

Figure 153: Bahrain Market Value (US$ Million) by Age group, 2024 to 2034

Figure 154: Bahrain Market Value (US$ Million) by Tour Type, 2024 to 2034

Figure 155: Bahrain Market Value (US$ Million) by Tourist Type, 2024 to 2034

Figure 156: Bahrain Market Value (US$ Million) by Region, 2024 to 2034

Figure 157: Bahrain Market Value (US$ Million) Analysis by Region, 2019 to 2034

Figure 158: Bahrain Market Value Share (%) and BPS Analysis by Region, 2024 to 2034

Figure 159: Bahrain Market Y-o-Y Growth (%) Projections by Region, 2024 to 2034

Figure 160: Bahrain Market Value (US$ Million) Analysis by Booking Channel, 2019 to 2034

Figure 161: Bahrain Market Value Share (%) and BPS Analysis by Booking Channel, 2024 to 2034

Figure 162: Bahrain Market Y-o-Y Growth (%) Projections by Booking Channel, 2024 to 2034

Figure 163: Bahrain Market Value (US$ Million) Analysis by Consumer Orientation, 2019 to 2034

Figure 164: Bahrain Market Value Share (%) and BPS Analysis by Consumer Orientation, 2024 to 2034

Figure 165: Bahrain Market Y-o-Y Growth (%) Projections by Consumer Orientation, 2024 to 2034

Figure 166: Bahrain Market Value (US$ Million) Analysis by Age group, 2019 to 2034

Figure 167: Bahrain Market Value Share (%) and BPS Analysis by Age group, 2024 to 2034

Figure 168: Bahrain Market Y-o-Y Growth (%) Projections by Age group, 2024 to 2034

Figure 169: Bahrain Market Value (US$ Million) Analysis by Tour Type, 2019 to 2034

Figure 170: Bahrain Market Value Share (%) and BPS Analysis by Tour Type, 2024 to 2034

Figure 171: Bahrain Market Y-o-Y Growth (%) Projections by Tour Type, 2024 to 2034

Figure 172: Bahrain Market Value (US$ Million) Analysis by Tourist Type, 2019 to 2034

Figure 173: Bahrain Market Value Share (%) and BPS Analysis by Tourist Type, 2024 to 2034

Figure 174: Bahrain Market Y-o-Y Growth (%) Projections by Tourist Type, 2024 to 2034

Figure 175: Bahrain Market Attractiveness by Booking Channel, 2024 to 2034

Figure 176: Bahrain Market Attractiveness by Consumer Orientation, 2024 to 2034

Figure 177: Bahrain Market Attractiveness by Age group, 2024 to 2034

Figure 178: Bahrain Market Attractiveness by Tour Type, 2024 to 2034

Figure 179: Bahrain Market Attractiveness by Tourist Type, 2024 to 2034

Figure 180: Bahrain Market Attractiveness by Region, 2024 to 2034

Figure 181: Turkey Market Value (US$ Million) by Booking Channel, 2024 to 2034

Figure 182: Turkey Market Value (US$ Million) by Consumer Orientation, 2024 to 2034

Figure 183: Turkey Market Value (US$ Million) by Age group, 2024 to 2034

Figure 184: Turkey Market Value (US$ Million) by Tour Type, 2024 to 2034

Figure 185: Turkey Market Value (US$ Million) by Tourist Type, 2024 to 2034

Figure 186: Turkey Market Value (US$ Million) by Region, 2024 to 2034

Figure 187: Turkey Market Value (US$ Million) Analysis by Region, 2019 to 2034

Figure 188: Turkey Market Value Share (%) and BPS Analysis by Region, 2024 to 2034

Figure 189: Turkey Market Y-o-Y Growth (%) Projections by Region, 2024 to 2034

Figure 190: Turkey Market Value (US$ Million) Analysis by Booking Channel, 2019 to 2034

Figure 191: Turkey Market Value Share (%) and BPS Analysis by Booking Channel, 2024 to 2034

Figure 192: Turkey Market Y-o-Y Growth (%) Projections by Booking Channel, 2024 to 2034

Figure 193: Turkey Market Value (US$ Million) Analysis by Consumer Orientation, 2019 to 2034

Figure 194: Turkey Market Value Share (%) and BPS Analysis by Consumer Orientation, 2024 to 2034

Figure 195: Turkey Market Y-o-Y Growth (%) Projections by Consumer Orientation, 2024 to 2034

Figure 196: Turkey Market Value (US$ Million) Analysis by Age group, 2019 to 2034

Figure 197: Turkey Market Value Share (%) and BPS Analysis by Age group, 2024 to 2034

Figure 198: Turkey Market Y-o-Y Growth (%) Projections by Age group, 2024 to 2034

Figure 199: Turkey Market Value (US$ Million) Analysis by Tour Type, 2019 to 2034

Figure 200: Turkey Market Value Share (%) and BPS Analysis by Tour Type, 2024 to 2034

Figure 201: Turkey Market Y-o-Y Growth (%) Projections by Tour Type, 2024 to 2034

Figure 202: Turkey Market Value (US$ Million) Analysis by Tourist Type, 2019 to 2034

Figure 203: Turkey Market Value Share (%) and BPS Analysis by Tourist Type, 2024 to 2034

Figure 204: Turkey Market Y-o-Y Growth (%) Projections by Tourist Type, 2024 to 2034

Figure 205: Turkey Market Attractiveness by Booking Channel, 2024 to 2034

Figure 206: Turkey Market Attractiveness by Consumer Orientation, 2024 to 2034

Figure 207: Turkey Market Attractiveness by Age group, 2024 to 2034

Figure 208: Turkey Market Attractiveness by Tour Type, 2024 to 2034

Figure 209: Turkey Market Attractiveness by Tourist Type, 2024 to 2034

Figure 210: Turkey Market Attractiveness by Region, 2024 to 2034

Figure 211: Market Value (US$ Million) by Booking Channel, 2024 to 2034

Figure 212: Market Value (US$ Million) by Consumer Orientation, 2024 to 2034

Figure 213: Market Value (US$ Million) by Age group, 2024 to 2034

Figure 214: Market Value (US$ Million) by Tour Type, 2024 to 2034

Figure 215: Market Value (US$ Million) by Tourist Type, 2024 to 2034

Figure 216: Market Value (US$ Million) by Country, 2024 to 2034

Figure 217: Market Value (US$ Million) Analysis by Country, 2019 to 2034

Figure 218: Market Value Share (%) and BPS Analysis by Country, 2024 to 2034

Figure 219: Market Y-o-Y Growth (%) Projections by Country, 2024 to 2034

Figure 220: Market Value (US$ Million) Analysis by Booking Channel, 2019 to 2034

Figure 221: Market Value Share (%) and BPS Analysis by Booking Channel, 2024 to 2034

Figure 222: Market Y-o-Y Growth (%) Projections by Booking Channel, 2024 to 2034

Figure 223: Market Value (US$ Million) Analysis by Consumer Orientation, 2019 to 2034

Figure 224: Market Value Share (%) and BPS Analysis by Consumer Orientation, 2024 to 2034

Figure 225: Market Y-o-Y Growth (%) Projections by Consumer Orientation, 2024 to 2034

Figure 226: Market Value (US$ Million) Analysis by Age group, 2019 to 2034

Figure 227: Market Value Share (%) and BPS Analysis by Age group, 2024 to 2034

Figure 228: Market Y-o-Y Growth (%) Projections by Age group, 2024 to 2034

Figure 229: Market Value (US$ Million) Analysis by Tour Type, 2019 to 2034

Figure 230: Market Value Share (%) and BPS Analysis by Tour Type, 2024 to 2034

Figure 231: Market Y-o-Y Growth (%) Projections by Tour Type, 2024 to 2034

Figure 232: Market Value (US$ Million) Analysis by Tourist Type, 2019 to 2034

Figure 233: Market Value Share (%) and BPS Analysis by Tourist Type, 2024 to 2034

Figure 234: Market Y-o-Y Growth (%) Projections by Tourist Type, 2024 to 2034

Figure 235: Market Attractiveness by Booking Channel, 2024 to 2034

Figure 236: Market Attractiveness by Consumer Orientation, 2024 to 2034

Figure 237: Market Attractiveness by Age group, 2024 to 2034

Figure 238: Market Attractiveness by Tour Type, 2024 to 2034

Figure 239: Market Attractiveness by Tourist Type, 2024 to 2034

Figure 240: Market Attractiveness by Country, 2024 to 2034

Recommendations

Travel and Tourism

Tourism Market

Published : November 2022

Explore Travel and Tourism Insights

View Reports

Sales Analysis of Tourism Industry in the Middle East