Generator Sales Market
Market Insights on Generator Sales covering sales outlook, demand forecast & up-to-date key trends
Generator Sales Market By Fuel Type (Gas, Diesel), Application (Prime & Continuous, Standby), Power Rating (Up To 50 KW, above 3,500 KW), End User (Industrial, Utilities/Power Generation), Sales Channel (Direct, Indirect), Design (Stationary, Portable) & Region - Forecast 2022 - 2032
Generator Sales Market Outlook (2022-2032)
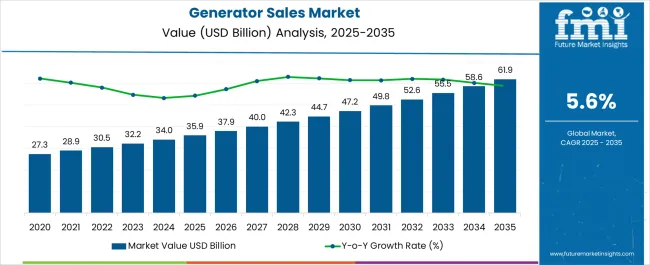
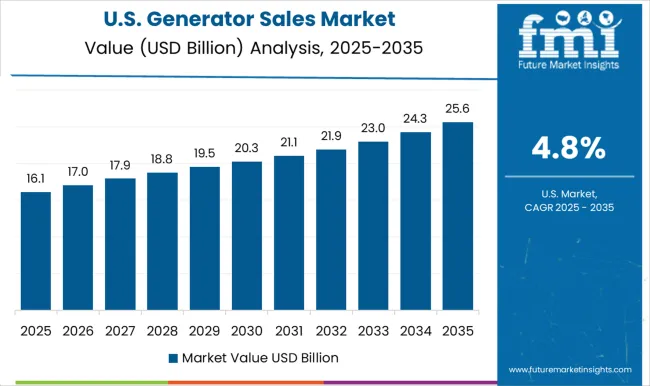
[303 Pages Report] The global generator sales market size was valued at US$ 21.6 Bn in 2022 and is projected to reach US$ 28.6 Bn by 2027, exhibiting a CAGR of 5.8% in the forecast period (2022-2032).
“Growing need for IT facilities and data centers, as well as increasing urbanization in emerging nations, are expected to boost the worldwide general sales market's growth.”
The increased demand for a reliable power source is likely to encourage the sales of generators in a variety of fields. Industrial processes are slowed by power interruptions and voltage dips.
Report Attribute |
Details |
Estimated Base Year Value (2022) |
US$ 21.6 Bn |
Anticipated Forecast Value (2027) |
US$ 28.6 Bn |
Projected Growth Rate (2022-2032) |
5.8% CAGR |
Let us know your requirement to get
100% FREE customization
What are the COVID-19 Implications on the Generator Sales Market?
During the COVID-19 pandemic, unexpected industrial shutdowns hindered the deployment of generators for end-user industries. The global impact of the new coronavirus epidemic has been considerable.
The number of instances impacted has been steadily increasing, prompting several countries to implement a variety of counter-measures, including national lockdowns and social isolation.
As a result, the worldwide pandemic has had a significant impact on the generator sales market as a result of the suspension of industrial activities.
Growing apprehensions regarding investing in new projects, restrictions on cross-border commerce, a lack of essential capital, preventative government actions lowering the workforce, and a slew of other obstacles have all hampered the generator sales market growth.
What are the Key Contributors to the Generator Sales Market?
Rapid industrialization and rising construction expenditure are expected to boost the market growth. Growing investments in constructing new sophisticated industrial sector establishments and upgrading existing ones are likely to propel the generator sales market forward.
Additionally, the demand for generator sales is boosted by rising national building investment in energy-efficient infrastructure. For example, the United States Census Bureau stated in August 2020 that investment in public buildings in the United States was USD 353.3 billion in June 2020, up from USD 332.8 billion in 2019.
This is projected to boost the power equipment sales. Exploration and production of oil and gas are increasing, which will help the economy grow. Power consumption is steadily increasing in both developed and emerging countries.
What are the Factors Limiting the Growth of the Generator Sales Market?
Clean energy adoption is increasing, which might stifle market growth. Clean energy deployment objectives set by a number of regional governments and organizations to reduce greenhouse gas emissions might hinder the market growth.
Different countries are required to follow strict regulations in order to incorporate low-carbon generation technology and reduce their carbon footprint. This might limit the potential for generator installation throughout the world.
Furthermore, increasing expenditures to modernize grid infrastructure and enhance transmission and distribution (T&D) lines may cause certain product acceptance issues.
What are the Key Trends in Generator Sales Market?
The rapid advancement of the industry has increased electricity consumption.
Generators have become an essential component of industrial and household equipment due to uninterrupted power demand and peak and continuous power requirements.
The growing costs of constructing modern structures in developing nations are projected to encourage the expansion of this construction industry.
The constant demand for various minerals and metals to construct goods for various sectors is predicted to drive up demand in the mining industry.
The telecom industry is expected to benefit from the expanding reach of telecommunication line-needing more telecom stations. The requirement for continuous power supply, which is necessary for the effective operation of heavy machinery and equipment, is favoring the manufacturing segment's expansion.
Comparative View of Adjacent Generator Sales Market
Generator Sales Market:
Attributes |
Generator Sales Market |
CAGR (2022 - 2032) |
5.8% |
Market Value (2027) |
US$ 28.6 Bn |
Growth Factor |
Rapid industrialization and rising construction expenditure are expected to boost market growth. Growing investments in constructing new sophisticated industrial sector establishments, as well as upgrading existing ones, are likely to propel the generator sales market forward. |
Opportunity |
To overcome diesel engine emission restrictions and high running expenses, some generator manufacturers are embracing bi-fuel technology. As a result, traditional diesel generator sets are being phased out in favor of bi-fuel generators. |
Key Trends |
The telecom industry is expected to benefit from the expanding reach of telecommunication line-needing more telecom stations. The requirement for continuous power supply, which is necessary for the effective operation of heavy machinery and equipment, is favoring the manufacturing segment's expansion. |
Generator Sets Market:
Attributes |
Generator Sets Market |
CAGR (2022 - 2032) |
7.5% |
Market Value (2027) |
US$ 64.03 Bn |
Growth Factor |
The market's potential will be shaped by the growing importance of a reliable emergency power supply, as well as the rising vulnerability of grid infrastructure to external harm. The growing reliance on electronics and electrical equipment to support day-to-day operations among a diverse range of end users will hasten product deployment. |
Opportunity |
The corporate environment will be positively impacted by rising demand from data centers as a result of increased data usage as a result of the work-from-home regime in numerous sectors. |
Key Trends |
Increased applicability in the mining, oil and gas, communications, and construction industries would have a beneficial impact on market trends. The ongoing industrial revolution has resulted in a significant increase in the need for reliable power to enable the smooth operation of numerous sectors. |
Diesel Generator Market:
Attributes |
Diesel Generator Market |
CAGR (2022 - 2032) |
8% |
Market Value (2027) |
US$ 30 Bn |
Growth Factor |
Growing demand for generators to prevent power outages and disruption of normal business activity has stemmed from the increased use of electronically operated equipment. |
Opportunity |
Increased technological improvements in diesel generators, as well as increased demand for energy from various end-use sectors, are expected to present attractive growth possibilities for the market's leading players in the coming years. |
Key Trends |
The industrial sector, which includes mining, manufacturing, agriculture, and construction, consumes the most energy of any end-user sector. As a result, the demand for diesel generators is predicted to rise as the requirement for continuous and consistent power supply from these industries grows, particularly from healthcare facilities, pharmaceutical businesses, and industrial facilities. |
Find your sweet spots for generating winning opportunities in this market.
Talk to AnalystWhat is the Segmentation Outlook for Industrial Safety Footwear Market?
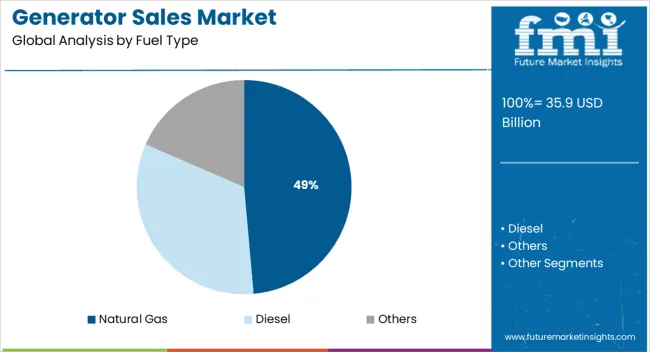
The industry is fragmented into gas, diesel, and other fuel types based on fuel type.
Due to its dependable operations, considerably high efficiency, reduced maintenance costs, high load operations, and other reasons, the diesel segment is expected to account for the largest generator sales market share globally.
The rise of gas-based generating units is expected to be aided by fewer emissions of hazardous gases such as nitrogen and sulfur and more cost-effective operations.
Gensets that run on fuel oil, gasoline, wood gas, and biofuel are included in the others category.
Their poor efficiency has hampered their expansion, but rising consumer awareness of environmental issues is expected to drive demand in the forecast term.
By Application Analysis
The market is divided into three categories based on application: peak load, continuous load, and standby. The Continuous Load Segment demand will be fueled by increased use in heavy-duty applications.
The demand for robust backup power units to withstand abrupt blackouts or power shortages is fueling the standby segment's growth.
Owing to the expanding establishment of high-power applications in remote locations without grid access, the continuous category is expected to have a large generator sales market share in the worldwide market.
By End User
The market is categorized based on end-user: industrial, commercial, and residential.
The industrial sector accounted for the biggest proportion of the market.
The expansion in the number of industries and the increased usage of generators in industrial applications can be attributed to the causes.
In addition, favorable government policies supporting the development of energy infrastructure have aided businesses in increasing the rate of generator adoption.
By Power Rating
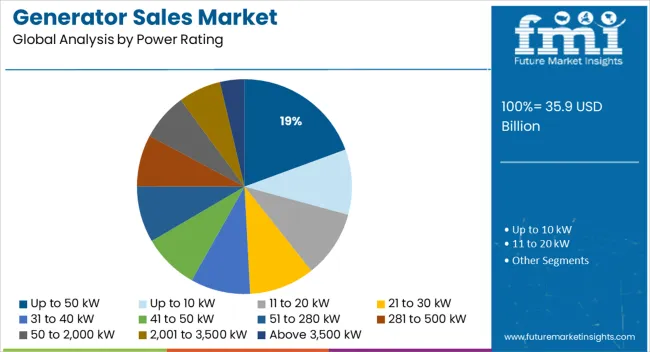
The market is divided into four categories: below Up To 50 KW, Up To 10 KW, 11–20 KW, 21–30 KW, 31–40 KW, 41–50 KW, 51–280 KW, 281–500 KW, 501–2,000 KW, 2,001–3,500 KW, above 3,500 KW, based on power rating.
The section illustrates how the different power ratings of the generator have the biggest share and the highest CAGR growth, which is also based on the generator's use, estimated lifespan, and the working load to be managed.
What is the Regional Analysis of Generator Sales Market?
North America, Asia Pacific, Latin America, Europe, the Middle East and Africa (MEA) are the five primary regions that have been studied.
Owing to numerous economies in the transition phase, Asia Pacific is expected to hold the largest worldwide generator sales market share in terms of revenue in 2020.
Rapid infrastructural development, urbanization, and industry in South Korea, China, and India are likely to propel regional development.
North America is expected to have strong growth from 2021 to 2028, owing to increased private and public expenditures in vertical industry development in the United States and Canada.
Furthermore, the existence of key market players is likely to drive the regional industry, as will tighten legislation to enhance building energy security.

An unified Market Research Subscription Platform, built for today’s disparate research needs.
What is the Competitive Landscape of Generator Sales Market?
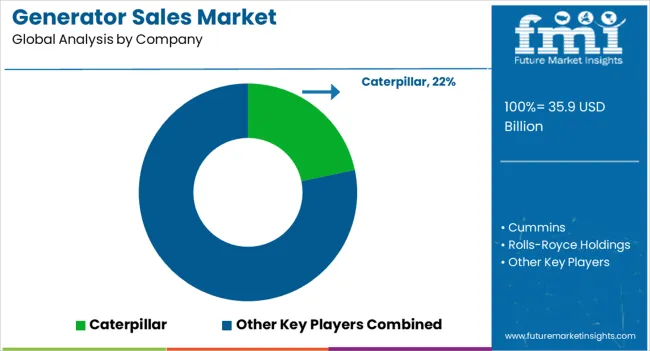
The major key players in generator sales market are Rolls-Royce (U.K.), Caterpillar Inc. (U.S.), Atlas Copco (Sweden), MAN Energy Solutions (Germany), Zwart Techniek (Netherlands), Cummins Inc. (U.S.), Wacker Neuson (Germany), Himoinsa (Spain) and Kohler-SIDMO (France).
Rolls-Royce is strengthening its partnerships with other companies in order to deliver high-power products. At the global and regional levels, various product manufacturers have been seen supplying devices with varying power ratings.
Several small and major players with well-established manufacturing lines have entered this market to meet the needs of various end-user industries.
In addition, firms are increasingly concentrating on combining with other significant players in order to improve their position and define the competitive environment.
Recent Developments
- Cummins India Ltd. introduced the QSK60 G23: 2500-2750 kVA Diesel Generator in August 2021. (DG). The diesel generator set, which is an integrated power solution, was introduced in India to fulfill the growing power needs of industrial segments such as data centers and large-scale infrastructure projects such as railroads, airports, and other commercial venues.
- Toho Gas and MHIET accomplished Successful Test Operation of City Gas and Hydrogen Mixed-fuel Combustion in a Commercial Gas Engine for a Cogeneration System in August 2021.
- Rolls-Royce and its distribution partner Knopf & Wallisch (K&W) delivered three mtu customized and containerized combined cooling, heat, and power plant (CCHP) trigeneration units to ClusterPower, a Romanian cloud service provider, in January 2022.
- Caterpillar Inc. declared in August 2020 that their natural gas-fueled generator set, rated at 500 kW for 60 Hz markets, has received Stationary Emergency Certification from the United States Environmental Protection Agency (EPA). Caterpillar Inc. designs and produces a variety of generators and engines, including diesel and gas generators.
Key Market Segments
By Fuel Type:
- Natural Gas
- Diesel
- Others
By Application:
- Prime & Continuous
- Standby
- Peak Shaving
By Power Rating:
- Up To 50 KW
- Up To 10 KW
- 11–20 KW
- 21–30 KW
- 31–40 KW
- 41–50 KW
- 51–280 KW
- 281–500 KW
- 501–2,000 KW
- 2,001–3,500 KW
- Above 3,500 KW
By End User:
- Industrial
- Utilities/Power Generation
- Oil & Gas
- Chemicals & Petrochemicals
- Manufacturing
- Marine
- Commercial
- Mining & Metals
- Construction
- Residential
- Marine
- Healthcare
- IT & Telecom
- Data Centers
- Others
By Sales Channel:
- Direct
- Indirect
By Design:
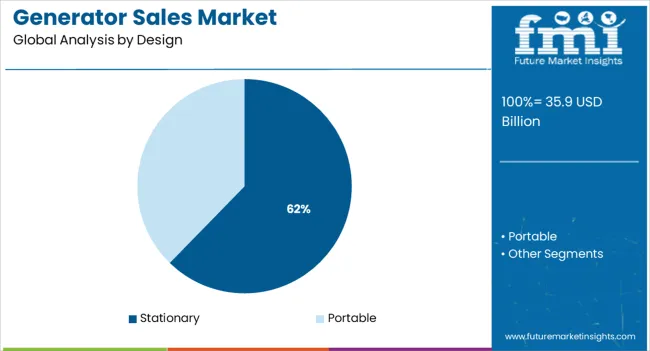
- Stationary
- Portable
By Region:
- North America
- U.S.
- Canada
- Latin America
- Brazil
- Mexico
- Europe
- Germany
- France
- U.K.
- Italy
- Benelux
- Russia
- Asia Pacific
- China
- Japan
- South Korea
- The Middle East & Africa
- GCG Countries
- South Africa
- Turkey
Frequently Asked Questions
The generator sales market is expected to rise at a steady CAGR of 5.8% during the projected period.
The global generator sales market was valued at US$ 21.6 Bn in 2022.
Rapid industrialization and rising construction expenditure are expected to boost market growth. Growing investments in constructing new sophisticated industrial sector establishments, as well as upgrading existing ones, are likely to propel the generator sales market forward.
North America is currently leading the generator sales market.
The generator sales market is expected to grow nearly US$ 28.6 Bn by 2027.
1. Executive Summary
1.1. Global Market Outlook
1.2. Summary of Statistics
1.3. Key Market Characteristics & Attributes
1.4. Fact.MR Analysis and Recommendations
2. Market Overview
2.1. Market Coverage / Taxonomy
2.2. Market Definition / Scope / Limitations
3. Market Risks and Trends Assessment
3.1. Risk Assessment
3.1.1. COVID-19 Crisis and Impact on Generator Sales Demand
3.1.2. COVID-19 Impact Benchmark with Previous Crisis
3.1.3. Impact on Market Value (US$ Mn)
3.1.4. Assessment by Key Countries
3.1.5. Assessment by Key Market Segments
3.1.6. Action Points and Recommendation for Suppliers
3.2. Key Trends Impacting the Market
3.3. Componentulation and Product Development Trends
4. Market Background
4.1. Generator Sales Market By Country, US$ Mn
4.2. Generator Sales Market Opportunity Assessment (US$ Mn)
4.2.1. Total Available Market
4.2.2. Serviceable Addressable Market
4.2.3. Serviceable Obtainable Market
4.3. Market Scenario Forecast
4.3.1. Demand in optimistic Scenario
4.3.2. Demand in Likely Scenario
4.3.3. Demand in Conservative Scenario
4.4. Investment Feasibility Analysis
4.4.1. Investment in Established Markets
4.4.1.1. In Short Term
4.4.1.2. In Long Term
4.4.2. Investment in Emerging Markets
4.4.2.1. In Short Term
4.4.2.2. In Long Term
4.5. Forecast Factors - Relevance & Impact
4.5.1. Top Companies Historical Growth
4.5.2. Global Generator Sales Market Growth
4.5.3. Generator Sales Adoption Rate, by Country
4.6. Market Dynamics
4.6.1. Market Driving Factors and Impact Assessment
4.6.2. Prominent Market Challenges and Impact Assessment
4.6.3. Generator Sales Market Opportunities
4.6.4. Prominent Trends in the Global Market & Their Impact Assessment
5. Key Success Factors
5.1. Manufacturers’ Focus on Low Penetration High Growth Markets
5.2. Banking on with Segments High Incremental Opportunity
5.3. Peer Benchmarking
6. Global Generator Sales Market Demand Analysis 2015-2021 and Forecast, 2022-2032
6.1. Historical Market Analysis, 2015-2021
6.2. Current and Future Market Projections, 2022-2032
6.3. Y-o-Y Growth Trend Analysis
7. Global Generator Sales Market Value Analysis 2015-2021 and Forecast, 2022-2032
7.1. Historical Market Value (US$ Mn) Analysis, 2015-2021
7.2. Current and Future Market Value (US$ Mn) Projections, 2022-2032
7.2.1. Y-o-Y Growth Trend Analysis
7.2.2. Absolute $ Opportunity Analysis
8. Global Generator Sales Market Analysis 2015-2021 and Forecast 2022-2032, By Fuel Type
8.1. Introduction / Key Findings
8.2. Historical Market Value (US$ Mn) and Analysis By Fuel Type, 2015-2021
8.3. Current and Future Market Value (US$ Mn) and Analysis and Forecast By Fuel Type, 2022-2032
8.3.1. Diesel
8.3.2. Gas
8.3.3. Others (LPG, biofuel, coal gas, producer gas, gasoline, and propane gas)
8.4. Market Attractiveness Analysis By Fuel Type
9. Global Generator Sales Market Analysis 2015-2021 and Forecast 2022-2032, By End User
9.1. Introduction / Key Findings
9.2. Historical Market Value (US$ Mn) and Analysis By End User, 2015-2021
9.3. Current and Future Market Value (US$ Mn) and Analysis and Forecast By End User, 2022-2032
9.3.1. Industrial
9.3.1.1. Utilities/Power Generation
9.3.1.2. Oil & Gas
9.3.1.3. Chemicals & Petrochemicals
9.3.1.4. Mining & Metals
9.3.1.5. Manufacturing
9.3.1.6. Marine
9.3.1.7. Construction
9.3.1.8. Others (Agriculture, Transportation, and Aerospace & Defense)
9.3.2. Commercial
9.3.2.1. IT & Telecom
9.3.2.2. Healthcare
9.3.2.3. Data Centers
9.3.2.4. Others (Hotels, Shopping Complexes, Malls, and Public Infrastructure)
9.3.3. Residential
9.4. Market Attractiveness Analysis By End User
10. Global Generator Sales Market Analysis 2015-2021 and Forecast 2022-2032, By Power Rating
10.1. Introduction / Key Findings
10.2. Historical Market Value (US$ Mn) and Analysis By Power Rating , 2015-2021
10.3. Current and Future Market Value (US$ Mn) and Analysis and Forecast By Power Rating , 2022-2032
10.3.1. Up To 50 KW
10.3.1.1. Up To 10 KW
10.3.1.2. 11–20 KW
10.3.1.3. 21–30 KW
10.3.1.4. 31–40 KW
10.3.1.5. 41–50 KW
10.3.2. 51–280 KW
10.3.3. 281–500 KW
10.3.4. 501–2,000 KW
10.3.5. 2,001–3,500 KW
10.3.6. Above 3,500 KW
10.4. Market Attractiveness Analysis By Power Rating
11. Global Generator Sales Market Analysis 2015-2021 and Forecast 2022-2032, By Sales Channel
11.1. Introduction / Key Findings
11.2. Historical Market Value (US$ Mn) and Analysis By Sales Channel , 2015-2021
11.3. Current and Future Market Value (US$ Mn) and Analysis and Forecast By Sales Channel , 2022-2032
11.3.1. Direct
11.3.2. Indirect
11.4. Market Attractiveness Analysis By Sales Channel
12. Global Generator Sales Market Analysis 2015-2021 and Forecast 2022-2032, By Application
12.1. Introduction / Key Findings
12.2. Historical Market Value (US$ Mn) and Analysis By Application, 2015-2021
12.3. Current and Future Market Value (US$ Mn) and Analysis and Forecast By Application, 2022-2032
12.3.1. Standby
12.3.2. Prime & Continuous
12.3.3. Peak Shaving
12.4. Market Attractiveness Analysis By Application
13. Global Generator Sales Market Analysis 2015-2021 and Forecast 2022-2032, By Design
13.1. Introduction
13.2. Historical Market Value (US$ Mn) and Analysis By Region, 2015-2021
13.3. Current Market Size (US$ Mn) & Analysis and Forecast By Region, 2022-2032
13.3.1. Stationary
13.3.2. Portable
13.4. Market Attractiveness Analysis By Design
14. Global Generator Sales Market Analysis 2015-2021 and Forecast 2022-2032, By Region
14.1. Introduction
14.2. Historical Market Value (US$ Mn) and Analysis By Region, 2015-2021
14.3. Current Market Size (US$ Mn) & Analysis and Forecast By Region, 2022-2032
14.3.1. North America
14.3.2. Latin America
14.3.3. Europe
14.3.4. Asia Pacific
14.3.5. Middle East and Africa (MEA)
14.4. Market Attractiveness Analysis By Region
15. North America Generator Sales Market Analysis 2015-2021 and Forecast 2022-2032
15.1. Introduction
15.2. Pricing Analysis
15.3. Historical Market Value (US$ Mn) and Trend Analysis By Market Taxonomy, 2015-2021
15.4. Market Value (US$ Mn) & Forecast By Market Taxonomy, 2022-2032
15.4.1. By Country
15.4.1.1. U.S.
15.4.1.2. Canada
15.4.2. By Power Rating
15.4.3. By Fuel Type
15.4.4. By End User
15.4.5. By Sales Channel
15.4.6. By Application
15.4.7. By Design
15.5. Market Attractiveness Analysis
15.5.1. By Country
15.5.2. By Power Rating
15.5.3. By Fuel Type
15.5.4. By End User
15.5.5. By Sales Channel
15.5.6. By Application
15.5.7. By Design
16. Latin America Generator Sales Market Analysis 2015-2021 and Forecast 2022-2032
16.1. Introduction
16.2. Pricing Analysis
16.3. Historical Market Value (US$ Mn) and Trend Analysis By Market Taxonomy, 2015-2021
16.4. Market Value (US$ Mn) & Forecast By Market Taxonomy, 2022-2032
16.4.1. By Country
16.4.1.1. Brazil
16.4.1.2. Mexico
16.4.1.3. Rest of Latin America
16.4.2. By Power Rating
16.4.3. By Fuel Type
16.4.4. By End User
16.4.5. By Sales Channel
16.4.6. By Application
16.4.7. By Design
16.5. Market Attractiveness Analysis
16.5.1. By Country
16.5.2. By Power Rating
16.5.3. By Fuel Type
16.5.4. By End User
16.5.5. By Sales Channel
16.5.6. By Application
16.5.7. By Design
17. Europe Generator Sales Market Analysis 2015-2021 and Forecast 2022-2032
17.1. Introduction
17.2. Pricing Analysis
17.3. Historical Market Value (US$ Mn) and Trend Analysis By Market Taxonomy, 2015-2021
17.4. Market Value (US$ Mn) & Forecast By Market Taxonomy, 2022-2032
17.4.1. By Country
17.4.1.1. Germany
17.4.1.2. France
17.4.1.3. U.K.
17.4.1.4. Italy
17.4.1.5. Benelux
17.4.1.6. Russia
17.4.1.7. Rest of Europe
17.4.2. By Power Rating
17.4.3. By Fuel Type
17.4.4. By End User
17.4.5. By Sales Channel
17.4.6. By Application
17.4.7. By Design
17.5. Market Attractiveness Analysis
17.5.1. By Country
17.5.2. By Power Rating
17.5.3. By Fuel Type
17.5.4. By End User
17.5.5. By Sales Channel
17.5.6. By Application
17.5.7. By Design
18. Asia Pacific Generator Sales Market Analysis 2015-2021 and Forecast 2022-2032
18.1. Introduction
18.2. Pricing Analysis
18.3. Historical Market Value (US$ Mn) and Trend Analysis By Market Taxonomy, 2015-2021
18.4. Market Value (US$ Mn) & Forecast By Market Taxonomy, 2022-2032
18.4.1. By Country
18.4.1.1. China
18.4.1.2. Japan
18.4.1.3. South Korea
18.4.1.4. Rest of Asia Pacific
18.4.2. By Power Rating
18.4.3. By Fuel Type
18.4.4. By End User
18.4.5. By Sales Channel
18.4.6. By Application
18.4.7. By Design
18.5. Market Attractiveness Analysis
18.5.1. By Country
18.5.2. By Power Rating
18.5.3. By Fuel Type
18.5.4. By End User
18.5.5. By Sales Channel
18.5.6. By Application
18.5.7. By Design
19. Middle East and Africa Generator Sales Market Analysis 2015-2021 and Forecast 2022-2032
19.1. Introduction
19.2. Pricing Analysis
19.3. Historical Market Value (US$ Mn) and Trend Analysis By Market Taxonomy, 2015-2021
19.4. Market Value (US$ Mn) & Forecast By Market Taxonomy, 2022-2032
19.4.1. By Country
19.4.1.1. GCC Countries
19.4.1.2. South Africa
19.4.1.3. Turkey
19.4.1.4. Rest of Middle East and Africa
19.4.2. By Power Rating
19.4.3. By Fuel Type
19.4.4. By End User
19.4.5. By Sales Channel
19.4.6. By Application
19.4.7. By Design
19.5. Market Attractiveness Analysis
19.5.1. By Country
19.5.2. By Power Rating
19.5.3. By Fuel Type
19.5.4. By End User
19.5.5. By Sales Channel
19.5.6. By Application
19.5.7. By Design
20. Key Countries Generator Sales Market Analysis 2015-2021 and Forecast 2022-2032
20.1. Introduction
20.1.1. Market Value Proportion Analysis, By Key Countries
20.1.2. Global Vs. Country Growth Comparison
20.2. US Generator Sales Market Analysis
20.2.1. Value Proportion Analysis by Market Taxonomy
20.2.2. Value & Analysis and Forecast by Market Taxonomy, 2015-2032
20.2.2.1. By Power Rating
20.2.2.2. By Fuel Type
20.2.2.3. By End User
20.2.2.4. By Sales Channel
20.2.2.5. By Application
20.2.2.6. By Design
20.3. Canada Generator Sales Market Analysis
20.3.1. Value Proportion Analysis by Market Taxonomy
20.3.2. Value & Analysis and Forecast by Market Taxonomy, 2015-2032
20.3.2.1. By Power Rating
20.3.2.2. By Fuel Type
20.3.2.3. By End User
20.3.2.4. By Sales Channel
20.3.2.5. By Application
20.3.2.6. By Design
20.4. Mexico Generator Sales Market Analysis
20.4.1. Value Proportion Analysis by Market Taxonomy
20.4.2. Value & Analysis and Forecast by Market Taxonomy, 2015-2032
20.4.2.1. By Power Rating
20.4.2.2. By Fuel Type
20.4.2.3. By End User
20.4.2.4. By Sales Channel
20.4.2.5. By Application
20.4.2.6. By Design
20.5. Brazil Generator Sales Market Analysis
20.5.1. Value Proportion Analysis by Market Taxonomy
20.5.2. Value & Analysis and Forecast by Market Taxonomy, 2015-2032
20.5.2.1. By Power Rating
20.5.2.2. By Fuel Type
20.5.2.3. By End User
20.5.2.4. By Sales Channel
20.5.2.5. By Application
20.5.2.6. By Design
20.6. Germany Generator Sales Market Analysis
20.6.1. Value Proportion Analysis by Market Taxonomy
20.6.2. Value & Analysis and Forecast by Market Taxonomy, 2015-2032
20.6.2.1. By Power Rating
20.6.2.2. By Fuel Type
20.6.2.3. By End User
20.6.2.4. By Sales Channel
20.6.2.5. By Application
20.6.2.6. By Design
20.7. France Generator Sales Market Analysis
20.7.1. Value Proportion Analysis by Market Taxonomy
20.7.2. Value & Analysis and Forecast by Market Taxonomy, 2015-2032
20.7.2.1. By Power Rating
20.7.2.2. By Fuel Type
20.7.2.3. By End User
20.7.2.4. By Sales Channel
20.7.2.5. By Application
20.7.2.6. By Design
20.8. Italy Generator Sales Market Analysis
20.8.1. Value Proportion Analysis by Market Taxonomy
20.8.2. Value & Analysis and Forecast by Market Taxonomy, 2015-2032
20.8.2.1. By Power Rating
20.8.2.2. By Fuel Type
20.8.2.3. By End User
20.8.2.4. By Sales Channel
20.8.2.5. By Application
20.8.2.6. By Design
20.9. Russia Generator Sales Market Analysis
20.9.1. Value Proportion Analysis by Market Taxonomy
20.9.2. Value & Analysis and Forecast by Market Taxonomy, 2015-2032
20.9.2.1. By Power Rating
20.9.2.2. By Fuel Type
20.9.2.3. By End User
20.9.2.4. By Sales Channel
20.9.2.5. By Application
20.9.2.6. By Design
20.10. UK Generator Sales Market Analysis
20.10.1. Value Proportion Analysis by Market Taxonomy
20.10.2. Value & Analysis and Forecast by Market Taxonomy, 2015-2032
20.10.2.1. By Power Rating
20.10.2.2. By Fuel Type
20.10.2.3. By End User
20.10.2.4. By Sales Channel
20.10.2.5. By Application
20.10.2.6. By Design
20.11. Benelux Generator Sales Market Analysis
20.11.1. Value Proportion Analysis by Market Taxonomy
20.11.2. Value & Analysis and Forecast by Market Taxonomy, 2015-2032
20.11.2.1. By Power Rating
20.11.2.2. By Fuel Type
20.11.2.3. By End User
20.11.2.4. By Sales Channel
20.11.2.5. By Application
20.11.2.6. By Design
20.12. China Generator Sales Market Analysis
20.12.1. Value Proportion Analysis by Market Taxonomy
20.12.2. Value & Analysis and Forecast by Market Taxonomy, 2015-2032
20.12.2.1. By Power Rating
20.12.2.2. By Fuel Type
20.12.2.3. By End User
20.12.2.4. By Sales Channel
20.12.2.5. By Application
20.12.2.6. By Design
20.13. Japan Generator Sales Market Analysis
20.13.1. Value Proportion Analysis by Market Taxonomy
20.13.2. Value & Analysis and Forecast by Market Taxonomy, 2015-2032
20.13.2.1. By Power Rating
20.13.2.2. By Fuel Type
20.13.2.3. By End User
20.13.2.4. By Sales Channel
20.13.2.5. By Application
20.13.2.6. By Design
20.14. South Korea Generator Sales Market Analysis
20.14.1. Value Proportion Analysis by Market Taxonomy
20.14.2. Value & Analysis and Forecast by Market Taxonomy, 2015-2032
20.14.2.1. By Power Rating
20.14.2.2. By Fuel Type
20.14.2.3. By End User
20.14.2.4. By Sales Channel
20.14.2.5. By Application
20.14.2.6. By Design
20.15. GCC Countries Generator Sales Market Analysis
20.15.1. Value Proportion Analysis by Market Taxonomy
20.15.2. Value & Analysis and Forecast by Market Taxonomy, 2015-2032
20.15.2.1. By Power Rating
20.15.2.2. By Fuel Type
20.15.2.3. By End User
20.15.2.4. By Sales Channel
20.15.2.5. By Application
20.15.2.6. By Design
20.16. South Africa Generator Sales Market Analysis
20.16.1. Value Proportion Analysis by Market Taxonomy
20.16.2. Value & Analysis and Forecast by Market Taxonomy, 2015-2032
20.16.2.1. By Power Rating
20.16.2.2. By Fuel Type
20.16.2.3. By End User
20.16.2.4. By Sales Channel
20.16.2.5. By Application
20.16.2.6. By Design
20.17. Turkey Generator Sales Market Analysis
20.17.1. Value Proportion Analysis by Market Taxonomy
20.17.2. Value & Analysis and Forecast by Market Taxonomy, 2015-2032
20.17.2.1. By Power Rating
20.17.2.2. By Fuel Type
20.17.2.3. By End User
20.17.2.4. By Sales Channel
20.17.2.5. By Application
20.17.2.6. By Design
20.17.3. Competition Landscape and Player Concentration in the Country
21. Market Structure Analysis
21.1. Market Analysis by Tier of Companies
21.2. Market Concentration
21.3. Market Share Analysis of Top Players
21.4. Market Presence Analysis
21.4.1. By Regional footprint of Players
21.4.2. Product footprint by Players
22. Competition Analysis
22.1. Competition Dashboard
22.2. Competition Benchmarking
22.3. Competition Deep Dive
22.3.1. Caterpillar
22.3.1.1. Overview
22.3.1.2. Product Portfolio
22.3.1.3. Sales Footprint
22.3.1.4. Strategy Overview
22.3.2. Cummins
22.3.2.1. Overview
22.3.2.2. Product Portfolio
22.3.2.3. Sales Footprint
22.3.2.4. Strategy Overview
22.3.3. Rolls-Royce Holdings
22.3.3.1. Overview
22.3.3.2. Product Portfolio
22.3.3.3. Sales Footprint
22.3.3.4. Strategy Overview
22.3.4. Weichai Group
22.3.4.1. Overview
22.3.4.2. Product Portfolio
22.3.4.3. Sales Footprint
22.3.4.4. Strategy Overview
22.3.5. Kohler Co
22.3.5.1. Overview
22.3.5.2. Product Portfolio
22.3.5.3. Sales Footprint
22.3.5.4. Strategy Overview
22.3.6. Atlas Copco
22.3.6.1. Overview
22.3.6.2. Product Portfolio
22.3.6.3. Sales Footprint
22.3.6.4. Strategy Overview
22.3.7. Denyo
22.3.7.1. Overview
22.3.7.2. Product Portfolio
22.3.7.3. Sales Footprint
22.3.7.4. Strategy Overview
22.3.8. Wacker Neuson
22.3.8.1. Overview
22.3.8.2. Product Portfolio
22.3.8.3. Sales Footprint
22.3.8.4. Strategy Overview
22.3.9. Generac
22.3.9.1. Overview
22.3.9.2. Product Portfolio
22.3.9.3. Sales Footprint
22.3.9.4. Strategy Overview
22.3.10. Doosan
22.3.10.1. Overview
22.3.10.2. Product Portfolio
22.3.10.3. Sales Footprint
22.3.10.4. Strategy Overview
22.3.11. Greaves Cotton Limited
22.3.11.1. Overview
22.3.11.2. Product Portfolio
22.3.11.3. Sales Footprint
22.3.11.4. Strategy Overview
22.3.12. Kirloskar Oil Engines Ltd
22.3.12.1. Overview
22.3.12.2. Product Portfolio
22.3.12.3. Sales Footprint
22.3.12.4. Strategy Overview
22.3.13. Siemens
22.3.13.1. Overview
22.3.13.2. Product Portfolio
22.3.13.3. Sales Footprint
22.3.13.4. Strategy Overview
23. Assumptions and Acronyms Used
24. Research Methodology
Let us know your requirement to get
100% FREE customization
Table 1: Global Generator Sales Market Value (US$ Mn),By Design , 2015 – 2021
Table 2: Global Generator Sales Market Value (US$ Mn),By Design , 2022 – 2032
Table 3: Global Generator Sales Market Value (US$ Mn), By Fuel Type , 2015 – 2021
Table 4: Global Generator Sales Market Value (US$ Mn), By Fuel Type , 2022 – 2032
Table 5: Global Generator Sales Market Value (US$ Mn), By Power Rating , 2015 – 2021
Table 6: Global Generator Sales Market Value (US$ Mn), By Power Rating , 2022 – 2032
Table 7: Global Generator Sales Market Value (US$ Mn), By End User , 2015 – 2021
Table 8: Global Generator Sales Market Value (US$ Mn), By End User , 2022 – 2032
Table 9: Global Generator Sales Market Value (US$ Mn), By Sales Channel , 2015 – 2021
Table 10: Global Generator Sales Market Value (US$ Mn), By Sales Channel , 2022 – 2032
Table 11: Global Generator Sales Market Value (US$ Mn), By Application, 2015 – 2021
Table 12: Global Generator Sales Market Value (US$ Mn), By Application, 2022 – 2032
Table 13: Global Generator Sales Market, By Region, 2015 – 2021
Table 14: Global Generator Sales Market, By Region, 2022 – 2032
Table 15: North America Generator Sales Market Value (US$ Mn),By Design , 2015 – 2021
Table 16: North America Generator Sales Market Value (US$ Mn),By Design , 2022 – 2032
Table 17: North America Generator Sales Market Value (US$ Mn), By Fuel Type , 2015 – 2021
Table 18: North America Generator Sales Market Value (US$ Mn), By Fuel Type , 2022 – 2032
Table 19: North America Generator Sales Market Value (US$ Mn), By Power Rating , 2015 – 2021
Table 20: North America Generator Sales Market Value (US$ Mn), By Power Rating , 2022 – 2032
Table 21: North America Generator Sales Market Value (US$ Mn), By End User , 2015 – 2021
Table 22: North America Generator Sales Market Value (US$ Mn), By End User , 2022 – 2032
Table 23: North America Generator Sales Market Value (US$ Mn), By Sales Channel , 2015 – 2021
Table 24: North America Generator Sales Market Value (US$ Mn), By Sales Channel , 2022 – 2032
Table 25: North America Generator Sales Market Value (US$ Mn), By Application, 2015 – 2021
Table 26: North America Generator Sales Market Value (US$ Mn), By Application, 2022 – 2032
Table 27: North America Generator Sales Market, By Country, 2015 – 2021
Table 28: North America Generator Sales Market, By Country, 2022 – 2032
Table 29: Latin America Generator Sales Market Value (US$ Mn),By Design , 2015 – 2021
Table 30: Latin America Generator Sales Market Value (US$ Mn),By Design , 2022 – 2032
Table 31: Latin America Generator Sales Market Value (US$ Mn), By Fuel Type , 2015 – 2021
Table 32: Latin America Generator Sales Market Value (US$ Mn), By Fuel Type , 2022 – 2032
Table 33: Latin America Generator Sales Market Value (US$ Mn), By Power Rating , 2015 – 2021
Table 34: Latin America Generator Sales Market Value (US$ Mn), By Power Rating , 2022 – 2032
Table 35: Latin America Generator Sales Market Value (US$ Mn), By End User , 2015 – 2021
Table 36: Latin America Generator Sales Market Value (US$ Mn), By End User , 2022 – 2032
Table 37: Latin America Generator Sales Market Value (US$ Mn), By Sales Channel , 2015 – 2021
Table 38: Latin America Generator Sales Market Value (US$ Mn), By Sales Channel , 2022 – 2032
Table 39: Latin America Generator Sales Market Value (US$ Mn), By Application, 2015 – 2021
Table 40: Latin America Generator Sales Market Value (US$ Mn), By Application, 2022 – 2032
Table 41: Latin America Generator Sales Market, By Country, 2015 – 2021
Table 42: Latin America Generator Sales Market, By Country, 2022 – 2032
Table 43: Europe Generator Sales Market Value (US$ Mn),By Design , 2015 – 2021
Table 44: Europe Generator Sales Market Value (US$ Mn),By Design , 2022 – 2032
Table 45: Europe Generator Sales Market Value (US$ Mn), By Fuel Type , 2015 – 2021
Table 46: Europe Generator Sales Market Value (US$ Mn), By Fuel Type , 2022 – 2032
Table 47: Europe Generator Sales Market Value (US$ Mn), By Power Rating , 2015 – 2021
Table 48: Europe Generator Sales Market Value (US$ Mn), By Power Rating , 2022 – 2032
Table 49: Europe Generator Sales Market Value (US$ Mn), By End User , 2015 – 2021
Table 50: Europe Generator Sales Market Value (US$ Mn), By End User , 2022 – 2032
Table 51: Europe Generator Sales Market Value (US$ Mn), By Sales Channel , 2015 – 2021
Table 52: Europe Generator Sales Market Value (US$ Mn), By Sales Channel , 2022 – 2032
Table 53: Europe Generator Sales Market Value (US$ Mn), By Application, 2015 – 2021
Table 54: Europe Generator Sales Market Value (US$ Mn), By Application, 2022 – 2032
Table 55: Europe Generator Sales Market, By Country, 2015 – 2021
Table 56: Europe Generator Sales Market, By Country, 2022 – 2032
Table 57: Asia Pacific Generator Sales Market Value (US$ Mn),By Design , 2015 – 2021
Table 58: Asia Pacific Generator Sales Market Value (US$ Mn),By Design , 2022 – 2032
Table 59: Asia Pacific Generator Sales Market Value (US$ Mn), By Fuel Type , 2015 – 2021
Table 60: Asia Pacific Generator Sales Market Value (US$ Mn), By Fuel Type , 2022 – 2032
Table 61: Asia Pacific Generator Sales Market Value (US$ Mn), By Power Rating , 2015 – 2021
Table 62: Asia Pacific Generator Sales Market Value (US$ Mn), By Power Rating , 2022 – 2032
Table 63: Asia Pacific Generator Sales Market Value (US$ Mn), By End User , 2015 – 2021
Table 64: Asia Pacific Generator Sales Market Value (US$ Mn), By End User , 2022 – 2032
Table 65: Asia Pacific Generator Sales Market Value (US$ Mn), By Sales Channel , 2015 – 2021
Table 66: Asia Pacific Generator Sales Market Value (US$ Mn), By Sales Channel , 2022 – 2032
Table 67: Asia Pacific Generator Sales Market Value (US$ Mn), By Application, 2015 – 2021
Table 68: Asia Pacific Generator Sales Market Value (US$ Mn), By Application, 2022 – 2032
Table 69: Asia Pacific Generator Sales Market, By Country, 2015 – 2021
Table 70: Asia Pacific Generator Sales Market, By Country, 2022 – 2032
Table 71: MEA Generator Sales Market Value (US$ Mn),By Design , 2015 – 2021
Table 72: MEA Generator Sales Market Value (US$ Mn),By Design , 2022 – 2032
Table 73: MEA Generator Sales Market Value (US$ Mn), By Fuel Type , 2015 – 2021
Table 74: MEA Generator Sales Market Value (US$ Mn), By Fuel Type , 2022 – 2032
Table 75: MEA Generator Sales Market Value (US$ Mn), By Power Rating , 2015 – 2021
Table 76: MEA Generator Sales Market Value (US$ Mn), By Power Rating , 2022 – 2032
Table 77: MEA Generator Sales Market Value (US$ Mn), By End User , 2015 – 2021
Table 78: MEA Generator Sales Market Value (US$ Mn), By End User , 2022 – 2032
Table 79: MEA Generator Sales Market Value (US$ Mn), By Sales Channel , 2015 – 2021
Table 80: MEA Generator Sales Market Value (US$ Mn), By Sales Channel , 2022 – 2032
Table 81: MEA Generator Sales Market Value (US$ Mn), By Application, 2015 – 2021
Table 82: MEA Generator Sales Market Value (US$ Mn), By Application, 2022 – 2032
Table 83: MEA Generator Sales Market, By Country, 2015 – 2021
Table 84: MEA Generator Sales Market, By Country, 2022 – 2032
Find your sweet spots for generating winning opportunities in this market.
Talk to AnalystFigure 1: Global Generator Sales Market Value (US$ Mn) and Year-on-Year Growth, 2015-2032
Figure 2: Global Generator Sales Market Absolute $ Historical Gain (2015 - 2021) and Opportunity (2022 – 2032), US$ Mn
Figure 3: Global Generator Sales Market Share,By Design , 2022 & 2032
Figure 4: Global Generator Sales Market Y-o-Y Growth Projections,By Design – 2022-2032
Figure 5: Global Generator Sales Market Attractiveness Index,By Design – 2022-2032
Figure 6: Global Generator Sales Market Share, By Fuel Type , 2022 & 2032
Figure 7: Global Generator Sales Market Y-o-Y Growth Projections, By Fuel Type – 2022-2032
Figure 8: Global Generator Sales Market Attractiveness Index, By Fuel Type – 2022-2032
Figure 9: Global Generator Sales Market Share, By End User , 2022 & 2032
Figure 10: Global Generator Sales Market Y-o-Y Growth Projections, By End User – 2022-2032
Figure 11: Global Generator Sales Market Attractiveness Index, By End User – 2022-2032
Figure 12: Global Generator Sales Market Share, By Application, 2022 & 2032
Figure 13: Global Generator Sales Market Y-o-Y Growth Projections, By Application – 2022-2032
Figure 14: Global Generator Sales Market Attractiveness Index, By Application – 2022-2032
Figure 15: Global Generator Sales Market Share, By Power Rating , 2022 & 2032
Figure 16: Global Generator Sales Market Y-o-Y Growth Projections, By Power Rating – 2022-2032
Figure 17: Global Generator Sales Market Attractiveness Index, By Power Rating – 2022-2032
Figure 18: Global Generator Sales Market Share, By Sales Channel , 2022 & 2032
Figure 19: Global Generator Sales Market Y-o-Y Growth Projections, By Sales Channel – 2022-2032
Figure 20: Global Generator Sales Market Attractiveness Index, By Sales Channel – 2022-2032
Figure 21: Global Generator Sales Market Share, By Region, 2022 & 2032
Figure 22: Global Generator Sales Market Y-o-Y Growth Projections, By Region – 2022-2032
Figure 23: Global Generator Sales Market Attractiveness Index, By Region – 2022-2032
Figure 24: North America Generator Sales Market Value (US$ Mn) and Year-on-Year Growth, 2015-2032
Figure 25: North America Generator Sales Market Absolute $ Historical Gain (2015 - 2021) and Opportunity (2022 – 2032), US$ Mn
Figure 26: North America Generator Sales Market Share,By Design , 2022 & 2032
Figure 27: North America Generator Sales Market Y-o-Y Growth Projections,By Design – 2022-2032
Figure 28: North America Generator Sales Market Attractiveness Index,By Design – 2022-2032
Figure 29: North America Generator Sales Market Share, By Fuel Type , 2022 & 2032
Figure 30: North America Generator Sales Market Y-o-Y Growth Projections, By Fuel Type – 2022-2032
Figure 31: North America Generator Sales Market Attractiveness Index, By Fuel Type – 2022-2032
Figure 32: North America Generator Sales Market Share, By End User , 2022 & 2032
Figure 33: North America Generator Sales Market Y-o-Y Growth Projections, By End User – 2022-2032
Figure 34: North America Generator Sales Market Attractiveness Index, By End User – 2022-2032
Figure 35: North America Generator Sales Market Share, By Power Rating , 2022 & 2032
Figure 36: North America Generator Sales Market Y-o-Y Growth Projections, By Power Rating – 2022-2032
Figure 37: North America Generator Sales Market Attractiveness Index, By Power Rating – 2022-2032
Figure 38: North America Generator Sales Market Share, By Sales Channel , 2022 & 2032
Figure 39: North America Generator Sales Market Y-o-Y Growth Projections, By Sales Channel – 2022-2032
Figure 40: North America Generator Sales Market Attractiveness Index, By Sales Channel – 2022-2032
Figure 41: North America Generator Sales Market Share, By Application, 2022 & 2032
Figure 42: North America Generator Sales Market Y-o-Y Growth Projections, By Application – 2022-2032
Figure 43: North America Generator Sales Market Attractiveness Index, By Application – 2022-2032
Figure 44: North America Generator Sales Market Share, By Country, 2022 & 2032
Figure 45: North America Generator Sales Market Y-o-Y Growth Projections, By Country – 2022-2032
Figure 46: North America Generator Sales Market Attractiveness Index, By Country – 2022-2032
Figure 47: Latin America Generator Sales Market Value (US$ Mn) and Year-on-Year Growth, 2015-2032
Figure 48: Latin America Generator Sales Market Absolute $ Historical Gain (2015 - 2021) and Opportunity (2022 – 2032), US$ Mn
Figure 49: Latin America Generator Sales Market Share,By Design , 2022 & 2032
Figure 50: Latin America Generator Sales Market Y-o-Y Growth Projections,By Design – 2022-2032
Figure 51: Latin America Generator Sales Market Attractiveness Index,By Design – 2022-2032
Figure 52: Latin America Generator Sales Market Share, By Fuel Type , 2022 & 2032
Figure 53: Latin America Generator Sales Market Y-o-Y Growth Projections, By Fuel Type – 2022-2032
Figure 54: Latin America Generator Sales Market Attractiveness Index, By Fuel Type – 2022-2032
Figure 55: Latin America Generator Sales Market Share, By End User , 2022 & 2032
Figure 56: Latin America Generator Sales Market Y-o-Y Growth Projections, By End User – 2022-2032
Figure 57: Latin America Generator Sales Market Attractiveness Index, By End User – 2022-2032
Figure 58: Latin America Generator Sales Market Share, By Power Rating , 2022 & 2032
Figure 59: Latin America Generator Sales Market Y-o-Y Growth Projections, By Power Rating – 2022-2032
Figure 60: Latin America Generator Sales Market Attractiveness Index, By Power Rating – 2022-2032
Figure 61: Latin America Generator Sales Market Share, By Sales Channel , 2022 & 2032
Figure 62: Latin America Generator Sales Market Y-o-Y Growth Projections, By Sales Channel – 2022-2032
Figure 63: Latin America Generator Sales Market Attractiveness Index, By Sales Channel – 2022-2032
Figure 64: Latin America Generator Sales Market Share, By Application, 2022 & 2032
Figure 65: Latin America Generator Sales Market Y-o-Y Growth Projections, By Application – 2022-2032
Figure 66: Latin America Generator Sales Market Attractiveness Index, By Application – 2022-2032
Figure 67: Latin America Generator Sales Market Share, By Country, 2022 & 2032
Figure 68: Latin America Generator Sales Market Y-o-Y Growth Projections, By Country – 2022-2032
Figure 69: Latin America Generator Sales Market Attractiveness Index, By Country – 2022-2032
Figure 70: Europe Generator Sales Market Value (US$ Mn) and Year-on-Year Growth, 2015-2032
Figure 71: Europe Generator Sales Market Absolute $ Historical Gain (2015 - 2021) and Opportunity (2022 – 2032), US$ Mn
Figure 72: Europe Generator Sales Market Share,By Design , 2022 & 2032
Figure 73: Europe Generator Sales Market Y-o-Y Growth Projections,By Design – 2022-2032
Figure 74: Europe Generator Sales Market Attractiveness Index,By Design – 2022-2032
Figure 75: Europe Generator Sales Market Share, By Fuel Type , 2022 & 2032
Figure 76: Europe Generator Sales Market Y-o-Y Growth Projections, By Fuel Type – 2022-2032
Figure 77: Europe Generator Sales Market Attractiveness Index, By Fuel Type – 2022-2032
Figure 78: Europe Generator Sales Market Share, By End User , 2022 & 2032
Figure 79: Europe Generator Sales Market Y-o-Y Growth Projections, By End User – 2022-2032
Figure 80: Europe Generator Sales Market Attractiveness Index, By End User – 2022-2032
Figure 81: Europe Generator Sales Market Share, By Power Rating , 2022 & 2032
Figure 82: Europe Generator Sales Market Y-o-Y Growth Projections, By Power Rating – 2022-2032
Figure 83: Europe Generator Sales Market Attractiveness Index, By Power Rating – 2022-2032
Figure 84: Europe Generator Sales Market Share, By Sales Channel , 2022 & 2032
Figure 85: Europe Generator Sales Market Y-o-Y Growth Projections, By Sales Channel – 2022-2032
Figure 86: Europe Generator Sales Market Attractiveness Index, By Sales Channel – 2022-2032
Figure 87: Europe Generator Sales Market Share, By Application, 2022 & 2032
Figure 88: Europe Generator Sales Market Y-o-Y Growth Projections, By Application – 2022-2032
Figure 89: Europe Generator Sales Market Attractiveness Index, By Application – 2022-2032
Figure 90: Europe Generator Sales Market Share, By Country, 2022 & 2032
Figure 91: Europe Generator Sales Market Y-o-Y Growth Projections, By Country – 2022-2032
Figure 92: Europe Generator Sales Market Attractiveness Index, By Country – 2022-2032
Figure 93: Asia Pacific Generator Sales Market Value (US$ Mn) and Year-on-Year Growth, 2015-2032
Figure 94: Asia Pacific Generator Sales Market Absolute $ Historical Gain (2015 - 2021) and Opportunity (2022 – 2032), US$ Mn
Figure 95: Asia Pacific Generator Sales Market Share,By Design , 2022 & 2032
Figure 96: Asia Pacific Generator Sales Market Y-o-Y Growth Projections,By Design – 2022-2032
Figure 97: Asia Pacific Generator Sales Market Attractiveness Index,By Design – 2022-2032
Figure 98: Asia Pacific Generator Sales Market Share, By Fuel Type , 2022 & 2032
Figure 99: Asia Pacific Generator Sales Market Y-o-Y Growth Projections, By Fuel Type – 2022-2032
Figure 100: Asia Pacific Generator Sales Market Attractiveness Index, By Fuel Type – 2022-2032
Figure 101: Asia Pacific Generator Sales Market Share, By End User , 2022 & 2032
Figure 102: Asia Pacific Generator Sales Market Y-o-Y Growth Projections, By End User – 2022-2032
Figure 103: Asia Pacific Generator Sales Market Attractiveness Index, By End User – 2022-2032
Figure 104: Asia Pacific Generator Sales Market Share, By Power Rating , 2022 & 2032
Figure 105: Asia Pacific Generator Sales Market Y-o-Y Growth Projections, By Power Rating – 2022-2032
Figure 106: Asia Pacific Generator Sales Market Attractiveness Index, By Power Rating – 2022-2032
Figure 107: Asia Pacific Generator Sales Market Share, By Sales Channel , 2022 & 2032
Figure 108: Asia Pacific Generator Sales Market Y-o-Y Growth Projections, By Sales Channel – 2022-2032
Figure 109: Asia Pacific Generator Sales Market Attractiveness Index, By Sales Channel – 2022-2032
Figure 110: Asia Pacific Generator Sales Market Share, By Application, 2022 & 2032
Figure 111: Asia Pacific Generator Sales Market Y-o-Y Growth Projections, By Application – 2022-2032
Figure 112: Asia Pacific Generator Sales Market Attractiveness Index, By Application – 2022-2032
Figure 113: Asia Pacific Generator Sales Market Share, By Country, 2022 & 2032
Figure 114: Asia Pacific Generator Sales Market Y-o-Y Growth Projections, By Country – 2022-2032
Figure 115: Asia Pacific Generator Sales Market Attractiveness Index, By Country – 2022-2032
Figure 116: MEA Generator Sales Market Value (US$ Mn) and Year-on-Year Growth, 2015-2032
Figure 117: MEA Generator Sales Market Absolute $ Historical Gain (2015 - 2021) and Opportunity (2022 – 2032), US$ Mn
Figure 118: MEA Generator Sales Market Share,By Design , 2022 & 2032
Figure 119: MEA Generator Sales Market Y-o-Y Growth Projections,By Design – 2022-2032
Figure 120: MEA Generator Sales Market Attractiveness Index,By Design – 2022-2032
Figure 121: MEA Generator Sales Market Share, By Fuel Type , 2022 & 2032
Figure 122: MEA Generator Sales Market Y-o-Y Growth Projections, By Fuel Type – 2022-2032
Figure 123: MEA Generator Sales Market Attractiveness Index, By Fuel Type – 2022-2032
Figure 124: MEA Generator Sales Market Share, By End User , 2022 & 2032
Figure 125: MEA Generator Sales Market Y-o-Y Growth Projections, By End User – 2022-2032
Figure 126: MEA Generator Sales Market Attractiveness Index, By End User – 2022-2032
Figure 127: MEA Generator Sales Market Share, By Power Rating , 2022 & 2032
Figure 128: MEA Generator Sales Market Y-o-Y Growth Projections, By Power Rating – 2022-2032
Figure 129: MEA Generator Sales Market Attractiveness Index, By Power Rating – 2022-2032
Figure 130: MEA Generator Sales Market Share, By Sales Channel , 2022 & 2032
Figure 131: MEA Generator Sales Market Y-o-Y Growth Projections, By Sales Channel – 2022-2032
Figure 132: MEA Generator Sales Market Attractiveness Index, By Sales Channel – 2022-2032
Figure 133: MEA Generator Sales Market Share, By Application, 2022 & 2032
Figure 134: MEA Generator Sales Market Y-o-Y Growth Projections, By Application – 2022-2032
Figure 135: MEA Generator Sales Market Attractiveness Index, By Application – 2022-2032
Figure 136: MEA Generator Sales Market Share, By Country, 2022 & 2032
Figure 137: MEA Generator Sales Market Y-o-Y Growth Projections, By Country – 2022-2032
Figure 138: MEA Generator Sales Market Attractiveness Index, By Country – 2022-2032
Need specific information?
Request CustomizationExplore Oil and Gas Insights
View Reports