PLL Clock Generator Market Snapshot (2022 to 2032)

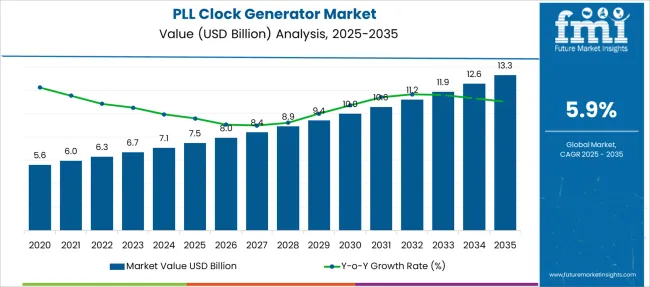
Global PLL clock generator market demand is anticipated to be valued at USD 6,322.9 Million in 2022, forecast a CAGR of 5.9% to be valued at USD 11,182.7 Million from 2022 to 2032. Growth is attributed to increasing digitalization and increased use of semiconductors. From 2016 to 2021 a CAGR of 4.6% was registered for the PLL clock generator market.

Today clock generators have become the basic building blocks of all electronics. They have a wide variety of applications, ranging from a small memory chip to a supercomputer. Clock generators basically generate waveforms, which are required for working at a particular frequency, as required by the equipment.

In many applications, oscillators are used for the same, but a clock generator can generate a variety of frequencies, which cannot be generated using an oscillator. Basically, a clock generator has two components, namely resonators, and crystals.

Apart from the umpteenth of uses of clock generators, PLL clock generators came into the market because of the additional advantages it carries like low noise and jitter. Basically, a PLL is a phase-locked loop, which is used to remove the error which occurs in the frequency generated.

It removes the error in the frequency by comparing the output with a reference signal and then generates an error signal, and the output signal gets corrected by the error signal, by either decreasing or increasing it, and then the correct signal is locked which is then sent to the specified application, thus improving the accuracy of the generated frequency.

Data Points Key Statistics
Growth Rate (2016 to 2021) 4.6% CAGR
Projected Growth Rate (2022 to 2032) 5.9% CAGR
Expected Market Value (2022) USD 6,322.9 Million
Anticipated Forecast Value (2032) USD 11,182.7 Million

Which are Some Prominent Drivers Spearheading PLL Clock Generator Market Growth?

Growing Applications in Many Devices Drive the Growth of the Market

With the increasingly stringent timing constraints required in high-performance systems extensively used in day-to-day applications today, the PLL clock generator is finding its applications in myriads of devices. This extensive use of the PLL clock generator is expected to increase its demand in the market, witnessing a healthy CAGR in the forecast period.

Phase/delay compensation, frequency multiplication, duty cycle correction, decreased noise, and jitter are some of the key benefits, offered by the PLL clock generator, which are not present in simple clock generators. As the PLL clock generator is the basic building block of any system, these benefits basically eliminate all the errors that can occur while frequency generation. This highly reduces the probability of errors in the overall system, may the PLL clock generator is deployed in any system.

What are the Challenges Faced by the PLL Clock Generator Industry?

High Cost May Impede the Growth of the Market

Although the PLL clock generator market has numerous end-uses, there are numerous obstacles that likely pose a challenge to market growth. Factors such as high cost can be expected to make a negative impact on the market in short term, but as the benefits from the PLL clock generator are ascertained, the overall impact will diminish in the long term.

However, the paradigm shifts from using basic clock generators to PLL clock generators, due to reduced jitter and noise, thereby increasing the overall efficiency of the systems in which the PLL clock generators are deployed, which is expected to continue propelling the market for PLL clock generators during the forecast period
Why is North America Emerging as an Opportunistic PLL Clock Generator Market?

Increase in Adoption of Smart Devices Driving Market Expansion

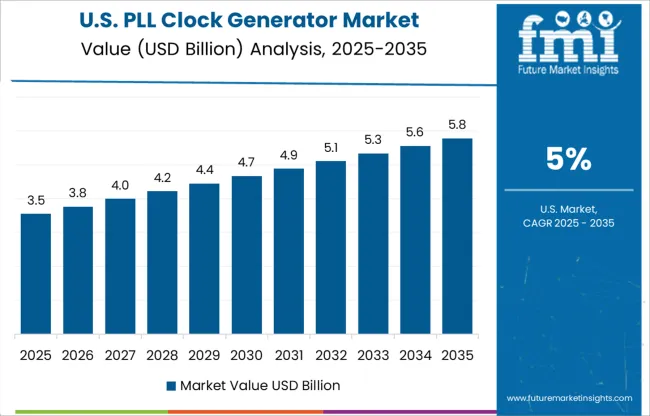
North America will continue to dominate the global PLL clock generator market attributed to the significant demand for high-quality, durable, and unique features n gadgets. North America accounts for a total of 32.2% of the global PLL clock generator market share.

The increasing use in end-use applications ranging from IoT, connected devices, and artificial intelligence are effectively leveraging the use of the PLL clock generator. Furthermore, defense and commercial applications involving 5G technologies boost market size across the USA
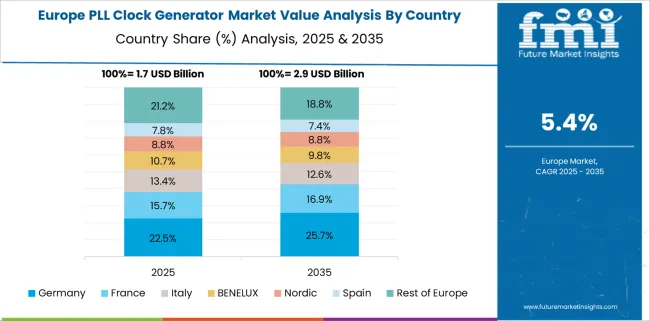
How is Europe Contributing to the Growth of the PLL Clock Generator Market?

Increasing Advancements in Semiconductor System Designs Driving Market Growth in Europe

According to Future Market Insights, Europe is expected to provide immense growth opportunities for the PLL clock generator market, due to the presence of a large number of semiconductor industries. Europe is projected to account for 21.1% of the total market share in the PLL clock generator market during the assessment period.

The market is interspersed with increasing investments by prominent market players. Advanced semiconductor system design and manufacturing, rising investments by key players in electric vehicles, and growing usage of smartphones are driving market growth in Europe.

Will the Asia Pacific emerge as an Attractive PLL Clock Generator Market?

The Asia Pacific is anticipated to exhibit a significant growth rate in the PLL clock generator market over the forecast period. The growth of the market in the region is attributed to the growing electronic industry.

Due to the rising use of semiconductor systems in various industries, including automotive, consumer electronics, IT, and telecommunications, the PLL clock generator market is expected to witness growth in the region. Also, the growing use of consumer electronics, automotive applications, and manufacturing applications of the Internet of Things (IoT), as well as rapid IoT adoption in many of these sectors also boosts the market demand.

Asia-Pacific is expected to register the fastest growth in revenue generation in the PLL clock generator market due to the presence of giant local manufacturers in countries, such as Japan, China, and India.

Startup Scenario

The new entrants in the PLL clock generator market are continually indulging in several collaborations and highly investing in research and development activities to provide more convenient solutions to industry verticals. Some of the major start-ups that are leading the development of the market are - Mouser Electronics and Maxmimintegrated
  • Maxmimintegrated introduced the MAX9491 multipurpose clock generator ideal for communication applications. It offers a factory-programmable PLL output that can be set to almost any frequency, ranging from 4MHz to 200MHz. The MAX9491 uses a one-time programmable (OTP) ROM to program the PLL output. The MAX9491 also features an integrated voltage-controlled crystal oscillator (VCXO) that is tuned by a DC voltage.

Market Competition

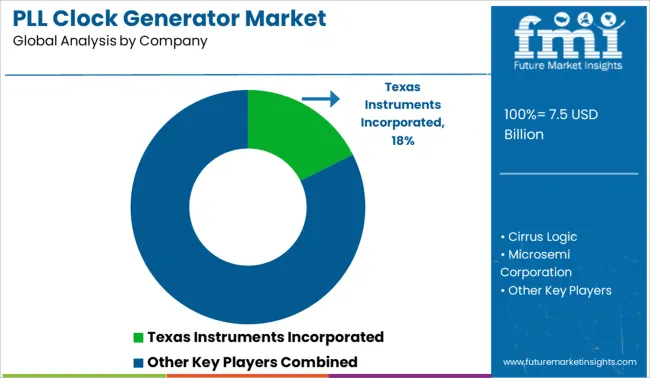
Cirrus Logic, Microsemi Corporation, ON Semiconductor, Maxim Integrated, Integrated Device Technology, Inc., and Texas Instruments Incorporated, are some of the key players in the PLL Clock Generator market.

Key development:

Product launch

  • In August 2015, Texas Instruments launched LMK03328. The product has an edge over the other PLL clock generators because of an Ultra-Low Jitter Clock Generator and can generate multiple clocks for various multi-gigabit serial interfaces and digital devices which improves reliability and the ultra-low jitter reduces the bit error rate in high-speed serial links
  • In October 2022 Renesas Electronics Corporation a premier supplier of advanced semiconductor solutions announced that it has completed the acquisition of Steradian Semiconductors Private Limited (Steradian), a fabless semiconductor company providing 4D imaging radar solutions
  • In July 2021 - Cirrus Logic, Inc. announced the acquisition of California-based Lion Semiconductor for USD 335 million in cash. This acquisition brings unique intellectual property and products for power applications in smartphones, laptops, and other devices and accelerates the growth of the company’s high-performance mixed-signal business.
  • In October 2020 - Microchip Technology Inc. announced the acquisition of Tekron International Limited, a global leader in providing high-precision GPS and atomic clock time-keeping technologies and solutions for the smart grid and other industrial applications.

Report Scope

Report Attribute Details
Growth Rate CAGR of 5.9% from 2022 to 2032
Expected Market Value (2022) USD 6,322.9 Million
Anticipated Forecast Value (2032) USD 11,182.7 Million
Base Year for Estimation 2021
Historical Data 2016 to 2021
Forecast Period 2022 to 2032
Quantitative Units Revenue in USD Million and CAGR from 2022 to 2032
Report Coverage Revenue Forecast, Volume Forecast, Company Ranking, Competitive Landscape, Growth Factors, Trends, and Pricing Analysis
Segments Covered Output Frequency, Output Stage, Region
Regions Covered North America; Latin America; Europe; Asia Pacific; Middle East and Africa
Key Countries Profiled USA, Canada, Mexico, Brazil, Germany, Italy, France, United Kingdom, Spain, China, Japan, South Korea, Indonesia, Thailand, Singapore, Australia, New Zealand, GCC Countries, South Africa, Israel
Key Companies Profiled Cirrus Logic; Microsemi Corporation; ON Semiconductor; Maxim Integrated; Integrated Device Technology Inc.; Texas Instruments Incorporated
Customization Available Upon Request

Key Segments Profiled in the PLL Clock Generator Industry Survey

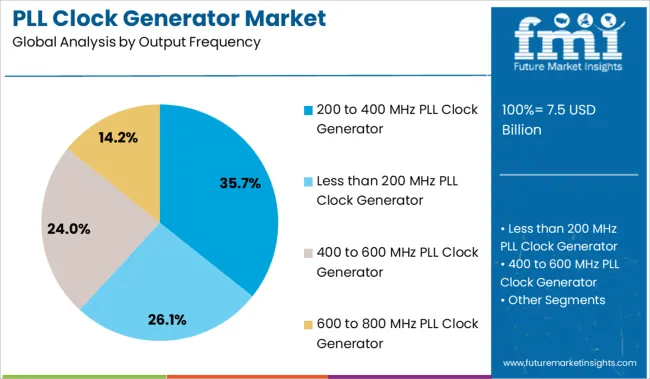
PLL Clock Generator Market by Output Frequency:

  • Less than 200 MHz PLL Clock Generator
  • 200 to 400 MHz PLL Clock Generator
  • 400 to 600 MHz PLL Clock Generator
  • 600 to 800 MHz PLL Clock Generator

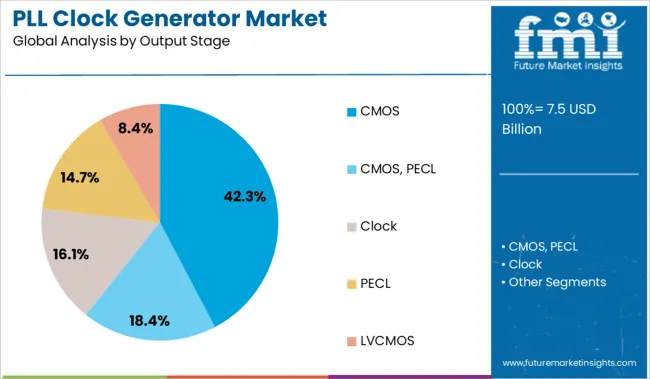
PLL Clock Generator Market by Output Stage:

  • CMOS
  • CMOS, PECL
  • Clock
  • PECL
  • LVCMOS

PLL Clock Generator Market by Region:

  • North America PLL Clock Generator Market
  • Latin America PLL Clock Generator Market
  • Europe PLL Clock Generator Market
  • Asia-Pacific PLL Clock Generator Market
  • Middle East & Africa. PLL Clock Generator Market

Table of Content

  • 1. Executive Summary
  • 2. Market Overview
  • 3. Market Background
  • 4. Global Market Analysis 2016 to 2021 and Forecast, 2022 to 2032
  • 5. Global Market Analysis 2016 to 2021 and Forecast 2022 to 2032, By Output Frequency
    • 5.1. Less than 200 MHz
    • 5.2. 200-400 MHz
    • 5.3. 400-600 MHz
    • 5.4. 600-800 MHz
  • 6. Global Market Analysis 2016 to 2021 and Forecast 2022 to 2032, By Output Stage
    • 6.1. CMOS
    • 6.2. CMOS, PECL
    • 6.3. Clock
    • 6.4. PECL
    • 6.5. LVCMOS
  • 7. Global Market Analysis 2016 to 2021 and Forecast 2022 to 2032, By Region
    • 7.1. North America
    • 7.2. Latin America
    • 7.3. Europe
    • 7.4. Asia Pacific
    • 7.5. Middle East and Africa (MEA)
  • 8. North America Market Analysis 2016 to 2021 and Forecast 2022 to 2032, By Country
  • 9. Latin America Market Analysis 2016 to 2021 and Forecast 2022 to 2032, By Country
  • 10. Europe Market Analysis 2016 to 2021 and Forecast 2022 to 2032, By Country
  • 11. Asia Pacific Market Analysis 2016 to 2021 and Forecast 2022 to 2032, By Country
  • 12. MEA Market Analysis 2016 to 2021 and Forecast 2022 to 2032, By Country
  • 13. Key Countries Market Analysis
  • 14. Market Structure Analysis
  • 15. Competition Analysis
    • 15.1. Cirrus Logic
    • 15.2. Microsemi Corporation
    • 15.3. ON Semiconductor
    • 15.4. Maxim Integrated
    • 15.5. Renesas
    • 15.6. Texas Instruments Incorporated
  • 16. Assumptions & Acronyms Used
  • 17. Research Methodology

List of Tables

Table 1: Global Market Value (US$ Million) Forecast by Region, 2016 to 2032

Table 2: Global Market Volume (Units) Forecast by Region, 2016 to 2032

Table 3: Global Market Value (US$ Million) Forecast by Output Frequency, 2016 to 2032

Table 4: Global Market Volume (Units) Forecast by Output Frequency, 2016 to 2032

Table 5: Global Market Value (US$ Million) Forecast by Output Stage, 2016 to 2032

Table 6: Global Market Volume (Units) Forecast by Output Stage, 2016 to 2032

Table 7: North America Market Value (US$ Million) Forecast by Country, 2016 to 2032

Table 8: North America Market Volume (Units) Forecast by Country, 2016 to 2032

Table 9: North America Market Value (US$ Million) Forecast by Output Frequency, 2016 to 2032

Table 10: North America Market Volume (Units) Forecast by Output Frequency, 2016 to 2032

Table 11: North America Market Value (US$ Million) Forecast by Output Stage, 2016 to 2032

Table 12: North America Market Volume (Units) Forecast by Output Stage, 2016 to 2032

Table 13: Latin America Market Value (US$ Million) Forecast by Country, 2016 to 2032

Table 14: Latin America Market Volume (Units) Forecast by Country, 2016 to 2032

Table 15: Latin America Market Value (US$ Million) Forecast by Output Frequency, 2016 to 2032

Table 16: Latin America Market Volume (Units) Forecast by Output Frequency, 2016 to 2032

Table 17: Latin America Market Value (US$ Million) Forecast by Output Stage, 2016 to 2032

Table 18: Latin America Market Volume (Units) Forecast by Output Stage, 2016 to 2032

Table 19: Europe Market Value (US$ Million) Forecast by Country, 2016 to 2032

Table 20: Europe Market Volume (Units) Forecast by Country, 2016 to 2032

Table 21: Europe Market Value (US$ Million) Forecast by Output Frequency, 2016 to 2032

Table 22: Europe Market Volume (Units) Forecast by Output Frequency, 2016 to 2032

Table 23: Europe Market Value (US$ Million) Forecast by Output Stage, 2016 to 2032

Table 24: Europe Market Volume (Units) Forecast by Output Stage, 2016 to 2032

Table 25: Asia Pacific Market Value (US$ Million) Forecast by Country, 2016 to 2032

Table 26: Asia Pacific Market Volume (Units) Forecast by Country, 2016 to 2032

Table 27: Asia Pacific Market Value (US$ Million) Forecast by Output Frequency, 2016 to 2032

Table 28: Asia Pacific Market Volume (Units) Forecast by Output Frequency, 2016 to 2032

Table 29: Asia Pacific Market Value (US$ Million) Forecast by Output Stage, 2016 to 2032

Table 30: Asia Pacific Market Volume (Units) Forecast by Output Stage, 2016 to 2032

Table 31: Middle East and Africa(MEA) Market Value (US$ Million) Forecast by Country, 2016 to 2032

Table 32: Middle East and Africa(MEA) Market Volume (Units) Forecast by Country, 2016 to 2032

Table 33: Middle East and Africa(MEA) Market Value (US$ Million) Forecast by Output Frequency, 2016 to 2032

Table 34: Middle East and Africa(MEA) Market Volume (Units) Forecast by Output Frequency, 2016 to 2032

Table 35: Middle East and Africa(MEA) Market Value (US$ Million) Forecast by Output Stage, 2016 to 2032

Table 36: Middle East and Africa(MEA) Market Volume (Units) Forecast by Output Stage, 2016 to 2032

List of Figures

Figure 1: Global Market Value (US$ Million) by Output Frequency, 2022 to 2032

Figure 2: Global Market Value (US$ Million) by Output Stage, 2022 to 2032

Figure 3: Global Market Value (US$ Million) by Region, 2022 to 2032

Figure 4: Global Market Value (US$ Million) Analysis by Region, 2016 to 2032

Figure 5: Global Market Volume (Units) Analysis by Region, 2016 to 2032

Figure 6: Global Market Value Share (%) and BPS Analysis by Region, 2022 to 2032

Figure 7: Global Market Y-o-Y Growth (%) Projections by Region, 2022 to 2032

Figure 8: Global Market Value (US$ Million) Analysis by Output Frequency, 2016 to 2032

Figure 9: Global Market Volume (Units) Analysis by Output Frequency, 2016 to 2032

Figure 10: Global Market Value Share (%) and BPS Analysis by Output Frequency, 2022 to 2032

Figure 11: Global Market Y-o-Y Growth (%) Projections by Output Frequency, 2022 to 2032

Figure 12: Global Market Value (US$ Million) Analysis by Output Stage, 2016 to 2032

Figure 13: Global Market Volume (Units) Analysis by Output Stage, 2016 to 2032

Figure 14: Global Market Value Share (%) and BPS Analysis by Output Stage, 2022 to 2032

Figure 15: Global Market Y-o-Y Growth (%) Projections by Output Stage, 2022 to 2032

Figure 16: Global Market Attractiveness by Output Frequency, 2022 to 2032

Figure 17: Global Market Attractiveness by Output Stage, 2022 to 2032

Figure 18: Global Market Attractiveness by Region, 2022 to 2032

Figure 19: North America Market Value (US$ Million) by Output Frequency, 2022 to 2032

Figure 20: North America Market Value (US$ Million) by Output Stage, 2022 to 2032

Figure 21: North America Market Value (US$ Million) by Country, 2022 to 2032

Figure 22: North America Market Value (US$ Million) Analysis by Country, 2016 to 2032

Figure 23: North America Market Volume (Units) Analysis by Country, 2016 to 2032

Figure 24: North America Market Value Share (%) and BPS Analysis by Country, 2022 to 2032

Figure 25: North America Market Y-o-Y Growth (%) Projections by Country, 2022 to 2032

Figure 26: North America Market Value (US$ Million) Analysis by Output Frequency, 2016 to 2032

Figure 27: North America Market Volume (Units) Analysis by Output Frequency, 2016 to 2032

Figure 28: North America Market Value Share (%) and BPS Analysis by Output Frequency, 2022 to 2032

Figure 29: North America Market Y-o-Y Growth (%) Projections by Output Frequency, 2022 to 2032

Figure 30: North America Market Value (US$ Million) Analysis by Output Stage, 2016 to 2032

Figure 31: North America Market Volume (Units) Analysis by Output Stage, 2016 to 2032

Figure 32: North America Market Value Share (%) and BPS Analysis by Output Stage, 2022 to 2032

Figure 33: North America Market Y-o-Y Growth (%) Projections by Output Stage, 2022 to 2032

Figure 34: North America Market Attractiveness by Output Frequency, 2022 to 2032

Figure 35: North America Market Attractiveness by Output Stage, 2022 to 2032

Figure 36: North America Market Attractiveness by Country, 2022 to 2032

Figure 37: Latin America Market Value (US$ Million) by Output Frequency, 2022 to 2032

Figure 38: Latin America Market Value (US$ Million) by Output Stage, 2022 to 2032

Figure 39: Latin America Market Value (US$ Million) by Country, 2022 to 2032

Figure 40: Latin America Market Value (US$ Million) Analysis by Country, 2016 to 2032

Figure 41: Latin America Market Volume (Units) Analysis by Country, 2016 to 2032

Figure 42: Latin America Market Value Share (%) and BPS Analysis by Country, 2022 to 2032

Figure 43: Latin America Market Y-o-Y Growth (%) Projections by Country, 2022 to 2032

Figure 44: Latin America Market Value (US$ Million) Analysis by Output Frequency, 2016 to 2032

Figure 45: Latin America Market Volume (Units) Analysis by Output Frequency, 2016 to 2032

Figure 46: Latin America Market Value Share (%) and BPS Analysis by Output Frequency, 2022 to 2032

Figure 47: Latin America Market Y-o-Y Growth (%) Projections by Output Frequency, 2022 to 2032

Figure 48: Latin America Market Value (US$ Million) Analysis by Output Stage, 2016 to 2032

Figure 49: Latin America Market Volume (Units) Analysis by Output Stage, 2016 to 2032

Figure 50: Latin America Market Value Share (%) and BPS Analysis by Output Stage, 2022 to 2032

Figure 51: Latin America Market Y-o-Y Growth (%) Projections by Output Stage, 2022 to 2032

Figure 52: Latin America Market Attractiveness by Output Frequency, 2022 to 2032

Figure 53: Latin America Market Attractiveness by Output Stage, 2022 to 2032

Figure 54: Latin America Market Attractiveness by Country, 2022 to 2032

Figure 55: Europe Market Value (US$ Million) by Output Frequency, 2022 to 2032

Figure 56: Europe Market Value (US$ Million) by Output Stage, 2022 to 2032

Figure 57: Europe Market Value (US$ Million) by Country, 2022 to 2032

Figure 58: Europe Market Value (US$ Million) Analysis by Country, 2016 to 2032

Figure 59: Europe Market Volume (Units) Analysis by Country, 2016 to 2032

Figure 60: Europe Market Value Share (%) and BPS Analysis by Country, 2022 to 2032

Figure 61: Europe Market Y-o-Y Growth (%) Projections by Country, 2022 to 2032

Figure 62: Europe Market Value (US$ Million) Analysis by Output Frequency, 2016 to 2032

Figure 63: Europe Market Volume (Units) Analysis by Output Frequency, 2016 to 2032

Figure 64: Europe Market Value Share (%) and BPS Analysis by Output Frequency, 2022 to 2032

Figure 65: Europe Market Y-o-Y Growth (%) Projections by Output Frequency, 2022 to 2032

Figure 66: Europe Market Value (US$ Million) Analysis by Output Stage, 2016 to 2032

Figure 67: Europe Market Volume (Units) Analysis by Output Stage, 2016 to 2032

Figure 68: Europe Market Value Share (%) and BPS Analysis by Output Stage, 2022 to 2032

Figure 69: Europe Market Y-o-Y Growth (%) Projections by Output Stage, 2022 to 2032

Figure 70: Europe Market Attractiveness by Output Frequency, 2022 to 2032

Figure 71: Europe Market Attractiveness by Output Stage, 2022 to 2032

Figure 72: Europe Market Attractiveness by Country, 2022 to 2032

Figure 73: Asia Pacific Market Value (US$ Million) by Output Frequency, 2022 to 2032

Figure 74: Asia Pacific Market Value (US$ Million) by Output Stage, 2022 to 2032

Figure 75: Asia Pacific Market Value (US$ Million) by Country, 2022 to 2032

Figure 76: Asia Pacific Market Value (US$ Million) Analysis by Country, 2016 to 2032

Figure 77: Asia Pacific Market Volume (Units) Analysis by Country, 2016 to 2032

Figure 78: Asia Pacific Market Value Share (%) and BPS Analysis by Country, 2022 to 2032

Figure 79: Asia Pacific Market Y-o-Y Growth (%) Projections by Country, 2022 to 2032

Figure 80: Asia Pacific Market Value (US$ Million) Analysis by Output Frequency, 2016 to 2032

Figure 81: Asia Pacific Market Volume (Units) Analysis by Output Frequency, 2016 to 2032

Figure 82: Asia Pacific Market Value Share (%) and BPS Analysis by Output Frequency, 2022 to 2032

Figure 83: Asia Pacific Market Y-o-Y Growth (%) Projections by Output Frequency, 2022 to 2032

Figure 84: Asia Pacific Market Value (US$ Million) Analysis by Output Stage, 2016 to 2032

Figure 85: Asia Pacific Market Volume (Units) Analysis by Output Stage, 2016 to 2032

Figure 86: Asia Pacific Market Value Share (%) and BPS Analysis by Output Stage, 2022 to 2032

Figure 87: Asia Pacific Market Y-o-Y Growth (%) Projections by Output Stage, 2022 to 2032

Figure 88: Asia Pacific Market Attractiveness by Output Frequency, 2022 to 2032

Figure 89: Asia Pacific Market Attractiveness by Output Stage, 2022 to 2032

Figure 90: Asia Pacific Market Attractiveness by Country, 2022 to 2032

Figure 91: Middle East and Africa(MEA) Market Value (US$ Million) by Output Frequency, 2022 to 2032

Figure 92: Middle East and Africa(MEA) Market Value (US$ Million) by Output Stage, 2022 to 2032

Figure 93: Middle East and Africa(MEA) Market Value (US$ Million) by Country, 2022 to 2032

Figure 94: Middle East and Africa(MEA) Market Value (US$ Million) Analysis by Country, 2016 to 2032

Figure 95: Middle East and Africa(MEA) Market Volume (Units) Analysis by Country, 2016 to 2032

Figure 96: Middle East and Africa(MEA) Market Value Share (%) and BPS Analysis by Country, 2022 to 2032

Figure 97: Middle East and Africa(MEA) Market Y-o-Y Growth (%) Projections by Country, 2022 to 2032

Figure 98: Middle East and Africa(MEA) Market Value (US$ Million) Analysis by Output Frequency, 2016 to 2032

Figure 99: Middle East and Africa(MEA) Market Volume (Units) Analysis by Output Frequency, 2016 to 2032

Figure 100: Middle East and Africa(MEA) Market Value Share (%) and BPS Analysis by Output Frequency, 2022 to 2032

Figure 101: Middle East and Africa(MEA) Market Y-o-Y Growth (%) Projections by Output Frequency, 2022 to 2032

Figure 102: Middle East and Africa(MEA) Market Value (US$ Million) Analysis by Output Stage, 2016 to 2032

Figure 103: Middle East and Africa(MEA) Market Volume (Units) Analysis by Output Stage, 2016 to 2032

Figure 104: Middle East and Africa(MEA) Market Value Share (%) and BPS Analysis by Output Stage, 2022 to 2032

Figure 105: Middle East and Africa(MEA) Market Y-o-Y Growth (%) Projections by Output Stage, 2022 to 2032

Figure 106: Middle East and Africa(MEA) Market Attractiveness by Output Frequency, 2022 to 2032

Figure 107: Middle East and Africa(MEA) Market Attractiveness by Output Stage, 2022 to 2032

Figure 108: Middle East and Africa(MEA) Market Attractiveness by Country, 2022 to 2032

Frequently Asked Questions

What is the anticipated growth of the PLL clock generators market until 2032?

FMI projects the global PLL clock generators market to expand at a 5.9% value CAGR by 2032.

Which region is forecast to be the most lucrative for PLL clock generator market growth?

North America is expected to be the most opportunistic with a 32.2% share of the total PLL clock generators market

Which are some prominent dialysis PLL clock generators market manufacturers?

Cirrus Logic, Microsemi Corporation, ON Semiconductor, Maxim Integrated, and Integrated Device Technology, Inc. are some prominent PLL clock generators, and market manufacturers.

Explore Similar Insights

Future Market Insights

PLL Clock Generator Market