Reports

- Global Locations -

Headquarters

Future Market Insights, Inc.

Christiana Corporate, 200
Continental Drive, Suite 401,
Newark, Delaware - 19713,
United States

T: +1-845-579-5705

Americas

Future Market Insights, Inc.

616 Corporate Way, Suite 2-9018,
Valley Cottage, NY 10989, United States

T: +1-347-918-3531

MEA

Future Market Insights

1602-6 Jumeirah Bay X2 Tower, Plot No: JLT-PH2-X2A,
Jumeirah Lakes Towers, Dubai,
United Arab Emirates

Europe

Future Market Insights

3rd Floor, 207 Regent Street,
W1B 3HH London
United Kingdom

T: + 44 (0) 20 8123 9659
D: +44 (0) 20 3287 4268

Asia Pacific

Future Market Insights

IndiaLand Global Tech Park, Unit UG-1, Behind Grand HighStreet, Phase 1, Hinjawadi, MH, Pune – 411057, India

Sales Coaching Software Market (2022 to 2032)

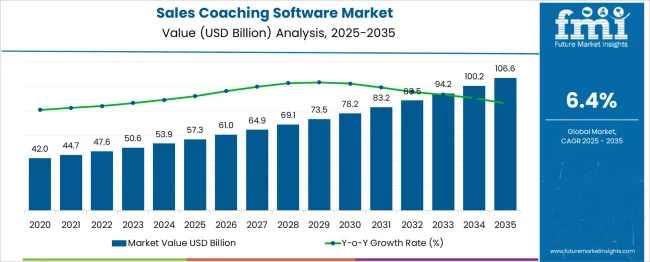
[300 Pages Report] The sales coaching software market is expected to record a CAGR of 6.4% during the forecast period 2022 to 2032, up from US$ 47.6 Billion in the year 2022 to reach a valuation of US$ 88.7 Billion by 2032. From 2021 to 2022, the industry is poised to document a Y-o-Y growth rate of 8.4%, increasing from its previous valuation of US4 43.9 Billion.

Organizations build the necessary skills to maximize the level of sales performance through the adaptation of various skills development programs and workshops that are created by the business in order to uncover new ways for growth and build pathways for a sustained market share.

Attributes Details
Sales Coaching Software Market CAGR (2022 to 2032) 6.4%
Sales Coaching Software Market Size (2022) US$ 47.6 Billion
Sales Coaching Software Market Size (2032) US$ 88.7 Billion

AI can be used to evaluate conversations and identify when sales representatives are struggling to discuss a solution or talking about key topics, prompting other talking points based on the evidence. In a remote working environment, coaches can provide effective coaching with the help of software. The software records video and audio of meetings, so managers can re-watch those meetings from around the world and still offer helpful advice, to their representatives in the organizations.

Even though some tools are specifically designed to be used as sales coaching software, some sales software solutions can do the job of upskilling or coaching sales professionals as part of a comprehensive sales enablement solution. By leveraging artificial intelligence, sales reps can offer upsells to their engaged contacts and handle tricky scenarios with ease. In addition to collecting valuable sales data, these tools rate reps based on how well their calls match up with successful templates, such as the talking/listening ratio, the focus of their conversation, and the length of the call.

Don't pay for what you don't need

Customize your report by selecting specific countries or regions and save 30%!

What is Driving Market Growth of Sales Coaching Software?

A sales coaching program provides coaching through a variety of features including real-time feedback, analysis of customer interactions, and the signaling of upselling and close opportunities. To meet that demand, such tools are becoming increasingly popular in the market for sales coaching software, thereby raising the prospects for the market's future growth. The product would be further optimized and advanced using the latest technological innovations and advancements, making it suitable for a wide variety of industrial and commercial applications.

In addition, organizations are becoming more inclined to use digital coaching tools, and their desire to improve long-term business prospects has contributed to the growth of the sales coaching software market. Employees can use this software if they wish to view the past communications of a client to comply with the growing demand for reviewing past conversations. As technology advances and artificial intelligence (AI) is aiding live feeds to make performance evaluations more objective, there is a growing demand for sales coaching software in various parts of the world.

Sales Coaching Software Market

Managers and salespeople can collaborate and analyze emails and phone calls using sales coaching software. Improved sales close rate, improved sales techniques, and the setting of best practices can be achieved by this training. The use of sales coaching and feedback can benefit everyone, from aspiring salespeople to talented professionals. In addition, the ramp time of a sales team can be shortened with the help of sales coaching tools since they enable them to identify areas for improvement quickly.

Software designed for sales coaching allows teams to align their approach and messaging when interacting with clients. In addition, the expected growth of the sales coaching software market can be attributed to the growing acceptance of digital coaching technologies among organizations, as well as the need to ensure long-term sales success.

Businesses can improve the effectiveness of their sales cycle by tracking deal risks, tracking adoption, and identifying the next steps with AI-based insights. As a key to business success, it is essential to strengthening learning through systematic and continuous learning. Developing sales training programs with sales coaching software can help with these initiatives. Keeping training concise can make it easier to spread them over a long period by breaking them down as needed.

Managers, executives, and sales coaches can work together to identify actions sales professionals need to implement and manage to develop their sales skills. In addition, to call tracking and web conferencing, software integrations also include sales performance tracking and CRM systems. By integrating data from your sales coaching software and existing systems, a business can know its customers better.

Challenges to Sales Coaching Software Vendors in the Global Market?

Coaches are capable of helping the sales team to develop both their skills and confidence. Onboarding will improve, turnover will be reduced, sales will rise, and revenue will be boosted. With ongoing sales coaching software, the return on investment will increase. The impact will vary according to the ability of the coaching software. The efficacy of coaching sessions will increase as employees gain more experience dealing with challenges.

Sales training programs have virtually no chance of producing lasting results if they fail to analyze the real learning needs of their team. If businesses are not aware of what skills the team already has and where their weaknesses lie this will hamper the growth of the software that's relevant to them and is expected to hamper sales in the market.

Many sales training programs fail to teach employees how to move prospects through the funnel systematically. Training is easily forgotten without a systematic approach, and salespeople waste a lot of time and effort reinventing themselves. All these factors have hampered the growth of the market.

Sudip Saha
Sudip Saha

Principal Consultant

Talk to Analyst

Find your sweet spots for generating winning opportunities in this market.

Comparative View of Sales Coaching Software Market

Sales Coaching Software Market:

Attributes Sales Coaching Software Market
CAGR (2022 to 2032) 6.4%
Market Value (2032) US$ 88.7 Billion
Growth Factor Increasing numbers of athletes aspiring to reach the world cup or Olympic level competition has led to an increase in coach demand across a broad range of sports, which has in turn led to the development of more efficient training tools & technology.
Opportunity With SMEs increasingly taking advantage of new technologies for coaching and increasing attention to long-term performance, the coaching software industry provides an opportunity to grow further at a rapid pace.
Key Trends Growth of IoT technologies and low-code developments post-pandemic era to further stimulate the global sales coaching software market in the coming years.

Sales Engagement Software Market:

Attributes Sales Engagement Software Market
CAGR (2022 to 2032) 14.9%
Market Value (2032) US$ 29.6 Billion
Growth Factor As the real-time analytics market grows, it is leading to a growth in Sales Engagement Platforms.
Opportunity The need to improve internal processes, combined with sales efforts to scale with advanced technology is expected to create opportunities in the market for Sales Enablement Platforms.
Key Trends Cloud-based solutions and real-time customer data are driving growth in the sales engagement software market. Sales engagement software is also being driven by increased competitive pressure and better customer experience. In addition, the increasing popularity of mobile devices and the rise of social media platforms are expected to push the market in a positive direction during the forecast period.

Sales Enablement Platform Market:

Attributes Sales Enablement Platform Market
CAGR (2022 to 2032) 16.2%
Market Value (2032) US$ 11 Billion
Growth Factor As internal business processes are being improved, advanced technologies are being deployed to scale sales efforts and these factors are expected to drive the growth of the Sales Enablement Platform market.
Opportunity With the implementation of a cloud-based sales enablement platform, businesses are able to concentrate on their core competencies, rather than IT processes, rather than spending time on IT infrastructure which will provide opportunities to the end-users in the market.
Key Trends IT and telecom enterprises use sales enablement platforms to stay competitive in the market, change their sales strategy as the industry changes, and adapt to market requirements for future growth.

In addition to automating processes, tracking progress, saving time, and helping salespeople fit training around their hectic schedules, the software can greatly help the sales coaching process. Many sales technology tools can be used to train or coach sales professionals as part of a sales enablement tool suite, despite there being specific tools that tout themselves as sales coaching software. By reinforcing and building skills, representatives can grow individually, and managers can ensure consistent brand messaging and sales processes.

Various market conditions need to be addressed by large companies to respond to different consumer behaviors and varying service variations. This is how companies manage their clients' requirements efficiently by utilizing the skills and expertise of their sales executives and domain experts.

An organization can evaluate and improve its marketing and sales activities, inside sales performances, and sales representatives' performance with accurate and actionable information received at the right time. In addition, the platform makes it easier to determine the key performance indicators (KPIs) for ranking internal sales or sales representatives as well as the marketing & sales activities being conducted, thus enabling the market to grow.

Category-wise Insights

Which type of Sales Coaching Software is expected to grow the Fastest?

Cloud-based Sales Coaching Software to witness Maximum Uptake

Demand for Cloud-based sales coaching software is predicted to grow at the fastest rate during the forecast period. Cloud-based sales coaching software is projected to grow at a CAGR of 6.1% during the forecast period. The market is in the process of integrating new technologies to keep track of all the activities associated with all the sales that are being carried out. The market is adding AI and cloud-based sales coaching software into its product offering.

Cloud-based coaching software empowers coaches with the ability to manage clients' data in a centralized location, from client training plans to training histories, and much more. Clients can also receive automated updates on their performance via emails or text messages. To offer highly personalized care management strategies, a host of companies have integrated machine learning algorithms. The market is also growing in part since companies are delivering real-time information via online channels, including smartphones and tablets.

By Application, which Sales Coaching Software Category will be the Star Performer?

Large Enterprises to be the Primary Application Area for Sales Coaching Software

Based on application, the large enterprise segment is projected to have the largest market share during the forecast period. It is anticipated that the market will increase at a 5.8% CAGR during the forecast period.

As part of the continuous training provided by sales coaching software, multiple features such as exclusive feedback from observers, upsell/close opportunities, and evidence-based conversations are available. Consequently, the industry is growing up along with the prominence of such applications in the market.
Get the data you need at a Fraction of the cost

Personalize your report by choosing insights you need
and save 40%!

Regional Analysis of the Market for Sales Coaching Software

North America to Witness Highest Demand for Sales Coaching Software

As the sales coaching software market is expected to grow, North America is expected to have the largest share of the market during the forecast period. This region is focusing primarily on providing flexible working hours to its employees which ultimately drives these companies to implement coaching tools such as SaaS to grow in the market.

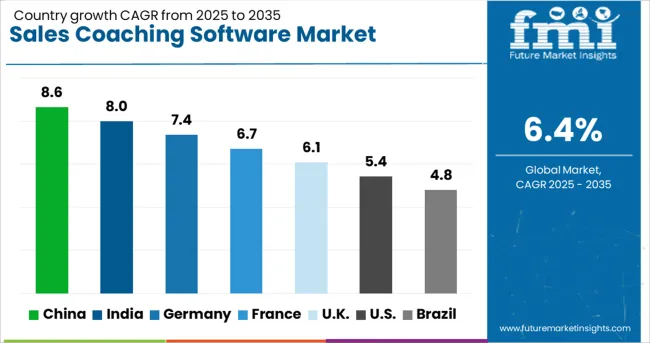
The market for the USA is projected to grow at a value of US$ 31.5 Billion with a CAGR of 6.2% during the forecast period. The USA holds the largest market for tech development and sales businesses in the online market. Growing demand for these businesses has significantly raised market demand for this software the market. A growing regional market is also attributed to significant IT investment, technical advancements, and adoption of new technologies early on in their development. Large, medium, and small companies in the region are investing heavily in sales coaching software to maximize employee skills, and income and maintain market position.

The rapid digitalization of business activities has changed the dynamic of business processes over the last few years. Sales-related activities are streamlined and businesses are seeking effective solutions that can help them close leads faster and better performance to maintain client relations in the market.

Developing New Technologies and Expanding Online Commerce to propel the Asia Pacific Market

The Asia-Pacific market for sales coaching software is expected to grow the fastest during the forecast period, followed by Europe. Asia-Pacific is projected to be the region to see increased demand for sales coaching, due to a growing need for customer service and training.

China accounts for 5.9% of revenue growth in the region. In addition to technological advancements, the expansion of IT firms in many developing nations has created a demand for sales coaching software sales. Growing online e-commerce businesses and retail sales are creating a market for sales coaching software in the market.

Over the forecast period, Japan is projected to achieve a CAGR of 5.2% in 2032. Demand for cloud storage systems and the increase of SMEs in this region are expected to support sales of cloud storage systems in this region. South Korea's market is expected to flourish at a 4.3% CAGR in the coming years. In addition, sales coaching software is becoming an increasingly popular tool to ensure customers experience an enhanced level of service, which presents an untapped opportunity for the sales coaching software market.

UK Accounts for a Large Share of SaaS Adoption in the market

With flexible working hours, efficient business management practices, and reduced costs for organizations, the UK region is expected to have the third-largest share of the market over the forecast period. These factors will lead these organizations to adopt coaching software in the market.

The UK sales coaching software market is expected to grow at a compound annual growth rate of 5.4% over the forecast period. In addition, advances in artificial intelligence and the Internet of Things will lead to a greater demand for skill development and evaluation of employee performance in the market.

As the need for better customer services increases, cloud-based storage services and the integration of AI and ML will be of even greater importance. Due to the growing use of cellular devices and improvements in network access, consumers and businesses in the UK have become more reliant on customer-centric businesses that are strengthening the market for sales coaching software.
Competitive Landscape of Sales Coaching Software

Through strategic partnerships, manufacturers can increase production and meet consumer demand, increasing both their revenues and market share. The introduction of new products and technologies will allow end-users to reap the benefits of new technologies. Increasing the company's production capacity is one of the potential benefits of a strategic partnership.

  • In August 2021, Mindtickle raised an additional US$ 100 Million in a Series E round of funding led by SoftBank Vision Fund II, as foreign investors continue to pour money into India's burgeoning tech industry. In this deal, the Pune-based software company became the 20th unicorn of the year, valued at US$ 1.2 Billion. These startups have an estimated worth of more than US$ 1 Billion each.
  • Training and coaching platform Lessonly has been acquired by sales enablement platform Seismic in September 2021. In addition to marketing and sales content, the company will provide sellers with training programs, coaching plans, and practice situations all in one place. Furthermore, a US$ 170 Million Series G funding round was closed in conjunction with this acquisition. Through this round of funding, the company's valuation has been increased to $3 billion.
  • In January 2022, Coaching.com, the premier digital publisher of premium education programs led by globally recognized coaching experts, acquired the World Business and Executive Coach Summit (WBECS). WBECS is the world's foremost learning event for professional coaches, as well as the world's leading education platform for finding, tracking, managing, and evaluating coaches. Combining these teams and companies creates a powerful coaching machine that offers a unique value proposition. Through a powerful technology platform, coaches will be able to manage their practice, access world-class learning content, and be discovered by new individuals and clients.
  • In January 2022, a company called Second Nature, one of the world's leading AI-based sales coaching service providers, announced that it has closed a US $12.5 Million Series A round of funding. Zoom Video Communications, Inc. led the Zoom Apps Fund with signals Venture Capital, StageOne Ventures, and Cardumen Capital. It has been reported that the total amount raised by the firm for its Series A has now reached US$ 15.5 Million.
  • In February 2022, Perceptyx, a pioneer in AI-powered leadership development, acquired Cultivate, the leading employee listening, and people analytics platform. As a result of the agreement, Perceptyx's active listening and feedback platform will be combined with Cultivate's leading digital coaching and passive listening products, creating a valuable employee experience that closes the gap between signal and action.

By Key Players

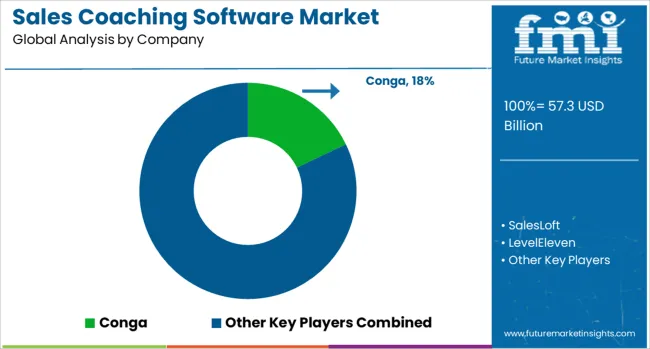
  • Conga
  • SalesLoft
  • LevelEleven
  • Brainshark
  • Chorus.ai
  • Lessonly
  • Chorusai
  • MindTickle
  • Showpad Coach
  • Outreach
  • Lessonly
  • ExecVision

Key Segments Covered in the Sales Coaching Software Market Study

By Type:

  • Cloud-based
  • Web-based

By Application:

  • Large Enterprises
  • SMEs

By Region:

  • North America
  • Europe
  • Asia Pacific
  • Middle East and Africa
  • Latin America

Frequently Asked Questions

What is the growth outlook for the sales coaching software market?

The sales coaching software market is expected to grow at a steady CAGR of 6.4% over the forecast period

What was the size of the sales coaching software market size in 2021?

The global market for sales coaching software was valued at US$ 43.9 Billion in 2021.

What application type is the most valuable in the sales coaching software market?

Large Enterprises are projected to have the highest market with a CAGR of 5.8% during the forecast period.

What region dominates the global sales coaching software market?

USA leads the global sales coaching software market with a CAGR of 6.2% during the forecast period.

What will be the market size of sales coaching software by 2032?

The market for sales coaching software is expected to grow by nearly US$ 47.6 Billion by 2032.

Which top type model is forecast to drive market growth during the forecast period?

The cloud based sales coaching software is expected to reach a CAGR of 6.1% during the forecast period.

What is the estimated market value of the China Market?

China is expected to garner US$ 6.3 billion while expanding at a 5.9% CAGR from 2022 to 2032.

Table of Content

1. Executive Summary | Sales Coaching Software Market

    1.1. Global Market Outlook

    1.2. Summary of Statistics

    1.3. Key Market Characteristics & Attributes

    1.4. FMI Analysis and Recommendations

2. Market Overview

    2.1. Market Coverage / Taxonomy

    2.2. Market Definition / Scope / Limitations

3. Market Risks and Trends Assessment

    3.1. Risk Assessment

        3.1.1. COVID-19 Crisis and Impact on Demand

        3.1.2. COVID-19 Impact Benchmark with Previous Crisis

        3.1.3. Impact on Market Value (US$ Million)

        3.1.4. Assessment by Key Countries

        3.1.5. Assessment by Key Market Segments

        3.1.6. Action Points and Recommendation for Suppliers

    3.2. Key Trends Impacting the Market

    3.3. Formulation and Product Development Trends

4. Market Background and Foundation Data Points

    4.1. Global Market (US$ Million)

    4.2. Market Opportunity Assessment (US$ Million)

        4.2.1. Total Available Market

        4.2.2. Serviceable Addressable Market

        4.2.3. Serviceable Obtainable Market

    4.3. Market Scenario Forecast

        4.3.1. Demand in Optimistic Scenario

        4.3.2. Demand in Likely Scenario

        4.3.3. Demand in Conservative Scenario

    4.4. Investment Feasibility Analysis

        4.4.1. Investment in Established Markets

            4.4.1.1. In Short Term

            4.4.1.2. In Long Term

        4.4.2. Investment in Emerging Markets

            4.4.2.1. In Short Term

            4.4.2.2. In Long Term

    4.5. Forecast Factors - Relevance & Impact

        4.5.1. Top Companies Historical Growth

        4.5.2. Global Market Growth

        4.5.3. Adoption Rate, By Country

    4.6. Market Dynamics

        4.6.1. Market Driving Factors and Impact Assessment

        4.6.2. Prominent Market Challenges and Impact Assessment

        4.6.3. Market Opportunities

        4.6.4. Prominent Trends in the Global Market & Their Impact Assessment

5. Key Success Factors

    5.1. Manufacturers’ Focus on Low Penetration High Growth Markets

    5.2. Banking on with Segments High Incremental Opportunity

    5.3. Peer Benchmarking

6. Global Market Demand Analysis 2015 to 2021 and Forecast, 2022 to 2032

    6.1. Historical Market Analysis, 2015 to 2021

    6.2. Current and Future Market Projections, 2022 to 2032

    6.3. Y-o-Y Growth Trend Analysis

7. Global Market Value Analysis 2015 to 2021 and Forecast, 2022 to 2032

    7.1. Historical Market Value (US$ Million) Analysis, 2015 to 2021

    7.2. Current and Future Market Value (US$ Million) Projections, 2022 to 2032

        7.2.1. Y-o-Y Growth Trend Analysis

        7.2.2. Absolute $ Opportunity Analysis

8. Global Market Analysis 2015 to 2021 and Forecast 2022 to 2032, By Type

    8.1. Introduction / Key Findings

    8.2. Historical Market Size (US$ Million) Analysis By Type, 2015 to 2021

    8.3. Current and Future Market Size (US$ Million) Analysis and Forecast By Type, 2022 to 2032

        8.3.1. Cloud Based

        8.3.2. Web-Based

    8.4. Market Attractiveness Analysis By Type

9. Global Market Analysis 2015 to 2021 and Forecast 2022 to 2032, By Application

    9.1. Introduction / Key Findings

    9.2. Historical Market Size (US$ Million) Analysis By Application, 2015 to 2021

    9.3. Current and Future Market Size (US$ Million) Analysis and Forecast By Application, 2022 to 2032

        9.3.1. Large Enterprises

        9.3.2. SMEs

    9.4. Market Attractiveness Analysis By Application

10. Global Market Analysis 2015 to 2021 and Forecast 2022 to 2032, By Region

    10.1. Introduction

    10.2. Historical Market Size (US$ Million) Analysis By Region, 2015 to 2021

    10.3. Current Market Size (US$ Million) & Analysis and Forecast By Region, 2022 to 2032

        10.3.1. North America

        10.3.2. Latin America

        10.3.3. Europe

        10.3.4. Asia Pacific

        10.3.5. Middle East and Africa (MEA)

    10.4. Market Attractiveness Analysis By Region

11. North America Market Analysis 2015 to 2021 and Forecast 2022 to 2032

    11.1. Introduction

    11.2. Pricing Analysis

    11.3. Historical Market Value (US$ Million) Trend Analysis By Market Taxonomy, 2015 to 2021

    11.4. Market Value (US$ Million) & Forecast By Market Taxonomy, 2022 to 2032

        11.4.1. By Country

            11.4.1.1. United States of America

            11.4.1.2. Canada

            11.4.1.3. Rest of North America

        11.4.2. By Type

        11.4.3. By Application

    11.5. Market Attractiveness Analysis

        11.5.1. By Country

        11.5.2. By Type

        11.5.3. By Application

12. Latin America Market Analysis 2015 to 2021 and Forecast 2022 to 2032

    12.1. Introduction

    12.2. Pricing Analysis

    12.3. Historical Market Value (US$ Million) Trend Analysis By Market Taxonomy, 2015 to 2021

    12.4. Market Value (US$ Million) & Forecast By Market Taxonomy, 2022 to 2032

        12.4.1. By Country

            12.4.1.1. Brazil

            12.4.1.2. Mexico

            12.4.1.3. Rest of Latin America

        12.4.2. By Type

        12.4.3. By Application

    12.5. Market Attractiveness Analysis

        12.5.1. By Country

        12.5.2. By Type

        12.5.3. By Application

13. Europe Market Analysis 2015 to 2021 and Forecast 2022 to 2032

    13.1. Introduction

    13.2. Pricing Analysis

    13.3. Historical Market Value (US$ Million) Trend Analysis By Market Taxonomy, 2015 to 2021

    13.4. Market Value (US$ Million) & Forecast By Market Taxonomy, 2022 to 2032

        13.4.1. By Country

            13.4.1.1. Germany

            13.4.1.2. France

            13.4.1.3. United Kingdom

            13.4.1.4. Italy

            13.4.1.5. Benelux

            13.4.1.6. Nordic Countries

            13.4.1.7. Rest of Europe

        13.4.2. By Type

        13.4.3. By Application

    13.5. Market Attractiveness Analysis

        13.5.1. By Country

        13.5.2. By Type

        13.5.3. By Application

14. Asia Pacific Market Analysis 2015 to 2021 and Forecast 2022 to 2032

    14.1. Introduction

    14.2. Pricing Analysis

    14.3. Historical Market Value (US$ Million) Trend Analysis By Market Taxonomy, 2015 to 2021

    14.4. Market Value (US$ Million) & Forecast By Market Taxonomy, 2022 to 2032

        14.4.1. By Country

            14.4.1.1. China

            14.4.1.2. Japan

            14.4.1.3. South Korea

            14.4.1.4. Rest of Asia Pacific

        14.4.2. By Type

        14.4.3. By Application

    14.5. Market Attractiveness Analysis

        14.5.1. By Country

        14.5.2. By Type

        14.5.3. By Application

15. Middle East and Africa Market Analysis 2015 to 2021 and Forecast 2022 to 2032

    15.1. Introduction

    15.2. Pricing Analysis

    15.3. Historical Market Value (US$ Million) Trend Analysis By Market Taxonomy, 2015 to 2021

    15.4. Market Value (US$ Million) & Forecast By Market Taxonomy, 2022 to 2032

        15.4.1. By Country

            15.4.1.1. GCC Countries

            15.4.1.2. South Africa

            15.4.1.3. Turkey

            15.4.1.4. Rest of Middle East and Africa

        15.4.2. By Type

        15.4.3. By Application

    15.5. Market Attractiveness Analysis

        15.5.1. By Country

        15.5.2. By Type

        15.5.3. By Application

16. Key Countries Market Analysis 2015 to 2021 and Forecast 2022 to 2032

    16.1. Introduction

        16.1.1. Market Value Proportion Analysis, By Key Countries

        16.1.2. Global Vs. Country Growth Comparison

    16.2. US Market Analysis

        16.2.1. Value Proportion Analysis by Market Taxonomy

        16.2.2. Value & Analysis and Forecast by Market Taxonomy, 2015 to 2032

            16.2.2.1. By Type

            16.2.2.2. By Application

    16.3. Canada Market Analysis

        16.3.1. Value Proportion Analysis by Market Taxonomy

        16.3.2. Value & Analysis and Forecast by Market Taxonomy, 2015 to 2032

            16.3.2.1. By Type

            16.3.2.2. By Application

    16.4. Mexico Market Analysis

        16.4.1. Value Proportion Analysis by Market Taxonomy

        16.4.2. Value & Analysis and Forecast by Market Taxonomy, 2015 to 2032

            16.4.2.1. By Type

            16.4.2.2. By Application

    16.5. Brazil Market Analysis

        16.5.1. Value Proportion Analysis by Market Taxonomy

        16.5.2. Value & Analysis and Forecast by Market Taxonomy, 2015 to 2032

            16.5.2.1. By Type

            16.5.2.2. By Application

    16.6. Germany Market Analysis

        16.6.1. Value Proportion Analysis by Market Taxonomy

        16.6.2. Value & Analysis and Forecast by Market Taxonomy, 2015 to 2032

            16.6.2.1. By Type

            16.6.2.2. By Application

    16.7. France Market Analysis

        16.7.1. Value Proportion Analysis by Market Taxonomy

        16.7.2. Value & Analysis and Forecast by Market Taxonomy, 2015 to 2032

            16.7.2.1. By Type

            16.7.2.2. By Application

    16.8. Italy Market Analysis

        16.8.1. Value Proportion Analysis by Market Taxonomy

        16.8.2. Value & Analysis and Forecast by Market Taxonomy, 2015 to 2032

            16.8.2.1. By Type

            16.8.2.2. By Application

    16.9. BENELUX Market Analysis

        16.9.1. Value Proportion Analysis by Market Taxonomy

        16.9.2. Value & Analysis and Forecast by Market Taxonomy, 2015 to 2032

            16.9.2.1. By Type

            16.9.2.2. By Application

    16.10. UK Market Analysis

        16.10.1. Value Proportion Analysis by Market Taxonomy

        16.10.2. Value & Analysis and Forecast by Market Taxonomy, 2015 to 2032

            16.10.2.1. By Type

            16.10.2.2. By Application

    16.11. Nordic Countries Market Analysis

        16.11.1. Value Proportion Analysis by Market Taxonomy

        16.11.2. Value & Analysis and Forecast by Market Taxonomy, 2015 to 2032

            16.11.2.1. By Type

            16.11.2.2. By Application

    16.12. China Market Analysis

        16.12.1. Value Proportion Analysis by Market Taxonomy

        16.12.2. Value & Analysis and Forecast by Market Taxonomy, 2015 to 2032

            16.12.2.1. By Type

            16.12.2.2. By Application

    16.13. Japan Market Analysis

        16.13.1. Value Proportion Analysis by Market Taxonomy

        16.13.2. Value & Analysis and Forecast by Market Taxonomy, 2015 to 2032

            16.13.2.1. By Type

            16.13.2.2. By Application

    16.14. South Korea Market Analysis

        16.14.1. Value Proportion Analysis by Market Taxonomy

        16.14.2. Value & Analysis and Forecast by Market Taxonomy, 2015 to 2032

            16.14.2.1. By Type

            16.14.2.2. By Application

    16.15. GCC Countries Market Analysis

        16.15.1. Value Proportion Analysis by Market Taxonomy

        16.15.2. Value & Analysis and Forecast by Market Taxonomy, 2015 to 2032

            16.15.2.1. By Type

            16.15.2.2. By Application

    16.16. South Africa Market Analysis

        16.16.1. Value Proportion Analysis by Market Taxonomy

        16.16.2. Value & Analysis and Forecast by Market Taxonomy, 2015 to 2032

            16.16.2.1. By Type

            16.16.2.2. By Application

    16.17. Turkey Market Analysis

        16.17.1. Value Proportion Analysis by Market Taxonomy

        16.17.2. Value & Analysis and Forecast by Market Taxonomy, 2015 to 2032

            16.17.2.1. By Type

            16.17.2.2. By Application

        16.17.3. Competition Landscape and Player Concentration in the Country

17. Market Structure Analysis

    17.1. Market Analysis by Tier of Companies

    17.2. Market Concentration

    17.3. Market Share Analysis of Top Players

    17.4. Market Presence Analysis

        17.4.1. By Regional Footprint of Players

        17.4.2. Product Footprint by Players

18. Competition Analysis

    18.1. Competition Dashboard

    18.2. Competition Benchmarking

    18.3. Competition Deep Dive

        18.3.1. Conga

            18.3.1.1. Overview

            18.3.1.2. Product Portfolio

            18.3.1.3. Sales Footprint

            18.3.1.4. Strategy Overview

        18.3.2. SalesLoft

            18.3.2.1. Overview

            18.3.2.2. Product Portfolio

            18.3.2.3. Sales Footprint

            18.3.2.4. Strategy Overview

        18.3.3. LevelEleven

            18.3.3.1. Overview

            18.3.3.2. Product Portfolio

            18.3.3.3. Sales Footprint

            18.3.3.4. Strategy Overview

        18.3.4. Brainshark

            18.3.4.1. Overview

            18.3.4.2. Product Portfolio

            18.3.4.3. Sales Footprint

            18.3.4.4. Strategy Overview

        18.3.5. Chorus.ai

            18.3.5.1. Overview

            18.3.5.2. Product Portfolio

            18.3.5.3. Sales Footprint

            18.3.5.4. Strategy Overview

        18.3.6. Lessonly

            18.3.6.1. Overview

            18.3.6.2. Product Portfolio

            18.3.6.3. Sales Footprint

            18.3.6.4. Strategy Overview

        18.3.7. Chorusai

            18.3.7.1. Overview

            18.3.7.2. Product Portfolio

            18.3.7.3. Sales Footprint

            18.3.7.4. Strategy Overview

        18.3.8. MindTickle

            18.3.8.1. Overview

            18.3.8.2. Product Portfolio

            18.3.8.3. Sales Footprint

            18.3.8.4. Strategy Overview

        18.3.9. Showpad Coach

            18.3.9.1. Overview

            18.3.9.2. Product Portfolio

            18.3.9.3. Sales Footprint

            18.3.9.4. Strategy Overview

        18.3.10. Outreach

            18.3.10.1. Overview

            18.3.10.2. Product Portfolio

            18.3.10.3. Sales Footprint

            18.3.10.4. Strategy Overview

        18.3.11. Lessonly

            18.3.11.1. Overview

            18.3.11.2. Product Portfolio

            18.3.11.3. Sales Footprint

            18.3.11.4. Strategy Overview

        18.3.12. ExecVision

            18.3.12.1. Overview

            18.3.12.2. Product Portfolio

            18.3.12.3. Sales Footprint

            18.3.12.4. Strategy Overview

19. Assumptions and Acronyms Used

20. Research Methodology

List of Tables

Table 1: Global Market Value (US$ Million), By Type, 2015 to 2021

Table 2: Global Market Value (US$ Million), By Type, 2022 to 2032

Table 3: Global Market Value (US$ Million), By Application, 2015 to 2021

Table 4: Global Market Value (US$ Million), By Application, 2022 to 2032

Table 5: Global Market, By Region, 2015 to 2021

Table 6: Global Market, By Region, 2022 to 2032

Table 7: North America Market Value (US$ Million), By Type, 2015 to 2021

Table 8: North America Market Value (US$ Million), By Type, 2022 to 2032

Table 9: North America Market Value (US$ Million), By Application, 2015 to 2021

Table 10: North America Market Value (US$ Million), By Application, 2022 to 2032

Table 11: North America Market, By Country, 2015 to 2021

Table 12: North America Market, By Country, 2022 to 2032

Table 13: Latin America Market Value (US$ Million), By Type, 2015 to 2021

Table 14: Latin America Market Value (US$ Million), By Type, 2022 to 2032

Table 15: Latin America Market Value (US$ Million), By Application, 2015 to 2021

Table 16: Latin America Market Value (US$ Million), By Application, 2022 to 2032

Table 17: Latin America Market, By Country, 2015 to 2021

Table 18: Latin America Market, By Country, 2022 to 2032

Table 19: Europe Market Value (US$ Million), By Type, 2015 to 2021

Table 20: Europe Market Value (US$ Million), By Type, 2022 to 2032

Table 21: Europe Market Value (US$ Million), By Application, 2015 to 2021

Table 22: Europe Market Value (US$ Million), By Application, 2022 to 2032

Table 23: Europe Market, By Country, 2015 to 2021

Table 24: Europe Market, By Country, 2022 to 2032

Table 25: Asia Pacific Market Value (US$ Million), By Type, 2015 to 2021

Table 26: Asia Pacific Market Value (US$ Million), By Type, 2022 to 2032

Table 27: Asia Pacific Market Value (US$ Million), By Application, 2015 to 2021

Table 28: Asia Pacific Market Value (US$ Million), By Application, 2022 to 2032

Table 29: Asia Pacific Market, By Country, 2015 to 2021

Table 30: Asia Pacific Market, By Country, 2022 to 2032

Table 31: MEA Market Value (US$ Million), By Type, 2015 to 2021

Table 32: MEA Market Value (US$ Million), By Type, 2022 to 2032

Table 33: MEA Market Value (US$ Million), By Application, 2015 to 2021

Table 34: MEA Market Value (US$ Million), By Application, 2022 to 2032

Table 35: MEA Market, By Country, 2015 to 2021

Table 36: MEA Market, By Country, 2022 to 2032

Table 37: Global Market Incremental $ Opportunity, By Type, 2015 to 2021

Table 38: Global Market Incremental $ Opportunity, By Application, 2022 to 2032

Table 39: Global Market Incremental $ Opportunity, By Region, 2022 to 2032

Table 40: North America Market Incremental $ Opportunity, By Type, 2015 to 2021

Table 41: North America Market Incremental $ Opportunity, By Application, 2022 to 2032

Table 42: North America Market Incremental $ Opportunity, By Country, 2022 to 2032

Table 43: Latin America Market Incremental $ Opportunity, By Type, 2015 to 2021

Table 44: Latin America Market Incremental $ Opportunity, By Application, 2022 to 2032

Table 45: Latin America Market Incremental $ Opportunity, By Country, 2022 to 2032

Table 46: Europe Market Incremental $ Opportunity, By Type, 2015 to 2021

Table 47: Europe Market Incremental $ Opportunity, By Application, 2022 to 2032

Table 48: Europe Market Incremental $ Opportunity, By Country, 2022 to 2032

Table 49: Asia Pacific Market Incremental $ Opportunity, By Type, 2015 to 2021

Table 50: Asia Pacific Market Incremental $ Opportunity, By Application, 2022 to 2032

Table 51: Asia Pacific Market Incremental $ Opportunity, By Country, 2022 to 2032

Table 52: MEA Market Incremental $ Opportunity, By Type, 2015 to 2021

Table 53: MEA Market Incremental $ Opportunity, By Application, 2022 to 2032

Table 54: MEA Market Incremental $ Opportunity, By Country, 2022 to 2032

List of Charts

Figure 1: Global Market Value (US$ Million) and Year-on-Year Growth, 2015 to 2032

Figure 2: Global Market Absolute $ Historical Gain (2015 to 2021) and Opportunity (2022 to 2032), US$ Million

Figure 3: Global Market Share, By Type, 2022 & 2032

Figure 4: Global Market Y-o-Y Growth Projections, By Type - 2022 to 2032

Figure 5: Global Market Attractiveness Index, By Type - 2022 to 2032

Figure 6: Global Market Share, By Application, 2022 & 2032

Figure 7: Global Market Y-o-Y Growth Projections, By Application - 2022 to 2032

Figure 8: Global Market Attractiveness Index, By Application - 2022 to 2032

Figure 9: Global Market Share, By Region, 2022 & 2032

Figure 10: Global Market Y-o-Y Growth Projections, By Region - 2022 to 2032

Figure 11: Global Market Attractiveness Index, By Region - 2022 to 2032

Figure 12: North America Market Value (US$ Million) and Year-on-Year Growth, 2015 to 2032

Figure 13: North America Market Absolute $ Opportunity Historical (2015 to 2021) and Forecast Period (2022 to 2032), US$ Million

Figure 14: North America Market Share, By Type, 2022 & 2032

Figure 15: North America Market Y-o-Y Growth Projections, By Type - 2022 to 2032

Figure 16: North America Market Attractiveness Index, By Type - 2022 to 2032

Figure 17: North America Market Share, By Application, 2022 & 2032

Figure 18: North America Market Y-o-Y Growth Projections, By Application - 2022 to 2032

Figure 19: North America Market Attractiveness Index, By Application - 2022 to 2032

Figure 20: North America Market Share, By Country, 2022 & 2032

Figure 21: North America Market Y-o-Y Growth Projections, By Country - 2022 to 2032

Figure 22: North America Market Attractiveness Index, By Country - 2022 to 2032

Figure 23: Latin America Market Value (US$ Million) and Year-on-Year Growth, 2015 to 2032

Figure 24: Latin America Market Absolute $ Opportunity Historical (2015 to 2021) and Forecast Period (2022 to 2032), US$ Million

Figure 25: Latin America Market Share, By Type, 2022 & 2032

Figure 26: Latin America Market Y-o-Y Growth Projections, By Type - 2022 to 2032

Figure 27: Latin America Market Attractiveness Index, By Type - 2022 to 2032

Figure 28: Latin America Market Share, By Application, 2022 & 2032

Figure 29: Latin America Market Y-o-Y Growth Projections, By Application - 2022 to 2032

Figure 30: Latin America Market Attractiveness Index, By Application - 2022 to 2032

Figure 31: Latin America Market Share, By Country, 2022 & 2032

Figure 32: Latin America Market Y-o-Y Growth Projections, By Country - 2022 to 2032

Figure 33: Latin America Market Attractiveness Index, By Country - 2022 to 2032

Figure 34: Europe Market Value (US$ Million) and Year-on-Year Growth, 2015 to 2032

Figure 35: Europe Market Absolute $ Opportunity Historical (2015 to 2021) and Forecast Period (2022 to 2032), US$ Million

Figure 36: Europe Market Share, By Type, 2022 & 2032

Figure 37: Europe Market Y-o-Y Growth Projections, By Type - 2022 to 2032

Figure 38: Europe Market Attractiveness Index, By Type - 2022 to 2032

Figure 39: Europe Market Share, By Application, 2022 & 2032

Figure 40: Europe Market Y-o-Y Growth Projections, By Application - 2022 to 2032

Figure 41: Europe Market Attractiveness Index, By Application - 2022 to 2032

Figure 42: Europe Market Share, By Country, 2022 & 2032

Figure 43: Europe Market Y-o-Y Growth Projections, By Country - 2022 to 2032

Figure 44: Europe Market Attractiveness Index, By Country - 2022 to 2032

Figure 45: MEA Market Value (US$ Million) and Year-on-Year Growth, 2015 to 2032

Figure 46: MEA Market Absolute $ Opportunity Historical (2015 to 2021) and Forecast Period (2022 to 2032), US$ Million

Figure 47: MEA Market Share, By Type, 2022 & 2032

Figure 48: MEA Market Y-o-Y Growth Projections, By Type - 2022 to 2032

Figure 49: MEA Market Attractiveness Index, By Type - 2022 to 2032

Figure 50: MEA Market Share, By Application, 2022 & 2032

Figure 51: MEA Market Y-o-Y Growth Projections, By Application - 2022 to 2032

Figure 52: MEA Market Attractiveness Index, By Application - 2022 to 2032

Figure 53: MEA Market Share, By Country, 2022 & 2032

Figure 54: MEA Market Y-o-Y Growth Projections, By Country - 2022 to 2032

Figure 55: MEA Market Attractiveness Index, By Country - 2022 to 2032

Figure 56: Asia Pacific Market Value (US$ Million) and Year-on-Year Growth, 2015 to 2032

Figure 57: Asia Pacific Market Absolute $ Opportunity Historical (2015 to 2021) and Forecast Period (2022 to 2032), US$ Million

Figure 58: Asia Pacific Market Share, By Type, 2022 & 2032

Figure 59: Asia Pacific Market Y-o-Y Growth Projections, By Type - 2022 to 2032

Figure 60: Asia Pacific Market Attractiveness Index, By Type - 2022 to 2032

Figure 61: Asia Pacific Market Share, By Application, 2022 & 2032

Figure 62: Asia Pacific Market Y-o-Y Growth Projections, By Application - 2022 to 2032

Figure 63: Asia Pacific Market Attractiveness Index, By Application - 2022 to 2032

Figure 64: Asia Pacific Market Share, By Country, 2022 & 2032

Figure 65: Asia Pacific Market Y-o-Y Growth Projections, By Country - 2022 to 2032

Figure 66: Asia Pacific Market Attractiveness Index, By Country - 2022 to 2032

Figure 67: USA Market Value (US$ Million) and Forecast, 2022 to 2032

Figure 68: USA Market Share, By Type, 2021

Figure 69: USA Market Share, By Application, 2021

Figure 70: Canada Market Value (US$ Million) and Forecast, 2022 to 2032

Figure 71: Canada Market Share, By Type, 2021

Figure 72: Canada Market Share, By Application, 2021

Figure 73: Brazil Market Value (US$ Million) and Forecast, 2022 to 2032

Figure 74: Brazil Market Share, By Type, 2021

Figure 75: Brazil Market Share, By Application, 2021

Figure 76: Mexico Market Value (US$ Million) and Forecast, 2022 to 2032

Figure 77: Mexico Market Share, By Type, 2021

Figure 78: Mexico Market Share, By Application, 2021

Figure 79: Germany Market Value (US$ Million) and Forecast, 2022 to 2032

Figure 80: Germany Market Share, By Type, 2021

Figure 81: Germany Market Share, By Application, 2021

Figure 82: UK Market Value (US$ Million) and Forecast, 2022 to 2032

Figure 83: UK Market Share, By Type, 2021

Figure 84: UK Market Share, By Application, 2021

Figure 85: France Market Value (US$ Million) and Forecast, 2022 to 2032

Figure 86: France Market Share, By Type, 2021

Figure 87: France Market Share, By Application, 2021

Figure 88: Italy Market Value (US$ Million) and Forecast, 2022 to 2032

Figure 89: Italy Market Share, By Type, 2021

Figure 90: Italy Market Share, By Application, 2021

Figure 91: BENELUX Market Value (US$ Million) and Forecast, 2022 to 2032

Figure 92: BENELUX Market Share, By Type, 2021

Figure 93: BENELUX Market Share, By Application, 2021

Figure 94: Nordic Countries Market Value (US$ Million) and Forecast, 2022 to 2032

Figure 95: Nordic Countries Market Share, By Type, 2021

Figure 96: Nordic Countries Market Share, By Application, 2021

Figure 97: China Market Value (US$ Million) and Forecast, 2022 to 2032

Figure 98: China Market Share, By Type, 2021

Figure 99: China Market Share, By Application, 2021

Figure 100: Japan Market Value (US$ Million) and Forecast, 2022 to 2032

Figure 101: Japan Market Share, By Type, 2021

Figure 102: Japan Market Share, By Application, 2021

Figure 103: South Korea Market Value (US$ Million) and Forecast, 2022 to 2032

Figure 104: South Korea Market Share, By Type, 2021

Figure 105: South Korea Market Share, By Application, 2021

Figure 106: GCC Countries Market Value (US$ Million) and Forecast, 2022 to 2032

Figure 107: GCC Countries Market Share, By Type, 2021

Figure 108: GCC Countries Market Share, By Application, 2021

Figure 109: South Africa Market Value (US$ Million) and Forecast, 2022 to 2032

Figure 110: South Africa Market Share, By Type, 2021

Figure 111: South Africa Market Share, By Application, 2021

Figure 112: Turkey Market Value (US$ Million) and Forecast, 2022 to 2032

Figure 113: Turkey Market Share, By Type, 2021

Figure 114: Turkey Market Share, By Application, 2021

Recommendations

Technology

Event Management Software Market

Published : July 2023

Technology

Metrology Software Market

Published : June 2023

Technology

Ecommerce Software And Platform Market

Published : December 2022

Technology

MEA Enterprise Software Market

Published : September 2022

Explore Technology Insights

View Reports

Sales Coaching Software Market