Sales Compensation Software Market Size and Share Forecast Outlook 2025 to 2035

The Sales Compensation Software Market is estimated to be valued at USD 3473.4 million in 2025 and is projected to reach USD 8927.5 million by 2035, registering a compound annual growth rate (CAGR) of 9.9% over the forecast period.
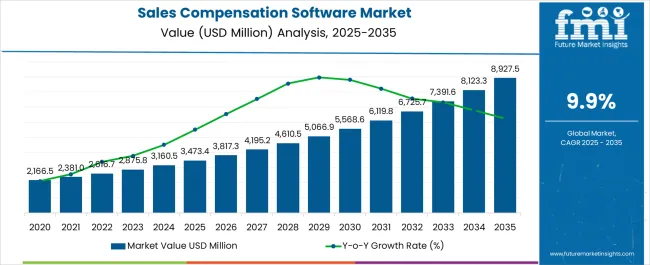
Quick Stats for Sales Compensation Software Market

  • Sales Compensation Software Market Industry Value (2025): USD 3473.4 million
  • Sales Compensation Software Market Forecast Value (2035): USD 8927.5 million
  • Sales Compensation Software Market Forecast CAGR: 9.9%
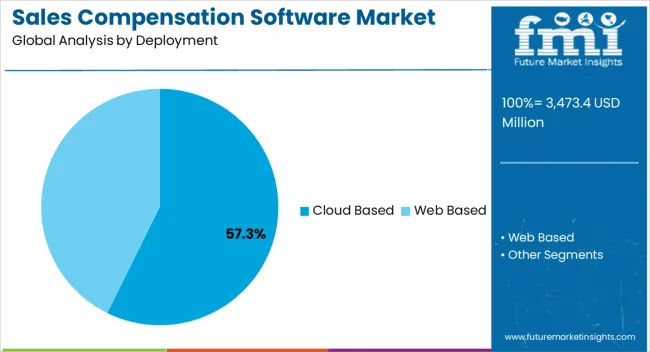
  • Leading Segment in Sales Compensation Software Market in 2025: Cloud Based (57.3%)
  • Key Growth Region in Sales Compensation Software Market: North America, Asia-Pacific, Europe
  • Top Key Players in Sales Compensation Software Market: SAP, Oracle, Performio, IconiSales Compensation Software, Optymyze, Xactly Corp., NICE Systems Ltd., Apttus, NetSuite, Commissionly.io, ZS Associates, IBM, CellarStone, Inc., Anaplan, QuotaPath Inc., CaptivateIQ, Inc., Atmax Technologies

Sales Compensation Software Market Market Value Analysis

Metric Value
Sales Compensation Software Market Estimated Value in (2025 E) USD 3473.4 million
Sales Compensation Software Market Forecast Value in (2035 F) USD 8927.5 million
Forecast CAGR (2025 to 2035) 9.9%

Rationale for Segmental Growth in the Sales Compensation Software Market

The sales compensation software market is expanding steadily as enterprises seek efficient ways to align incentives with performance, reduce manual errors, and improve transparency in compensation management. Increasing demand for automation in sales operations, combined with the need for data driven decision making, is fostering strong adoption across industries.

Cloud based solutions are further enabling scalability, remote accessibility, and seamless integration with existing CRM and ERP systems, supporting hybrid and distributed workforce models. Regulatory requirements around compensation compliance and growing pressure for auditability are also driving investments in advanced platforms.

As businesses prioritize workforce motivation and productivity, the market outlook remains positive with significant opportunities emerging from the integration of AI, predictive analytics, and advanced reporting features.
Segmental Analysis

Insights into the Cloud Based Deployment Segment

Sales Compensation Software Market Analysis By Deployment

The cloud based deployment segment is anticipated to represent 57.30% of market revenue by 2025 within the deployment category, making it the dominant segment. Growth has been fueled by the increasing need for cost effective, scalable, and easily deployable solutions that support dynamic sales teams.

Cloud platforms enable real time updates, remote accessibility, and integration with enterprise applications, enhancing efficiency and user adoption. Security advancements and improved data privacy protocols have also encouraged organizations to transition from on premise models to cloud environments.

As enterprises expand globally and adopt flexible working structures, cloud based solutions are expected to maintain their leadership position within the deployment landscape.
Insights into the Large Enterprises Application Segment

Sales Compensation Software Market Analysis By Application

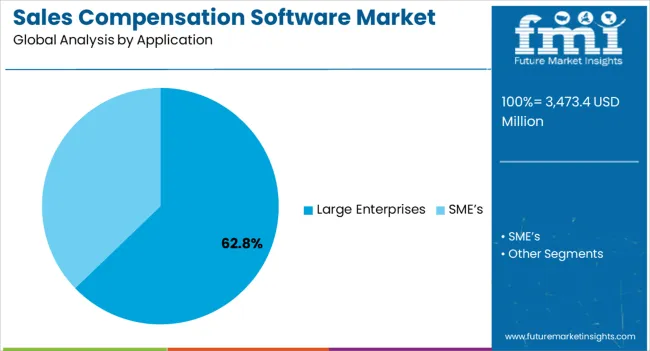
The large enterprises segment is projected to hold 62.80% of overall market revenue by 2025 under the application category, positioning it as the leading segment. This dominance is attributed to the complexity of managing extensive sales networks, diverse compensation structures, and multi level performance tracking within larger organizations.

Significant investment capacity has enabled large enterprises to deploy advanced platforms that integrate predictive analytics, AI based insights, and seamless reporting functionalities. Additionally, the drive to enhance workforce satisfaction, reduce compensation disputes, and comply with evolving regulatory standards has reinforced adoption.

As large enterprises continue to focus on operational efficiency and strategic workforce management, this segment remains central to the overall growth of the sales compensation software market.

Comparison of Historical 2020 to 2025 vs Forecast Outlook 2025 to 2035

The global market for sales compensation software marked a CAGR of 7.8% over the last historical period. In 2025, the global market size of sales compensation services was valued at USD 2,655.4 million, estimated to reach a valuation of USD 2,875.8 million in 2025. Organizations can automate and streamline the creation of sales incentive schemes and commission calculations with the use of sales compensation software. Additionally, the program provides a mechanism for sales teams to keep track of their short-term incentives, earned commissions, and quota attainment.

Reps are motivated by knowing their future earnings because they may see their potential commissions based on existing deals. Many companies are using spreadsheets to keep track of their commission records. The limited efficiency of Excel is leading to problems like data repeating, unclear commission agreements, and overpayments, which demotivate sales reps and affect the sales of the enterprises. As a result, many enterprises are considering implementing sale compensation software as they can solve all the limitations of spreadsheets, eliminate errors leading to price erosion, and make enterprises deliver efficient sales compensation, which is expected to drive the market in the coming years.

The global sales compensation software industry is predicted to mark a CAGR of 9.9% and sales worth USD 7,413.9 million by the end of 2035. North America is projected to continue to be the significant procurer of sales compensation software throughout the analysis period accounting for over USD 2.6 billion absolute dollar opportunity in the coming 10-year epoch.

Key Drivers Fueling Growth in the Sales Compensation Software Market

The enhancement in technology and increasing automation in industries have increased the adoption of sales compensation software in the industries. Large and small business enterprises are using sale compensation software for managing and keeping records of the accomplishments of the sales rep and formulating and computing compensation plans accordingly to it.

Start-ups are rising as many governments around the world are framing policies and providing incentives to the emergence of start-ups, which has increased the adoption of sales compensation software in the start-ups that are driving the market.

Challenges Restraining the Sales Compensation Software Market

The lack of privacy and data security in cloud-based software and regulations related to data and hosting are expected to restrain the market growth. Numerous cloud-based services include a third–party, and they may give the user's information to others, which is a security threat to is an issue associated with cloud-based software, which is also hindering the growth of the sales compensation software industry.

Regional Insights in the Sales Compensation Software Industry

What is the Sales Compensation Software Market Outlook in North America?

Country/ Region Value Share % (2025)
North America 28.8%
The United States 17.1%

The early adoption of advanced technologies among enterprises is driving the sales compensation software market in North America. The sales compensation market in North America has been estimated to be valued at USD 3473.4 billion in 2025. Higher technology knowledge and awareness among business enterprises are boosting the adoption of sales compensation software in enterprises as they improve operations and performance. The sales compensation software market in North America is forecast to reach a valuation of USD 8927.5 billion by the end of 2035.

How is Sales Compensation Software Market in the Asia Pacific Going to Perform over the Forecast Years?

Countries Forecast CAGR % (2025 to 2035)
India 10.4%
China 8.1%

The sales compensation software market in the Asia Pacific is expected to grow at a substantial pace over the forecast period. The market in the Asia Pacific was valued at more than USD 3473.4 million in 2025. The advancing technologies and the emergence of SMEs are the key factors driving the market in the region. The sales compensation software market in the Asia Pacific is likely to reach a valuation of USD 1.4 billion by the end of 2035.

The sales compensation software industry in China was valued at more than USD 177 million in 2025, making it the second-leading market in the world. The market in China has expected to reach a valuation of USD 454.1 million by the end of the forecast period. The sales compensation software industry in Japan is forecast to reach a valuation of USD 368.8 million by the end of 2035.

How is Europe going to perform over the Forecast Year?

Country/ Region Value
Europe Market Share % (2025) 21.4%
Germany Market Share % (2025) 9.2%
The United Kingdom Forecast CAGR % 9.1%

The sales compensation software industry in Europe is anticipated to grow at a modest rate over the forecast period. The sales compensation software industry in Europe was valued at more than USD 582 million in 2025 and is estimated to reach a valuation of above USD 642 million in 2025. The surging automation in every industry vertical is driving the European market. The sales compensation software market in Europe is forecast to reach a valuation of above USD 1.6 billion by the end of 2035.

The sales compensation software industry in the United Kingdom was valued above USD 110 million in 2025. The market in the United Kingdom is forecast to reach a valuation of USD 266.6 million by the end of 2035. The sales compensation software industry in the United Kingdom is expected to expand with a USD 149.7 million absolute dollar growth opportunity in the coming 10-year epoch.

Country-wise Insights in the Sales Compensation Software Market

How does the United States Continue to Dominate the Sales Compensation Software Market Demand?

The sales compensation software market in the United States was valued at around USD 3473.4 million in 2025 and is estimated to reach a valuation of USD 3473.4 million in 2025. The increasing adoption of sales compensation software among small-sized and medium enterprises is fuelling the expansion of the market in the United States. The United States is also home to several key players in the market, which is boosting the adoption of new versions of software among enterprises at a faster pace. The sales compensation software industry in the United States is forecast to reach a valuation of USD 8927.5 billion by the end of 2035.

Category-wise Insights in the Sales Compensation Software Market

How Sales Compensation Software Applications in Large Enterprises are Driving the Market?

Segment Large Enterprises
Market Share % (2025 to 2035) 65.2%

The surging digitalization and technological advancement have boosted the adoption of sales compensation software in large enterprises. Large enterprises with a high amount of sales data are adopting cloud-based sales compensation software as they reduce the adoption cost that is driving the market in the segment. Revenue generated from large enterprises grew at a CAGR of 10.2% from 2020 to 2025.

How are SMEs going to Perform over the Forecast Years?

The SMEs segment is anticipated to grow at a significant rate over the forecast period. Sales compensation software helps SMEs to formulate commercial strategies according to their incentive scheme, which is effective for the business. As several SMEs is rising, sales compensation software providers are developing software specifically for SMEs which is expected to drive market expansion.

Why has Cloud-based Sales Compensation Software Gained Significant Demand over the Period?

The cloud-based sales compensation software has high demand because they offer multiple plans that are suitable for enterprises according to their size. Using cloud-based software is uncomplicated for the sales management department, which is driving the segment. The cloud-based sales compensation software accounted for a CAGR of 10.6% from 2020 to 2025.
Competitive Landscape of the Sales Compensation Software Market

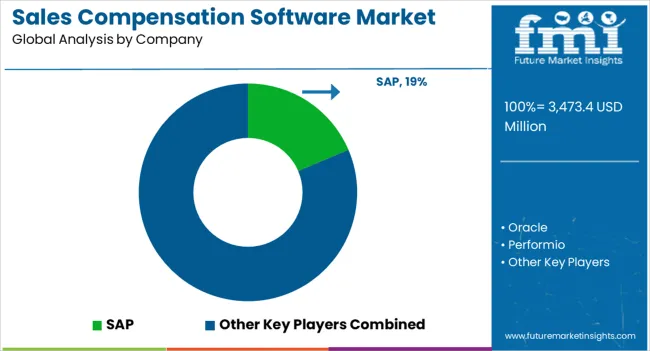
Sales Compensation Software Market Analysis By Company

Sales compensation software providers are mostly active in client win and product launches. The key companies operating in the sales compensation software industry include SAP, Oracle, Performio, IconiSales Compensation Software, Optymyze, Xactly Corp., NICE Systems Ltd., Apttus, NetSuite, Commissionly.io, ZS Associates, IBM, CellarStone, Inc., Anaplan, QuotaPath Inc., CaptivateIQ, Inc., and Atmax Technologies.

Some recent developments by key providers of sales compensation software are as follows:

  • In June 2025, CellarStone Inc. announced that Pearl Design Group had chosen their QCommission sales software to keep track of and payout sale commissions to their sales team.
  • In May 2025, CellarStone Inc. released QCommission Version 12 of the software. The new version is more effective for the calculation process and is easy to integrate with Netsuite and QuickBooks.
  • In May 2025, Oracle announced that its Fusion Cloud Human Capital Management (HCM) is going to deliver payroll support to French enterprises. The recent cloud payroll solution is expected to help enterprises in France to manage compliance, automate workflows and instantly generate payrolls for employees. With the introduction of Oracle France Payroll, Oracle Cloud HCM can provide built-in payroll support in 13 countries.
  • In May 2025, Nokia chose Oracle Fusion Cloud Human Capital Management (HCM) to centralize and change its Human resources system in the cloud with Oracle Fusion Cloud (HCM). Nokia is projected to deploy Oracle Fusion Cloud (HCM) to manage its human resource management, which includes recruitment, compensation, and performance management for companies’ workforce operating in 130 countries.
  • In April 2025, CellarStone Inc. announced that its QCommission software has integrated with MS SQL Server. The QCommission enables fast and efficient data transfer to and from the databases of SQL servers. It also provides an accurate view of the data before and after the filtering process.
  • In November 2024, Performio announced new product functionality, which includes DocuSign integration and aggregate reporting capabilities in their sales compensation software solutions. The new DocuSign integration is expected to help sales reps to view and sign sales incentive plans directly in Performio in a secure way, The new aggregating reporting capabilities are going to enhance the sales and finance team’s ability to combine or group records in reports, enabling more details of sales actuals, achievements and commissions paid by the team, job role, and incentive plan.
  • In February 2024, Performio launched its Performio SaaS Blueprint, sales commission software established for SaaS companies. The new software helps SaaS Companies to automate their complete sales commission process and help to manage their time effectively.
  • In April 2024, ALKU, an employment agency, chose IconiSales Compensation Software Software to deliver an industry-leading compensation solution. With the partnership, IconiSales Compensation Software software is expected to help ALKU to ensure their compensation practices and calculate sales compensation to deliver to the employees efficiently.
  • In August 2020, QuotaPath Inc launched free self-service commission tracking software for sales professionals. The new platform has been developed to help salespeople count and keep records of their commission-based earnings and quota attainment.

Similarly, recent developments related to companies developing sales compensation software have been tracked by the team at Future Market Insights, which is available in the full report.

Key Companies Covered

  • SAP
  • Oracle
  • Performio
  • IconiSales Compensation Software
  • Optymyze
  • Xactly Corp.
  • NICE Systems Ltd.
  • Apttus,
  • NetSuite
  • Commissionly.io
  • ZS Associates
  • IBM
  • CellarStone, Inc.
  • Anaplan
  • QuotaPath Inc.
  • CaptivateIQ, Inc.
  • Atmax Technologies

Top Segments Studied in the Sales Compensation Software Market Research Report

By Deployment:

  • Cloud Based
  • Web Based

By Application:

  • Large Enterprises
  • SME’s

By Region:

  • North America
  • Latin America
  • Europe
  • Asia Pacific
  • The Middle East & Africa

Frequently Asked Questions

How big is the sales compensation software market in 2025?

The global sales compensation software market is estimated to be valued at USD 3,473.4 million in 2025.

What will be the size of sales compensation software market in 2035?

The market size for the sales compensation software market is projected to reach USD 8,927.5 million by 2035.

How much will be the sales compensation software market growth between 2025 and 2035?

The sales compensation software market is expected to grow at a 9.9% CAGR between 2025 and 2035.

What are the key product types in the sales compensation software market?

The key product types in sales compensation software market are cloud based and web based.

Which application segment to contribute significant share in the sales compensation software market in 2025?

In terms of application, large enterprises segment to command 62.8% share in the sales compensation software market in 2025.

Table of Content

  1. Executive Summary
    • Global Market Outlook
    • Demand-side Trends
    • Supply-side Trends
    • Technology Roadmap Analysis
    • Analysis and Recommendations
  2. Market Overview
    • Market Coverage / Taxonomy
    • Market Definition / Scope / Limitations
  3. Market Background
    • Market Dynamics
      • Drivers
      • Restraints
      • Opportunity
      • Trends
    • Scenario Forecast
      • Demand in Optimistic Scenario
      • Demand in Likely Scenario
      • Demand in Conservative Scenario
    • Opportunity Map Analysis
    • Product Life Cycle Analysis
    • Supply Chain Analysis
    • Investment Feasibility Matrix
    • Value Chain Analysis
    • PESTLE and Porter’s Analysis
    • Regulatory Landscape
    • Regional Parent Market Outlook
    • Production and Consumption Statistics
    • Import and Export Statistics
  4. Global Market Analysis 2020 to 2024 and Forecast, 2025 to 2035
    • Historical Market Size Value (USD Million) Analysis, 2020 to 2024
    • Current and Future Market Size Value (USD Million) Projections, 2025 to 2035
      • Y-o-Y Growth Trend Analysis
      • Absolute $ Opportunity Analysis
  5. Global Market Pricing Analysis 2020 to 2024 and Forecast 2025 to 2035
  6. Global Market Analysis 2020 to 2024 and Forecast 2025 to 2035, By Deployment
    • Introduction / Key Findings
    • Historical Market Size Value (USD Million) Analysis By Deployment , 2020 to 2024
    • Current and Future Market Size Value (USD Million) Analysis and Forecast By Deployment , 2025 to 2035
      • Cloud Based
      • Web Based
    • Y-o-Y Growth Trend Analysis By Deployment , 2020 to 2024
    • Absolute $ Opportunity Analysis By Deployment , 2025 to 2035
  7. Global Market Analysis 2020 to 2024 and Forecast 2025 to 2035, By Application
    • Introduction / Key Findings
    • Historical Market Size Value (USD Million) Analysis By Application, 2020 to 2024
    • Current and Future Market Size Value (USD Million) Analysis and Forecast By Application, 2025 to 2035
      • Large Enterprises
      • SME’s
    • Y-o-Y Growth Trend Analysis By Application, 2020 to 2024
    • Absolute $ Opportunity Analysis By Application, 2025 to 2035
  8. Global Market Analysis 2020 to 2024 and Forecast 2025 to 2035, By Region
    • Introduction
    • Historical Market Size Value (USD Million) Analysis By Region, 2020 to 2024
    • Current Market Size Value (USD Million) Analysis and Forecast By Region, 2025 to 2035
      • North America
      • Latin America
      • Western Europe
      • Eastern Europe
      • East Asia
      • South Asia and Pacific
      • Middle East & Africa
    • Market Attractiveness Analysis By Region
  9. North America Market Analysis 2020 to 2024 and Forecast 2025 to 2035, By Country
    • Historical Market Size Value (USD Million) Trend Analysis By Market Taxonomy, 2020 to 2024
    • Market Size Value (USD Million) Forecast By Market Taxonomy, 2025 to 2035
      • By Country
        • USA
        • Canada
        • Mexico
      • By Deployment
      • By Application
    • Market Attractiveness Analysis
      • By Country
      • By Deployment
      • By Application
    • Key Takeaways
  10. Latin America Market Analysis 2020 to 2024 and Forecast 2025 to 2035, By Country
    • Historical Market Size Value (USD Million) Trend Analysis By Market Taxonomy, 2020 to 2024
    • Market Size Value (USD Million) Forecast By Market Taxonomy, 2025 to 2035
      • By Country
        • Brazil
        • Chile
        • Rest of Latin America
      • By Deployment
      • By Application
    • Market Attractiveness Analysis
      • By Country
      • By Deployment
      • By Application
    • Key Takeaways
  11. Western Europe Market Analysis 2020 to 2024 and Forecast 2025 to 2035, By Country
    • Historical Market Size Value (USD Million) Trend Analysis By Market Taxonomy, 2020 to 2024
    • Market Size Value (USD Million) Forecast By Market Taxonomy, 2025 to 2035
      • By Country
        • Germany
        • UK
        • Italy
        • Spain
        • France
        • Nordic
        • BENELUX
        • Rest of Western Europe
      • By Deployment
      • By Application
    • Market Attractiveness Analysis
      • By Country
      • By Deployment
      • By Application
    • Key Takeaways
  12. Eastern Europe Market Analysis 2020 to 2024 and Forecast 2025 to 2035, By Country
    • Historical Market Size Value (USD Million) Trend Analysis By Market Taxonomy, 2020 to 2024
    • Market Size Value (USD Million) Forecast By Market Taxonomy, 2025 to 2035
      • By Country
        • Russia
        • Poland
        • Hungary
        • Balkan & Baltic
        • Rest of Eastern Europe
      • By Deployment
      • By Application
    • Market Attractiveness Analysis
      • By Country
      • By Deployment
      • By Application
    • Key Takeaways
  13. East Asia Market Analysis 2020 to 2024 and Forecast 2025 to 2035, By Country
    • Historical Market Size Value (USD Million) Trend Analysis By Market Taxonomy, 2020 to 2024
    • Market Size Value (USD Million) Forecast By Market Taxonomy, 2025 to 2035
      • By Country
        • China
        • Japan
        • South Korea
      • By Deployment
      • By Application
    • Market Attractiveness Analysis
      • By Country
      • By Deployment
      • By Application
    • Key Takeaways
  14. South Asia and Pacific Market Analysis 2020 to 2024 and Forecast 2025 to 2035, By Country
    • Historical Market Size Value (USD Million) Trend Analysis By Market Taxonomy, 2020 to 2024
    • Market Size Value (USD Million) Forecast By Market Taxonomy, 2025 to 2035
      • By Country
        • India
        • ASEAN
        • Australia & New Zealand
        • Rest of South Asia and Pacific
      • By Deployment
      • By Application
    • Market Attractiveness Analysis
      • By Country
      • By Deployment
      • By Application
    • Key Takeaways
  15. Middle East & Africa Market Analysis 2020 to 2024 and Forecast 2025 to 2035, By Country
    • Historical Market Size Value (USD Million) Trend Analysis By Market Taxonomy, 2020 to 2024
    • Market Size Value (USD Million) Forecast By Market Taxonomy, 2025 to 2035
      • By Country
        • Kingdom of Saudi Arabia
        • Other GCC Countries
        • Turkiye
        • South Africa
        • Other African Union
        • Rest of Middle East & Africa
      • By Deployment
      • By Application
    • Market Attractiveness Analysis
      • By Country
      • By Deployment
      • By Application
    • Key Takeaways
  16. Key Countries Market Analysis
    • USA
      • Pricing Analysis
      • Market Share Analysis, 2024
        • By Deployment
        • By Application
    • Canada
      • Pricing Analysis
      • Market Share Analysis, 2024
        • By Deployment
        • By Application
    • Mexico
      • Pricing Analysis
      • Market Share Analysis, 2024
        • By Deployment
        • By Application
    • Brazil
      • Pricing Analysis
      • Market Share Analysis, 2024
        • By Deployment
        • By Application
    • Chile
      • Pricing Analysis
      • Market Share Analysis, 2024
        • By Deployment
        • By Application
    • Germany
      • Pricing Analysis
      • Market Share Analysis, 2024
        • By Deployment
        • By Application
    • UK
      • Pricing Analysis
      • Market Share Analysis, 2024
        • By Deployment
        • By Application
    • Italy
      • Pricing Analysis
      • Market Share Analysis, 2024
        • By Deployment
        • By Application
    • Spain
      • Pricing Analysis
      • Market Share Analysis, 2024
        • By Deployment
        • By Application
    • France
      • Pricing Analysis
      • Market Share Analysis, 2024
        • By Deployment
        • By Application
    • India
      • Pricing Analysis
      • Market Share Analysis, 2024
        • By Deployment
        • By Application
    • ASEAN
      • Pricing Analysis
      • Market Share Analysis, 2024
        • By Deployment
        • By Application
    • Australia & New Zealand
      • Pricing Analysis
      • Market Share Analysis, 2024
        • By Deployment
        • By Application
    • China
      • Pricing Analysis
      • Market Share Analysis, 2024
        • By Deployment
        • By Application
    • Japan
      • Pricing Analysis
      • Market Share Analysis, 2024
        • By Deployment
        • By Application
    • South Korea
      • Pricing Analysis
      • Market Share Analysis, 2024
        • By Deployment
        • By Application
    • Russia
      • Pricing Analysis
      • Market Share Analysis, 2024
        • By Deployment
        • By Application
    • Poland
      • Pricing Analysis
      • Market Share Analysis, 2024
        • By Deployment
        • By Application
    • Hungary
      • Pricing Analysis
      • Market Share Analysis, 2024
        • By Deployment
        • By Application
    • Kingdom of Saudi Arabia
      • Pricing Analysis
      • Market Share Analysis, 2024
        • By Deployment
        • By Application
    • Turkiye
      • Pricing Analysis
      • Market Share Analysis, 2024
        • By Deployment
        • By Application
    • South Africa
      • Pricing Analysis
      • Market Share Analysis, 2024
        • By Deployment
        • By Application
  17. Market Structure Analysis
    • Competition Dashboard
    • Competition Benchmarking
    • Market Share Analysis of Top Players
      • By Regional
      • By Deployment
      • By Application
  18. Competition Analysis
    • Competition Deep Dive
      • SAP
        • Overview
        • Product Portfolio
        • Profitability by Market Segments (Product/Age /Sales Channel/Region)
        • Sales Footprint
        • Strategy Overview
          • Marketing Strategy
          • Product Strategy
          • Channel Strategy
      • Oracle
      • Performio
      • IconiSales Compensation Software
      • Optymyze
      • Xactly Corp.
      • NICE Systems Ltd.
      • Apttus
      • NetSuite
      • Commissionly.io
      • ZS Associates
      • IBM
      • CellarStone, Inc.
      • Anaplan
      • QuotaPath Inc.
      • CaptivateIQ, Inc.
      • Atmax Technologies
  19. Assumptions & Acronyms Used
  20. Research Methodology

List of Tables

  • Table 1: Global Market Value (USD Million) Forecast by Region, 2020-2035
  • Table 2: Global Market Value (USD Million) Forecast by Deployment , 2020-2035
  • Table 3: Global Market Value (USD Million) Forecast by Application, 2020-2035
  • Table 4: North America Market Value (USD Million) Forecast by Country, 2020-2035
  • Table 5: North America Market Value (USD Million) Forecast by Deployment , 2020-2035
  • Table 6: North America Market Value (USD Million) Forecast by Application, 2020-2035
  • Table 7: Latin America Market Value (USD Million) Forecast by Country, 2020-2035
  • Table 8: Latin America Market Value (USD Million) Forecast by Deployment , 2020-2035
  • Table 9: Latin America Market Value (USD Million) Forecast by Application, 2020-2035
  • Table 10: Western Europe Market Value (USD Million) Forecast by Country, 2020-2035
  • Table 11: Western Europe Market Value (USD Million) Forecast by Deployment , 2020-2035
  • Table 12: Western Europe Market Value (USD Million) Forecast by Application, 2020-2035
  • Table 13: Eastern Europe Market Value (USD Million) Forecast by Country, 2020-2035
  • Table 14: Eastern Europe Market Value (USD Million) Forecast by Deployment , 2020-2035
  • Table 15: Eastern Europe Market Value (USD Million) Forecast by Application, 2020-2035
  • Table 16: East Asia Market Value (USD Million) Forecast by Country, 2020-2035
  • Table 17: East Asia Market Value (USD Million) Forecast by Deployment , 2020-2035
  • Table 18: East Asia Market Value (USD Million) Forecast by Application, 2020-2035
  • Table 19: South Asia and Pacific Market Value (USD Million) Forecast by Country, 2020-2035
  • Table 20: South Asia and Pacific Market Value (USD Million) Forecast by Deployment , 2020-2035
  • Table 21: South Asia and Pacific Market Value (USD Million) Forecast by Application, 2020-2035
  • Table 22: Middle East & Africa Market Value (USD Million) Forecast by Country, 2020-2035
  • Table 23: Middle East & Africa Market Value (USD Million) Forecast by Deployment , 2020-2035
  • Table 24: Middle East & Africa Market Value (USD Million) Forecast by Application, 2020-2035

List of Figures

  • Figure 1: Global Market Pricing Analysis
  • Figure 2: Global Market Value (USD Million) Forecast 2020-2035
  • Figure 3: Global Market Value Share and BPS Analysis by Deployment , 2025 and 2035
  • Figure 4: Global Market Y-o-Y Growth Comparison by Deployment , 2025-2035
  • Figure 5: Global Market Attractiveness Analysis by Deployment
  • Figure 6: Global Market Value Share and BPS Analysis by Application, 2025 and 2035
  • Figure 7: Global Market Y-o-Y Growth Comparison by Application, 2025-2035
  • Figure 8: Global Market Attractiveness Analysis by Application
  • Figure 9: Global Market Value (USD Million) Share and BPS Analysis by Region, 2025 and 2035
  • Figure 10: Global Market Y-o-Y Growth Comparison by Region, 2025-2035
  • Figure 11: Global Market Attractiveness Analysis by Region
  • Figure 12: North America Market Incremental Dollar Opportunity, 2025-2035
  • Figure 13: Latin America Market Incremental Dollar Opportunity, 2025-2035
  • Figure 14: Western Europe Market Incremental Dollar Opportunity, 2025-2035
  • Figure 15: Eastern Europe Market Incremental Dollar Opportunity, 2025-2035
  • Figure 16: East Asia Market Incremental Dollar Opportunity, 2025-2035
  • Figure 17: South Asia and Pacific Market Incremental Dollar Opportunity, 2025-2035
  • Figure 18: Middle East & Africa Market Incremental Dollar Opportunity, 2025-2035
  • Figure 19: North America Market Value Share and BPS Analysis by Country, 2025 and 2035
  • Figure 20: North America Market Value Share and BPS Analysis by Deployment , 2025 and 2035
  • Figure 21: North America Market Y-o-Y Growth Comparison by Deployment , 2025-2035
  • Figure 22: North America Market Attractiveness Analysis by Deployment
  • Figure 23: North America Market Value Share and BPS Analysis by Application, 2025 and 2035
  • Figure 24: North America Market Y-o-Y Growth Comparison by Application, 2025-2035
  • Figure 25: North America Market Attractiveness Analysis by Application
  • Figure 26: Latin America Market Value Share and BPS Analysis by Country, 2025 and 2035
  • Figure 27: Latin America Market Value Share and BPS Analysis by Deployment , 2025 and 2035
  • Figure 28: Latin America Market Y-o-Y Growth Comparison by Deployment , 2025-2035
  • Figure 29: Latin America Market Attractiveness Analysis by Deployment
  • Figure 30: Latin America Market Value Share and BPS Analysis by Application, 2025 and 2035
  • Figure 31: Latin America Market Y-o-Y Growth Comparison by Application, 2025-2035
  • Figure 32: Latin America Market Attractiveness Analysis by Application
  • Figure 33: Western Europe Market Value Share and BPS Analysis by Country, 2025 and 2035
  • Figure 34: Western Europe Market Value Share and BPS Analysis by Deployment , 2025 and 2035
  • Figure 35: Western Europe Market Y-o-Y Growth Comparison by Deployment , 2025-2035
  • Figure 36: Western Europe Market Attractiveness Analysis by Deployment
  • Figure 37: Western Europe Market Value Share and BPS Analysis by Application, 2025 and 2035
  • Figure 38: Western Europe Market Y-o-Y Growth Comparison by Application, 2025-2035
  • Figure 39: Western Europe Market Attractiveness Analysis by Application
  • Figure 40: Eastern Europe Market Value Share and BPS Analysis by Country, 2025 and 2035
  • Figure 41: Eastern Europe Market Value Share and BPS Analysis by Deployment , 2025 and 2035
  • Figure 42: Eastern Europe Market Y-o-Y Growth Comparison by Deployment , 2025-2035
  • Figure 43: Eastern Europe Market Attractiveness Analysis by Deployment
  • Figure 44: Eastern Europe Market Value Share and BPS Analysis by Application, 2025 and 2035
  • Figure 45: Eastern Europe Market Y-o-Y Growth Comparison by Application, 2025-2035
  • Figure 46: Eastern Europe Market Attractiveness Analysis by Application
  • Figure 47: East Asia Market Value Share and BPS Analysis by Country, 2025 and 2035
  • Figure 48: East Asia Market Value Share and BPS Analysis by Deployment , 2025 and 2035
  • Figure 49: East Asia Market Y-o-Y Growth Comparison by Deployment , 2025-2035
  • Figure 50: East Asia Market Attractiveness Analysis by Deployment
  • Figure 51: East Asia Market Value Share and BPS Analysis by Application, 2025 and 2035
  • Figure 52: East Asia Market Y-o-Y Growth Comparison by Application, 2025-2035
  • Figure 53: East Asia Market Attractiveness Analysis by Application
  • Figure 54: South Asia and Pacific Market Value Share and BPS Analysis by Country, 2025 and 2035
  • Figure 55: South Asia and Pacific Market Value Share and BPS Analysis by Deployment , 2025 and 2035
  • Figure 56: South Asia and Pacific Market Y-o-Y Growth Comparison by Deployment , 2025-2035
  • Figure 57: South Asia and Pacific Market Attractiveness Analysis by Deployment
  • Figure 58: South Asia and Pacific Market Value Share and BPS Analysis by Application, 2025 and 2035
  • Figure 59: South Asia and Pacific Market Y-o-Y Growth Comparison by Application, 2025-2035
  • Figure 60: South Asia and Pacific Market Attractiveness Analysis by Application
  • Figure 61: Middle East & Africa Market Value Share and BPS Analysis by Country, 2025 and 2035
  • Figure 62: Middle East & Africa Market Value Share and BPS Analysis by Deployment , 2025 and 2035
  • Figure 63: Middle East & Africa Market Y-o-Y Growth Comparison by Deployment , 2025-2035
  • Figure 64: Middle East & Africa Market Attractiveness Analysis by Deployment
  • Figure 65: Middle East & Africa Market Value Share and BPS Analysis by Application, 2025 and 2035
  • Figure 66: Middle East & Africa Market Y-o-Y Growth Comparison by Application, 2025-2035
  • Figure 67: Middle East & Africa Market Attractiveness Analysis by Application
  • Figure 68: Global Market - Tier Structure Analysis
  • Figure 69: Global Market - Company Share Analysis
Dashboard
Dashboard
Dashboard
Dashboard
Dashboard
Dashboard

Full Research Suite comprises of:

Market outlook & trends analysis

Market outlook & trends analysis

Interviews & case studies

Interviews & case studies

Strategic recommendations

Strategic recommendations

Vendor profiles & capabilities analysis

Vendor profiles & capabilities analysis

5-year forecasts

5-year forecasts

8 regions and 60+ country-level data splits

8 regions and 60+ country-level data splits

Market segment data splits

Market segment data splits

12 months of continuous data updates

12 months of continuous data updates

DELIVERED AS:

PDF EXCEL ONLINE

Full Research Suite


$5000

$7500

$10000

Buy Report Now
Similar Industry Reports

Similar Industry Reports

Sales Analysis of Tourism Industry in the Middle East

Sales Analysis of Tourism Industry in the Middle East Size and Share Forecast Outlook 2025 to 2035

Sales of Sports Nutrition Products in Latin America

Sales of Sports Nutrition Products in Latin America Analysis Size and Share Forecast Outlook 2025 to 2035

Sales of Plant‑based Ready Meals in US

Sales of Plant‑based Ready Meals in US Analysis - Size, Share & Forecast 2025 to 2035

Sales Enablement Platform Market

Sales Enablement Platform Market Analysis - Size, Share, and Forecast 2025 to 2035

Sales Intelligence Market

Sales Intelligence Market Size and Share Forecast Outlook 2025 to 2035

Sales of Used Bikes through Bike Marketplace

Sales of Used Bikes through Bike Marketplaces Market- Growth & Demand 2025 to 2035

Salesforce Services Market

Salesforce Services Market Analysis – Growth & Forecast 2024-2034

Sales Coaching Software Market

Sales Coaching Software Market Size and Share Forecast Outlook 2025 to 2035

Sales Platforms Software Market

Sales Platforms Software Market - Growth & Forecast 2034

Sales Intelligence Software Market

Sales Intelligence Software Market Size and Share Forecast Outlook 2025 to 2035

Sales Training and Onboarding Software Market

Sales Training and Onboarding Software Market Size and Share Forecast Outlook 2025 to 2035

Sales Performance Management (SPM) Software Market

Sales Performance Management (SPM) Software Market Size and Share Forecast Outlook 2025 to 2035

Salesforce CRM Document Generation Software Market

Salesforce CRM Document Generation Software Market Size and Share Forecast Outlook 2025 to 2035

Retail Sales of Legume Snacks in the UK

Retail Sales of Legume Snacks in the UK Analysis - Size, Share & Forecast 2025 to 2035

Retail Sales of Kvass in Russia and CIS countries

Retail Sales of Kvass in Russia and CIS countries Analysis - Size, Share & Forecast 2025 to 2035

Retail Sales of Layered Verrine‑Style Desserts in France

Retail Sales of Layered Verrine‑Style Desserts in France Analysis - Size, Share & Forecast 2025 to 2035

Retail Sales of Convenience confectionery in US

US Convenience Confectionery Retail Sales Analysis - Size, Share & Forecast 2025 to 2035

Retail Sales of Bergamot from Calabria in Italy

Retail Sales of Bergamot from Calabria in Italy Analysis - Size, Share & Forecast 2025 to 2035

Generator Sales Market

Generator Sales Market Size and Share Forecast Outlook 2025 to 2035

Demand and Sales Analysis of Paper Cup in Japan

Demand and Sales Analysis of Paper Cup in Japan Size and Share Forecast Outlook 2025 to 2035

Future Market Insights

Sales Compensation Software Market

Chat With MaRIA

Chat With

MaRIA

Hi There, I am MaRIA, Your Market Research Intelligence Assistant. How may I help you?