Sales of Plant‑based Ready Meals in US Size and Share Forecast Outlook 2025 to 2035

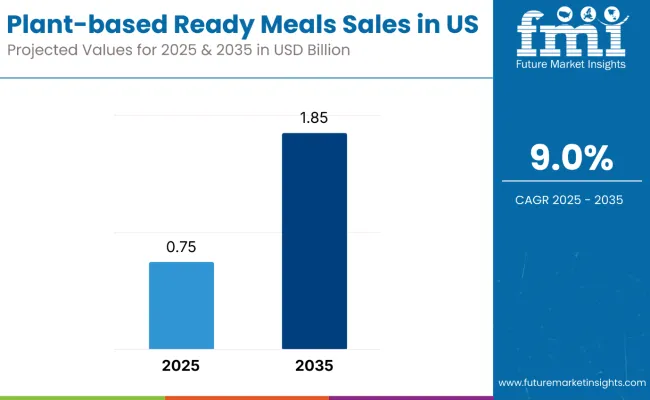
Sales of plant-based ready meals in the United States are estimated at USD 0.75 billion in 2025, with projections indicating a rise to USD 1.85 billion by 2035, reflecting a CAGR of approximately 9% over the forecast period.
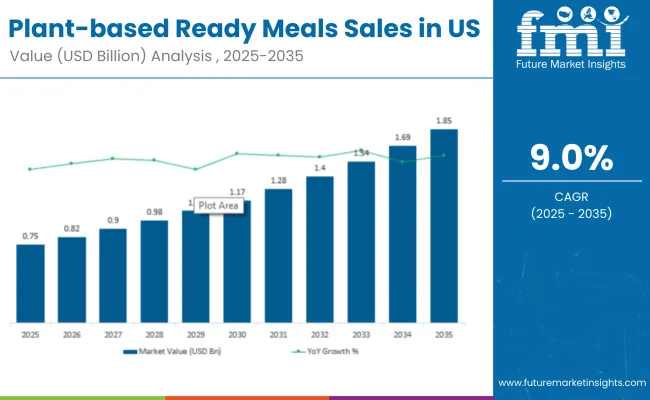
Plant Based Ready Meals Sales In Us 1

USA Plant-based Ready Meals Demand Analysis: Key Takeaways

  • Plant-Based Ready Meals Sales Value (2025): USD 0.75 billion
  • Plant-Based Ready Meals Forecast Value (2035): USD 1.85 billion
  • Plant-Based Ready Meals Forecast CAGR (2025 to 2035): 9.0%
  • Leading Segment in Plant-Based Ready Meals by Product (2025): Frozen Entrées (68%)
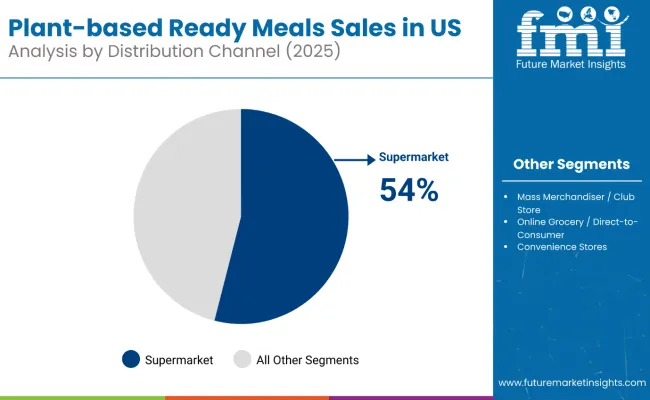
  • Leading Segment in Plant-Based Ready Meals by Distribution (2025): Supermarkets (54%)
  • Fastest Growing Cities for Plant-Based Ready Meals: Houston, Phoenix
  • Top Key Players in Plant-Based Ready Meals Sales: Amy’s Kitchen, Sweet Earth Foods (Nestlé USA), Alpha Foods, Tattooed Chef, Gardein (Conagra Brands)

Plant Based Ready Meals Industry Analysis In Usa

This growth reflects both a broadening consumer base and increased per capita consumption in key urban centres. The rise in demand is linked to shifting dietary preferences, growing awareness of sustainability, and evolving convenience trends.

By 2025, per capita consumption in leading US states such as California, Texas, and Florida averages between 1.3 to 1.5 kilograms, with projections reaching 1.9 kilograms by 2035. New York City leads among metropolitan areas, expected to generate USD 285 million in plant-based ready-meal sales by 2035, followed by Los Angeles (USD 129 million), Chicago (USD 87 million), Houston (USD 73 million), and Phoenix (USD 52 million).

The largest contribution to demand continues to come from frozen plant-based entrées, which are expected to account for 68% of total sales in 2025, owing to strong shelf presence, extended storage life, and retailer support. By distribution channel, supermarkets represent the dominant retail format, responsible for 54% of all sales, while mass merchandisers and online grocery platforms are expanding rapidly.

Consumer adoption is particularly concentrated among young urban families and eco-conscious millennials, with income and urban density emerging as significant drivers of demand. While price remains a limiting factor, the average price premium over conventional meat-based ready meals has declined from 21% in 2020 to 13% in 2025.

Continued improvements in manufacturing scale and private label offerings are expected to accelerate affordability and access across mid-income households. Regional disparities persist, but per capita demand in high-growth Sun Belt cities is narrowing the gap with traditionally strong coastal urban hubs.

Plant-based Ready Meals in the US: Segmentation

The plant-based ready meals segment in the US is classified across several segments. By product, the key categories include frozen entrées, chilled microwaveable meals, shelf-stable bowls and pouches, and meal kits with plant protein. By distribution channel, the segment spans supermarkets, mass merchandisers, online grocery and direct-to-consumer platforms, convenience stores, and natural food co-ops.

By protein source, formulations include soy protein, pea protein, wheat/seitan, lentils and pulses, and blended or emerging sources such as chickpea, fava bean, and myco-protein. By consumer profile, the segment covers young urban families, eco-motivated millennials, flexitarian boomers, Gen-Z snackers, and individuals with dietary or lifestyle restrictions.

By region, states such as California, Texas, Florida, New York, and Pennsylvania are included, along with coverage across all 50 states and Washington, D.C. By city, key metro areas analyzed include New York, Los Angeles, Chicago, Houston, and Phoenix.
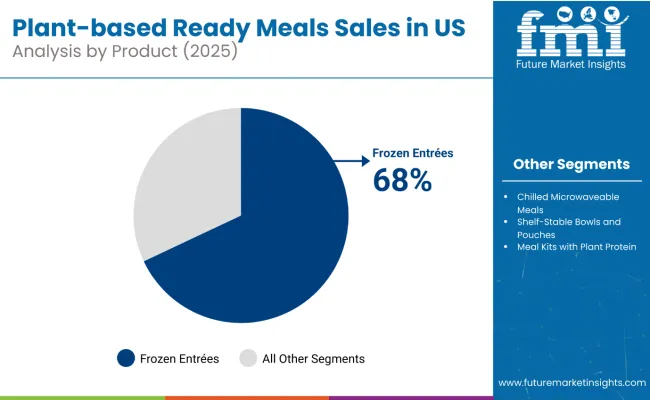
By Product, Frozen Entrées to Lead with 68% Share

Plant Based Ready Meals Industry Analysis In Usa Analysis By Product

Frozen entrées are projected to dominate sales in 2025, supported by freezer-aisle visibility, long shelf life, and category familiarity. Other formats such as chilled, shelf-stable, and meal kits are growing steadily, each serving distinct consumption needs.
  • Frozen entrées are expected to hold a 68% value share in 2025, driven by high unit turnover in supermarkets, strong private label participation, and consumer preference for reheatable, comfort-style meals like pastas, bowls, and stir-fries using soy, pea, and wheat-based proteins.
  • Chilled microwaveable meals are gaining momentum in metro areas, especially among urban professionals and small households, supported by grab-and-go formats and increasing shelf space in forecourt retail and premium grocery.
  • Shelf-stable bowls and pouches are showing strong traction in e-commerce and bundled meal kits, with 9% annual growth tied to low distribution costs and demand for pantry-friendly, high-protein ready meals with ethnic and fusion flavor profiles.
  • Meal kits with plant protein appeal to high-income, health-oriented consumers and are expanding through direct-to-consumer channels and organic retailers; while still niche, they offer high margins and strong consumer satisfaction scores.

By Distribution, Supermarkets to Lead with 54% Share

Plant Based Ready Meals Industry Analysis In Usa Analysis By Distribution Channel

Plant-based ready meals in the USA are distributed through a mix of mainstream retail and alternative sales channels. Supermarkets are expected to remain the primary point of sale in 2025, followed by mass merchandisers and online grocery. Distribution strategies are evolving to match consumer shopping behavior, with growth coming from both physical and digital formats.

  • Supermarkets are projected to account for 54% of total sales in 2025, supported by wide product availability, strong visibility in frozen and chilled sections, and the growing inclusion of private label and health-oriented SKUs in chains such as Kroger, Whole Foods, and Albertsons.
  • Mass merchandisers and club stores are expanding their role through value-priced, family-sized plant-based meals and multipack options, targeting budget-conscious households with growing interest in meat-free convenience foods.
  • Online grocery and direct-to-consumer platforms are forecast to grow at over 17% CAGR, fueled by meal kit services, subscription models, and e-commerce retailers offering exclusive SKUs and same-day frozen delivery in major metro areas.
  • Convenience stores and forecourt retailers are increasingly testing chilled single-serve plant-based meals in urban corridors and travel hubs, appealing to commuters and time-pressed consumers seeking healthier grab-and-go alternatives.
  • Natural food co-ops and health stores, while niche, maintain a loyal consumer base focused on ingredient transparency, organic certification, and allergen-free formulations, contributing to consistent repeat purchase behavior in select ZIP codes.

By Protein Source, Soy-Based Formulations to Dominate Across Formats

Plant-based ready meals in the USA utilize a variety of protein bases, selected for cost, texture, allergen profile, and nutritional content. Soy remains the most widely used protein input, though alternatives like pea and lentil proteins are gaining momentum. Product developers are increasingly exploring hybrid and novel proteins to meet evolving dietary and regulatory demands.

  • Soy protein, including isolates and textured vegetable protein (TVP), continues to anchor many legacy plant-based meal formulations due to its affordability, high protein content, and functional performance in frozen and shelf-stable products.
  • Pea protein has emerged as a key alternative for allergen-free and clean-label formulations, favored for its neutral flavor profile and compatibility with gluten-free claims in chilled and microwaveable meals.
  • Wheat-based proteins (seitan) offer meat-like texture and are widely used in Asian-style or premium entrée offerings; however, adoption is limited in gluten-sensitive consumer segments, which impacts broader scalability.
  • Lentils, chickpeas, and other pulses are increasingly used in ethnic-style bowls and Mediterranean-inspired meal kits, adding fiber and micronutrient diversity while supporting front-of-pack nutrition claims.
  • Blended or novel sources, including chickpea-fava mixes, mycoprotein, and algae-based proteins, are still niche but receiving R&D focus due to sustainability advantages and rising consumer interest in “next-gen” plant proteins.

By Consumer Profile, Young Urban Families and Eco-Motivated Millennials Drive Core Demand

The plant-based ready meals category appeals to a diverse consumer base across age groups, income levels, and dietary preferences. While motivations vary from health to ethics to convenience, demand is concentrated among five key demographic clusters. Each group brings distinct purchase behaviors, channel preferences, and product expectations.
  • Young urban families represent a core consumer group prioritizing convenience and nutrition; this segment tends to purchase frozen and chilled meals during weekly grocery runs and responds well to clean-label claims and child-friendly packaging.
  • Eco-motivated millennials show high repeat purchase intent for plant-based meals aligned with sustainability narratives; this group actively seeks carbon labeling, minimal packaging, and plant-forward ingredients, often purchasing across online and natural grocery formats.
  • Flexitarian boomers, motivated by cholesterol reduction and portion control, increasingly favor single-serve meals with familiar flavors and moderate sodium; their purchasing is shaped by health concerns and clear nutrition labeling.
  • Gen-Z snackers experiment with plant-based ready meals across digital platforms, favoring trending flavors, fusion formats, and novelty packaging; their purchases are heavily influenced by social media, influencers, and gamified loyalty programs.
  • Lifestyle-restricted consumers, including vegans, vegetarians, and those managing allergies or intolerances, actively seek third-party certifications such as gluten-free, non-GMO, and certified vegan, and demonstrate high brand loyalty when trust is established.

Sales of Plant-based Ready Meals in US by Region

Country Wise Nalayis Sof Plant Based Ready Meals Industry Analysis In Usa

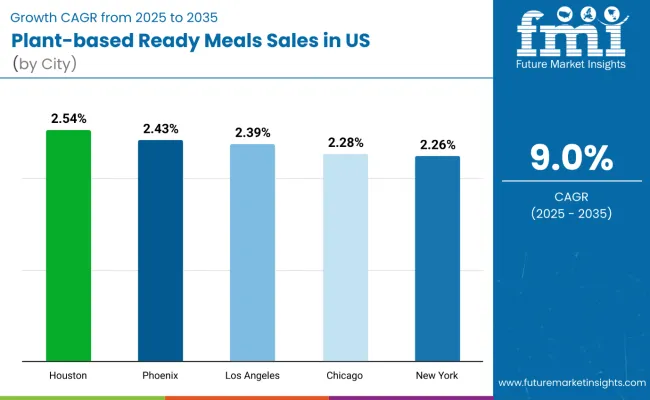
Plant-based ready-meal sales will not grow uniformly across every metro area. Rising population inflows and faster per-capita adoption in the Sun-Belt give Houston and Phoenix a measurable edge, while mature coastal hubs such as New York expand more steadily from a higher base. The table below shows the compound annual growth rate (CAGR) each of the five largest cities is expected to record between 2025 and 2035.

Among the top five cities analyzed, Houston and Phoenix are expected to register the fastest compound annual growth rate (CAGR) of 2.54%, outpacing more mature coastal hubs. This acceleration is underpinned by a combination of factors: strong net migration, growing suburban populations, and increasing availability of plant-based formats across mass retailers and club stores.

In both cities, per capita consumption is projected to rise from 1.4 kg in 2025 to 1.8 kg by 2035, closing the gap with higher-consumption cities such as New York and Los Angeles. Retail assortment is also expanding faster in these regions, with new shelf-stable and chilled formats gaining traction in neighborhoodgrocers and convenience chains.

Los Angeles and Chicago are each forecast to grow at a CAGR of 2.39% over the same period. Both cities already maintain established retail ecosystems, with widespread access to frozen and chilled plant-based ready meals in supermarkets, specialty stores, and ethnic retailers.

In Los Angeles, growth is supported by a strong health-conscious consumer base, brand experimentation, and increasing uptake of private label offerings. Chicago reflects similar dynamics, particularly among flexitarian consumers and households seeking portion-controlled, microwaveable meals. In both cities, per capita consumption is projected to increase from 1.5 kg in 2025 to 1.9 kg by 2035, reflecting mainstreaming of plant-based convenience options.

New York City, while maintaining the highest overall sales in absolute terms, is expected to grow at a CAGR of 2.26%, slightly below its Sun Belt counterparts. The city already exhibits higher-than-average per capita intake (1.6 kg in 2025), extensive product saturation, and a dense urban retail network. Growth will likely come from repeat purchasing, new chilled formats, and ethnic product expansion rather than first-time trial.

Collectively, these five metro areas represent the core of urban demand for plant-based ready meals in the USA, but their individual growth paths highlight the importance of regional tailoring in pricing, format development, and channel strategy.
Notable Players and Strategies in US Plant-based Ready Meals Space

Plant Based Ready Meals Industry Analysis In Usa Analysis By Company

The competitive environment is characterised by a mix of long-established convenience-food manufacturers and newer, plant-exclusive entrants. Distribution breadth rather than sheer product count remains the decisive success factor: the five largest suppliers collectively reach more than 30,000 retail outlets nationwide and account for a majority of frozen and chilled shelf facings in the category.

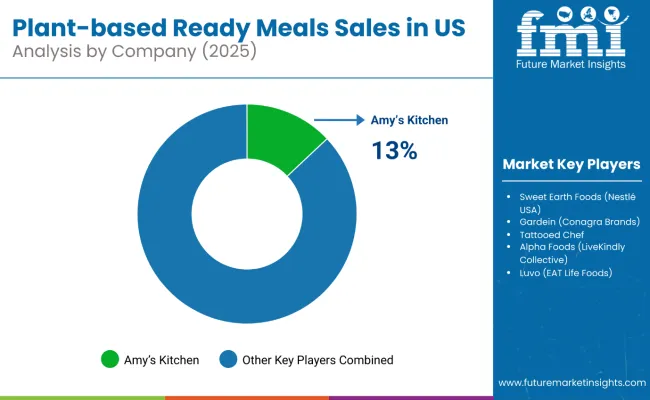
Amy’s Kitchen is the most mature participant. Still privately held, the company offers more than 250 vegetarian SKUs, all certified organic or non-GMO. Its core range of frozen entrées and bowls gives it deep penetration in natural-channel supermarkets while maintaining full national coverage through Kroger, Walmart and Target.

Sweet Earth Foods, acquired by Nestlé USA in 2017, leverages Nestlé’s deep-frozen distribution network to place plant-based burritos, bowls and pizza alternatives in mainstream supermarkets and club stores. Post-integration gains in logistics efficiency have allowed Sweet Earth to introduce multi-serve tray meals priced near parity with conventional frozen entrées, reinforcing its role as Nestlé’s primary vehicle for USA plant-based expansion.

Gardein, owned by Conagra Brands, benefits from scale synergies inside a USD 12 billion frozen-foods portfolio and from co-manufacturing with other Conagra lines. Recent launches under the Ultimate Plant-Based sub-brand extend Gardein beyond meat analogues into meal-ready skillet bowls and stir-fry kits formats expressly targeting the ready-meal shopper.

The next tier comprises specialist or recently public companies. Tattooed Chef focuses on vegetable-forward frozen bowls and handheld meals; Q3-2022 Securities and Exchange Commission filings showed quarterly sales of USD 54 million, signalling national but still niche scale. Alpha Foods, now part of LiveKindly Collective after a 2023 acquisition, adds plant-based burritos and tamale-style entrées to LiveKindly’s USA footprint and is expected to benefit from cross-brand procurement and promotional budgets.

Private-label programmes at Whole Foods (365), Kroger (Simple Truth) and Target (Good & Gather) are widening assortment at price points 10-15% below branded equivalents, putting margin pressure on smaller suppliers while supporting household entry. Consolidation is therefore likely to continue as manufacturing scale and omnichannel reach become critical for maintaining shelf visibility and promotional frequency in this fast-evolving category.

Key Developments

  • Gardein (Conagra Brands): Launched a comfort-focused frozen entrée line including the Ultimate Plant-Based Fried Chick’n Mac & Cheeze Bowl, signaling deeper competition with conventional ready meals.
  • Amy’s Kitchen: Introduced a new plant-based line featuring vegan cheeze, expanding its offering beyond vegetarian to fully dairy-free formats.
  • Tattooed Chef: Entered liquidation proceedings with a USD 100 million lawsuit filed against former executives, as remaining assets are positioned for sale.
  • Kroger - Simple Truth: Rolled out a national e-commerce campaign bundling plant-based frozen meals with free delivery to drive private-label adoption.
  • Impossible Foods: Expanded its portfolio into ready-to-heat items such as plant-based chicken tenders and hot dogs, moving beyond core burger SKUs.

Key Players in US Plant-based Ready Meals Category

  • Amy’s Kitchen
  • Sweet Earth Foods (Nestlé USA)
  • Gardein (Conagra Brands)
  • Tattooed Chef
  • Alpha Foods (LiveKindly Collective)
  • Luvo (EAT Life Foods)
  • Sweet Loren’s
  • Field Roast (Greenleaf Foods)
  • Franklin Farms
  • CedarLane Foods
  • Wildscape
  • Beetnik Foods
  • Hilary’s Eat Well
  • Good Food Made Simple
  • Saffron Road
  • 365 by Whole Foods Market
  • Simple Truth (Kroger)
  • Good & Gather (Target)
  • Trader Joe’s (private label)
  • Dr.Praeger’s

Scope of Plant-based Ready Meals in US Report

Attribute Details
Study Coverage USA sales and consumption of plant-based ready meals from 2020 to 2035
Base Year 2025
Historical Data 2020
Forecast Period 2025 to 2035
Units of Measurement USD (sales), Metric Tonnes (volume), Kilograms per capita (consumption)
Geography Covered All 50 USA states + Washington D.C., state-level and city-level granularity
Top States Analyzed California, Texas, Florida, New York, Pennsylvania,50
Top Cities Analyzed New York, Los Angeles, Chicago, Houston, Phoenix and 50+
By Product Format Frozen entrées, Chilled microwaveable meals, Shelf-stable bowls/pouches, Meal kits
By Distribution Channel Supermarkets, Mass merchandisers/club stores, Online grocery/DTC, Convenience stores, Co-ops
By Protein Source Soy, Pea, Wheat (seitan), Lentils/pulses, Chickpea/fava blends, Mycoprotein, Algae-based
By Consumer Profile Young urban families, Eco-motivated millennials, Flexitarian boomers, Gen-Z snackers, Lifestyle-restricted consumers
Metrics Provided Sales (USD), Volume (MT), Per capita consumption (kg), CAGR (2025 to 2035), Share by segment
Price Analysis Average unit prices by product format and region
Competitive Landscape Company profiles, private label strategies, entry-level brand presence, national vs. regional
Forecast Drivers Per capita demand trends, channel expansion, price convergence, population growth

Key Segmentation

By Product Format:

  • Frozen Entrées
  • Chilled Microwaveable Meals
  • Shelf-stable Bowls and Pouches
  • Meal Kits with Plant Protein

By Protein Source:

  • Soy Protein
  • Pea Protein
  • Wheat/Seitan
  • Lentils and Pulses
  • Blended/Emerging Sources (Chickpea, Fava Bean, Myco-protein)

By Distribution Channel:

  • Supermarkets
  • Mass Merchandisers/Club Stores
  • Online Grocery/Direct-to-Consumer
  • Convenience Stores
  • Natural Food Co-ops

By Consumer:

  • Young Urban Families
  • Eco-motivated Millennials
  • Flexitarian Boomers
  • Gen-Z Snackers
  • Lifestyle-restricted Consumers

By State:

  • California
  • Texas
  • Florida
  • New York
  • Pennsylvania
  • Others (All states)

Table of Content

  1. Executive Summary
    • Global Market Outlook
    • Demand-side Trends
    • Supply-side Trends
    • Technology Roadmap Analysis
    • Analysis and Recommendations
  2. Market Overview
    • Market Coverage / Taxonomy
    • Market Definition / Scope / Limitations
  3. Market Background
    • Market Dynamics
      • Drivers
      • Restraints
      • Opportunity
      • Trends
    • Scenario Forecast
      • Demand in Optimistic Scenario
      • Demand in Likely Scenario
      • Demand in Conservative Scenario
    • Opportunity Map Analysis
    • Product Life Cycle Analysis
    • Supply Chain Analysis
      • Supply Side Participants and their Roles
        • Producers
        • Mid-Level Participants (Traders/ Agents/ Brokers)
        • Wholesalers and Distributors
      • Value Added and Value Created at Node in the Supply Chain
      • List of Raw Material Suppliers
      • List of Existing and Potential Buyer's
    • Investment Feasibility Matrix
    • Value Chain Analysis
      • Profit Margin Analysis
      • Wholesalers and Distributors
      • Retailers
    • PESTLE and Porter's Analysis
    • Regulatory Landscape
      • By Key Regions
      • By Key Countries
    • Regional Parent Market Outlook
    • Production and Consumption Statistics
    • Import and Export Statistics
  4. USA Market Analysis 2025 to 2035 and Forecast
    • Historical Market Size Value (USD Billion) Analysis, 2020 to 2024
    • Current and Future Market Size Value (USD Billion) Projections, 2025 to 2035
      • Y-o-Y Growth Trend Analysis
      • Absolute $ Opportunity Analysis
  5. USA Pricing Analysis 2025 to 2035
  6. USA Analysis 2025 to 2035, By Product Format
    • Introduction / Key Findings
    • Historical Market Size Value (USD Billion) Analysis By Product Format, 2020 to 2024
    • Current and Future Market Size Value (USD Billion) Analysis and Forecast By Product Format, 2025 to 2035
      • Frozen Entrées
      • Chilled Microwaveable Meals
      • Shelf-stable Bowls and Pouches
      • Meal Kits with Plant Protein
    • Y-o-Y Growth Trend Analysis By Product Format, 2020 to 2024
    • Absolute $ Opportunity Analysis By Product Format, 2025 to 2035
  7. USA Analysis 2025 to 2035, By Protein Source
    • Introduction / Key Findings
    • Historical Market Size Value (USD Billion) Analysis By Protein Source, 2020 to 2024
    • Current and Future Market Size Value (USD Billion) Analysis and Forecast By Protein Source, 2025 to 2035
      • Soy Protein
      • Pea Protein
      • Wheat/Seitan
      • Lentils and Pulses
      • Blended/Emerging Sources (Chickpea, Fava Bean, Myco-protein)
    • Y-o-Y Growth Trend Analysis By Protein Source, 2020 to 2024
    • Absolute $ Opportunity Analysis By Protein Source, 2025 to 2035
  8. USA Analysis 2025 to 2035, By Distribution Channel
    • Introduction / Key Findings
    • Historical Market Size Value (USD Billion) Analysis By Distribution Channel, 2020 to 2024
    • Current and Future Market Size Value (USD Billion) Analysis and Forecast By Distribution Channel, 2025 to 2035
      • Supermarkets
      • Mass Merchandisers/Club Stores
      • Online Grocery/Direct-to-Consumer
      • Convenience Stores
      • Natural Food Co-ops
    • Y-o-Y Growth Trend Analysis By Distribution Channel, 2020 to 2024
    • Absolute $ Opportunity Analysis By Distribution Channel, 2025 to 2035
  9. US Analysis 2025 to 2035, By Consumer Profile
    • Introduction / Key Findings
    • Historical Market Size Value (USD Billion) Analysis By Consumer Profile, 2020 to 2024
    • Current and Future Market Size Value (USD Billion) Analysis and Forecast By Consumer Profile, 2025 to 2035
      • Young Urban Families
      • Eco-motivated Millennials
      • Flexitarian Boomers
      • Gen-Z Snackers
      • Lifestyle-restricted Consumers
    • Y-o-Y Growth Trend Analysis By Consumer Profile, 2020 to 2024
    • Absolute $ Opportunity Analysis By Consumer Profile, 2025 to 2035
  10. US Analysis 2025 to 2035, By State
    • Introduction
    • Historical Market Size Value (USD Billion) Analysis By State, 2020 to 2024
    • Current Market Size Value (USD Billion) Analysis and Forecast By State, 2025 to 2035
      • California
      • Texas
      • Florida
      • New York
      • Pennsylvania
      • Others (All states)
    • Market Attractiveness Analysis By State
  11. Key States Market Analysis
    • California
      • Pricing Analysis
      • Market Share Analysis, 2025
        • By Product Format
        • By Protein Source
        • By Distribution Channel
        • By Consumer Profile
    • Texas
      • Pricing Analysis
      • Market Share Analysis, 2025
        • By Product Format
        • By Protein Source
        • By Distribution Channel
        • By Consumer Profile
    • Florida
      • Pricing Analysis
      • Market Share Analysis, 2025
        • By Product Format
        • By Protein Source
        • By Distribution Channel
        • By Consumer Profile
    • New York
      • Pricing Analysis
      • Market Share Analysis, 2025
        • By Product Format
        • By Protein Source
        • By Distribution Channel
        • By Consumer Profile
    • Pennsylvania
      • Pricing Analysis
      • Market Share Analysis, 2025
        • By Product Format
        • By Protein Source
        • By Distribution Channel
        • By Consumer Profile
  12. Key Cities Market Analysis
    • New York City
      • Market Size and Growth Projections
      • Consumer Demographics and Preferences
      • Distribution Channel Performance
    • Los Angeles
      • Market Size and Growth Projections
      • Consumer Demographics and Preferences
      • Distribution Channel Performance
    • Chicago
      • Market Size and Growth Projections
      • Consumer Demographics and Preferences
      • Distribution Channel Performance
    • Houston
      • Market Size and Growth Projections
      • Consumer Demographics and Preferences
      • Distribution Channel Performance
    • Phoenix
      • Market Size and Growth Projections
      • Consumer Demographics and Preferences
      • Distribution Channel Performance
  13. Market Structure Analysis
    • Competition Dashboard
    • Competition Benchmarking
    • Market Share Analysis of Top Players
      • By State
      • By Product Format
      • By Protein Source
      • By Distribution Channel
      • By Consumer Profile
  14. Competition Analysis
    • Competition Deep Dive
      • Amy's Kitchen
        • Overview
        • Product Portfolio
        • Profitability by Market Segments (Product/Consumer/Sales Channel/Region)
        • Sales Footprint
        • Strategy Overview
          • Marketing Strategy
          • Product Strategy
          • Channel Strategy
      • Sweet Earth Foods (Nestlé USA)
        • Overview
        • Product Portfolio
        • Profitability by Market Segments (Product/Consumer/Sales Channel/Region)
        • Sales Footprint
        • Strategy Overview
          • Marketing Strategy
          • Product Strategy
          • Channel Strategy
      • Gardein (Conagra Brands)
        • Overview
        • Product Portfolio
        • Profitability by Market Segments (Product/Consumer/Sales Channel/Region)
        • Sales Footprint
        • Strategy Overview
          • Marketing Strategy
          • Product Strategy
          • Channel Strategy
      • Tattooed Chef
        • Overview
        • Product Portfolio
        • Profitability by Market Segments (Product/Consumer/Sales Channel/Region)
        • Sales Footprint
        • Strategy Overview
          • Marketing Strategy
          • Product Strategy
          • Channel Strategy
      • Alpha Foods (LiveKindly Collective)
        • Overview
        • Product Portfolio
        • Profitability by Market Segments (Product/Consumer/Sales Channel/Region)
        • Sales Footprint
        • Strategy Overview
          • Marketing Strategy
          • Product Strategy
          • Channel Strategy
      • Luvo (EAT Life Foods)
        • Overview
        • Product Portfolio
        • Profitability by Market Segments (Product/Consumer/Sales Channel/Region)
        • Sales Footprint
        • Strategy Overview
          • Marketing Strategy
          • Product Strategy
          • Channel Strategy
      • Field Roast (Greenleaf Foods)
        • Overview
        • Product Portfolio
        • Profitability by Market Segments (Product/Consumer/Sales Channel/Region)
        • Sales Footprint
        • Strategy Overview
          • Marketing Strategy
          • Product Strategy
          • Channel Strategy
      • Private Label Brands Analysis
        • 365 by Whole Foods Market
        • Simple Truth (Kroger)
        • Good & Gather (Target)
        • Trader Joe's (Private Label)
  15. Assumptions & Acronyms Used
  16. Research Methodology

List of Tables

  • Table 1: Market Value (USD Billion) Annual Forecast, 2025-2035
  • Table 2: Market Year-over-Year Growth Rate (%), 2025-2035
  • Table 3: Market CAGR Analysis by Forecast Period, 2025-2035
  • Table 4: Market Value (USD Billion) Forecast by State, 2025-2035
  • Table 5: Market Share (%) Forecast by State, 2025-2035
  • Table 6: California Market Value (USD Billion) and Share (%) Forecast, 2025-2035
  • Table 7: Texas Market Value (USD Billion) and Share (%) Forecast, 2025-2035
  • Table 8: Florida Market Value (USD Billion) and Share (%) Forecast, 2025-2035
  • Table 9: New York Market Value (USD Billion) and Share (%) Forecast, 2025-2035
  • Table 10: Pennsylvania Market Value (USD Billion) and Share (%) Forecast, 2025-2035
  • Table 11: Top 5 States Market Value (USD Billion) and Share (%) Forecast, 2025-2035
  • Table 12: Other States (Combined) Market Value (USD Billion) and Share (%) Forecast, 2025-2035
  • Table 13: State-wise Market Growth Rate Analysis, 2025-2035
  • Table 14: Regional Market Concentration Index by State, 2025-2035
  • Table 15: Top 5 Cities Market Value (USA$ Mn) Forecast, 2025-2035
  • Table 16: New York City Market Value (USA$ Mn) and Share (%) Forecast, 2025-2035
  • Table 17: Los Angeles Market Value (USA$ Mn) and Share (%) Forecast, 2025-2035
  • Table 18: Chicago Market Value (USA$ Mn) and Share (%) Forecast, 2025-2035
  • Table 19: HoUSAton Market Value (USA$ Mn) and Share (%) Forecast, 2025-2035
  • Table 20: Phoenix Market Value (USA$ Mn) and Share (%) Forecast, 2025-2035
  • Table 21: Metropolitan Area Growth Rate Comparison, 2025-2035
  • Table 22: Per Capita Consumption (kg) by Top Cities, 2025 vs 2035
  • Table 23: USA Market Share (%) Forecast by Product Format, 2025-2035
  • Table 24: Frozen Entrées Market Value (USD Billion) and Share (%) Forecast, 2025-2035
  • Table 25: Chilled Microwaveable Meals Market Value (USD Billion) and Share (%) Forecast, 2025-2035
  • Table 26: Shelf-stable Bowls/Pouches Market Value (USD Billion) and Share (%) Forecast, 2025-2035
  • Table 27: Meal Kits with Plant Protein Market Value (USD Billion) and Share (%) Forecast, 2025-2035
  • Table 28: Product Format Growth Rate Analysis, 2025-2035
  • Table 29: Premium vs Standard Product Format Market Split, 2025-2035
  • Table 30: USA Market Share (%) Forecast by Distribution Channel, 2025-2035
  • Table 31: Supermarkets Market Value (USD Billion) and Share (%) Forecast, 2025-2035
  • Table 32: Mass Merchandisers/Club Stores Market Value (USD Billion) and Share (%) Forecast, 2025-2035
  • Table 33: Online Grocery/Direct-to-Consumer Market Value (USD Billion) and Share (%) Forecast, 2025-2035
  • Table 34: Convenience Stores Market Value (USD Billion) and Share (%) Forecast, 2025-2035
  • Table 35: Natural Food Co-ops Market Value (USD Billion) and Share (%) Forecast, 2025-2035
  • Table 36: Distribution Channel Growth Rate Analysis, 2025-2035
  • Table 37: Traditional vs Digital Channel Market Split, 2025-2035
  • Table 38: USA Market Share (%) Forecast by Protein Source, 2025-2035
  • Table 39: Soy Protein Market Value (USD Billion) and Share (%) Forecast, 2025-2035
  • Table 40: Pea Protein Market Value (USD Billion) and Share (%) Forecast, 2025-2035
  • Table 41: Wheat/Seitan Market Value (USD Billion) and Share (%) Forecast, 2025-2035
  • Table 42: Lentils/Pulses Market Value (USD Billion) and Share (%) Forecast, 2025-2035
  • Table 43: Blended/Novel Proteins Market Value (USD Billion) and Share (%) Forecast, 2025-2035
  • Table 44: Protein Source Growth Rate Analysis, 2025-2035
  • Table 45: Traditional vs Emerging Protein Sources Market Split, 2025-2035
  • Table 46: USA Market Share (%) Forecast by Consumer Profile, 2025-2035
  • Table 47: Young Urban Families Market Value (USD Billion) and Share (%) Forecast, 2025-2035
  • Table 48: Eco-Motivated Millennials Market Value (USD Billion) and Share (%) Forecast, 2025-2035
  • Table 49: Flexitarian Boomers Market Value (USD Billion) and Share (%) Forecast, 2025-2035
  • Table 50: Gen-Z Snackers Market Value (USD Billion) and Share (%) Forecast, 2025-2035
  • Table 51: Lifestyle-Restricted Consumers Market Value (USD Billion) and Share (%) Forecast, 2025-2035
  • Table 52: Consumer Profile Growth Rate Analysis, 2025-2035
  • Table 53: Age-based vs Lifestyle-based Consumer Split, 2025-2035
  • Table 54: California Market by Product Format Breakdown, 2025 vs 2035
  • Table 55: Texas Market by Distribution Channel Breakdown, 2025 vs 2035
  • Table 56: Frozen Entrées Market by State Distribution, 2025 vs 2035
  • Table 57: Supermarket Channel by Product Format, 2025 vs 2035
  • Table 58: Soy Protein Segment by Distribution Channel, 2025 vs 2035
  • Table 59: Young Urban Families by Product Format Mix, 2025 vs 2035
  • Table 60: Online Channel by Protein Source Performance, 2025 vs 2035
  • Table 61: Top 5 Cities by Consumer Profile Mix, 2025 vs 2035
  • Table 62: Premium Formats by Distribution Channel Split, 2025 vs 2035
  • Table 63: Emerging Proteins by Consumer Profile Adoption, 2025 vs 2035
  • Table 64: Year-over-Year Growth Analysis by Segment, 2025-2035
  • Table 65: Market Share Stability Index by Category, 2025-2035
  • Table 66: Growth Rate Variance Analysis by State, 2025-2035
  • Table 67: Segment Performance Matrix, 2025 vs 2035
  • Table 68: Market Concentration Ratios by Category, 2025-2035
  • Table 69: Emerging vs Mature Segment Classification, 2025-2035
  • Table 70: High Growth vs Stable Growth Segments, 2025-2035
  • Table 71: Regional Performance vs National Average, 2025-2035
  • Table 72: California Annual Market Value Progression, 2025-2035
  • Table 73: Frozen Entrées Annual Market Share Evolution, 2025-2035
  • Table 74: Supermarket Channel Annual Market Performance, 2025-2035
  • Table 75: Online Channel Annual Market Penetration, 2025-2035
  • Table 76: Soy Protein Segment Annual Value Growth, 2025-2035
  • Table 77: Top 5 States Combined Annual Performance, 2025-2035
  • Table 78: Young Urban Families Annual Adoption Rate, 2025-2035
  • Table 79: Leading States Market Performance Comparison, 2025-2035
  • Table 80: Top Product Formats Market Share Comparison, 2025-2035
  • Table 81: Primary Distribution Channels Growth Rate Comparison, 2025-2035
  • Table 82: Major Protein Sources Market Evolution Comparison, 2025-2035
  • Table 83: Key Consumer Profiles Market Stability Comparison, 2025-2035
  • Table 84: Traditional vs Modern Channels Performance, 2025-2035
  • Table 85: Mainstream vs Specialty Segments Evolution, 2025-2035
  • Table 86: Base Case vs Optimistic Scenario by State, 2025-2035
  • Table 87: Base Case vs Conservative Scenario by Product Format, 2025-2035
  • Table 88: Market Sensitivity Analysis by Key Segments, 2025-2035
  • Table 89: Growth Rate Sensitivity by External Factors, 2025-2035
  • Table 90: Market Size Confidence Intervals by Category, 2025-2035
  • Table 91: Forecast Reliability Index by Segment Type, 2025-2035
  • Table 92: Average Unit Prices by Product Format, 2025-2035
  • Table 93: Price Premium Analysis vs Conventional Ready Meals, 2025-2035
  • Table 94: Volume Sales (Metric Tonnes) by State, 2025-2035
  • Table 95: Per Capita Consumption Evolution by Top States, 2025-2035
  • Table 96: Price-Volume Correlation Analysis by Segment, 2025-2035

List of Figures

  • Figure 1: Sales of Market Volume (Metric Tonnes) Forecast 2020-2035
  • Figure 2: Sales of Market Pricing Analysis
  • Figure 3: Sales of Market Value (USD Billion) Forecast 2020-2035
  • Figure 4: Sales of Market Value Share and BPS Analysis by Product Format, 2025 and 2035
  • Figure 5: Sales of Market Y-o-Y Growth Comparison by Product Format, 2025-2035
  • Figure 6: Sales of Market Attractiveness Analysis by Product Format
  • Figure 7: Sales of Market Value Share and BPS Analysis by Distribution Channel, 2025 and 2035
  • Figure 8: Sales of Market Y-o-Y Growth Comparison by Distribution Channel, 2025-2035
  • Figure 9: Sales of Market Attractiveness Analysis by Distribution Channel
  • Figure 10: Sales of Market Value Share and BPS Analysis by Protein Source, 2025 and 2035
  • Figure 11: Sales of Market Y-o-Y Growth Comparison by Protein Source, 2025-2035
  • Figure 12: Sales of Market Attractiveness Analysis by Protein Source
  • Figure 13: Sales of Market Value Share and BPS Analysis by Consumer Profile, 2025 and 2035
  • Figure 14: Sales of Market Y-o-Y Growth Comparison by Consumer Profile, 2025-2035
  • Figure 15: Sales of Market Attractiveness Analysis by Consumer Profile
  • Figure 16: Sales of Market Value (USD Billion) Share and BPS Analysis by State, 2025 and 2035
  • Figure 17: Sales of Market Y-o-Y Growth Comparison by State, 2025-2035
  • Figure 18: Sales of Market Attractiveness Analysis by State
  • Figure 19: Sales of Market -- Tier Structure Analysis
  • Figure 20: Sales of Market -- Company Share Analysis

Frequently Asked Questions

What is the projected sales value of plant-based ready meals in the USA by 2035?

By 2035, total USA sales of plant-based ready meals are projected to reach USD 1.85 billion, up from USD 0.75 billion in 2025, reflecting a CAGR of approximately 9%.

Which product formats dominate the USA plant-based ready meals category?

Frozen entrées hold the leading share, accounting for approximately 68% of total sales in 2025, followed by chilled microwaveable meals and shelf-stable bowls.

What are the fastest-growing cities for plant-based ready meal consumption?

Houston and Phoenix lead in projected growth, each registering a CAGR of 2.54% between 2025 and 2035, due to population growth and widening distribution.

Which distribution channels are most effective for plant-based ready meals in the USA?

Supermarkets are the dominant sales channel (54% share in 2025), but online grocery and direct-to-consumer platforms are growing at double-digit CAGR, especially in urban regions.

Who are the key companies driving plant-based ready meal innovation in the USA?

Major players include Amy’s Kitchen, Sweet Earth (Nestlé), Gardein (Conagra), Tattooed Chef, and Alpha Foods, with growing competition from private label brands like Kroger’s Simple Truth and Target’s Good & Gather.

Explore Similar Insights

Future Market Insights

Sales of Plant‑based Ready Meals in US