The insulin biosimilar market is experiencing substantial expansion. Rising global diabetes prevalence, escalating healthcare costs, and the patent expiration of branded insulin formulations are driving large-scale adoption. Manufacturers are focusing on producing cost-effective, high-quality biosimilars to meet the increasing demand for affordable diabetes management options.
Regulatory agencies are streamlining approval pathways, encouraging competition and faster market entry. The market is also being shaped by growing acceptance among healthcare professionals and patients due to proven therapeutic equivalence and cost savings. Technological advancements in biologics manufacturing and delivery systems are enhancing efficiency and product stability.
The future outlook remains positive as emerging economies expand healthcare access and reimbursement coverage improves Growth rationale is based on increasing disease awareness, expansion of distribution networks, and the clinical reliability of biosimilar formulations, positioning the market for sustained revenue growth and broader accessibility across diverse healthcare settings.
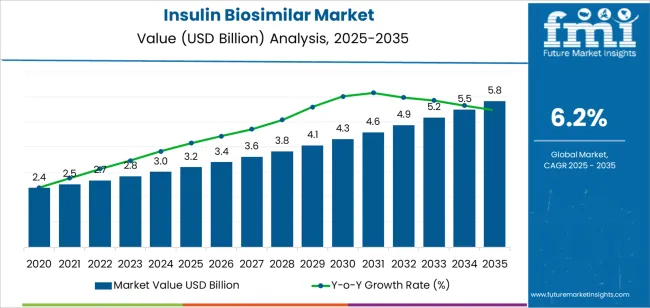
| Metric | Value |
|---|---|
| Insulin Biosimilar Market Estimated Value in (2025 E) | USD 3.2 billion |
| Insulin Biosimilar Market Forecast Value in (2035 F) | USD 5.8 billion |
| Forecast CAGR (2025 to 2035) | 6.2% |
The market is segmented by Type, Indication, and Distribution Channel and region. By Type, the market is divided into Long-Acting Insulin, Fast-Acting Insulin, and Intermediate-Acting Insulin. In terms of Indication, the market is classified into Diabetes Type 2 and Diabetes Type 1. Based on Distribution Channel, the market is segmented into Hospital Pharmacies, Retail Pharmacies, Drug Stores, and Online Pharmacies. Regionally, the market is classified into North America, Latin America, Western Europe, Eastern Europe, Balkan & Baltic Countries, Russia & Belarus, Central Asia, East Asia, South Asia & Pacific, and the Middle East & Africa.
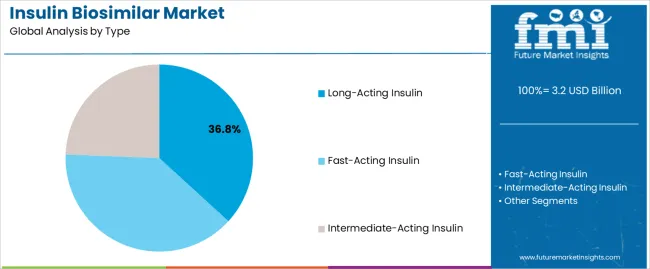
The long-acting insulin segment, accounting for 36.80% of the type category, has established its dominance due to superior patient compliance and sustained blood glucose control. Its extended action profile reduces dosing frequency, making it preferable for long-term management of diabetes.
Market growth has been supported by clinical validation, consistent therapeutic outcomes, and rising adoption in both developed and developing regions. Manufacturers have focused on improving formulation stability and delivery mechanisms to ensure patient convenience and efficacy.
Regulatory approvals and healthcare provider confidence have reinforced market presence, while strategic collaborations between biosimilar producers and healthcare institutions have accelerated uptake The segment is expected to maintain its lead as healthcare systems increasingly prioritize cost-effective, reliable, and accessible insulin therapies for chronic disease management.
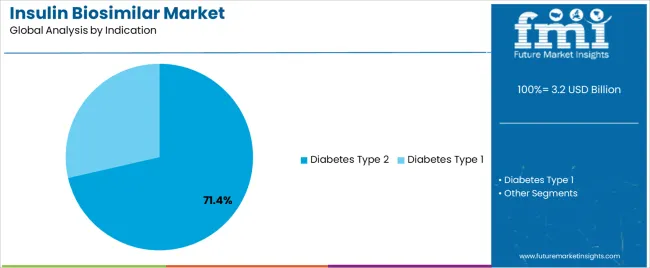
The diabetes type 2 segment, representing 71.40% of the indication category, remains the largest due to its widespread global prevalence and strong demand for long-term insulin therapy. Increasing obesity rates, sedentary lifestyles, and aging populations are contributing to the rising incidence of type 2 diabetes.
The segment benefits from established clinical protocols and growing physician preference for biosimilars as effective alternatives to branded insulins. Enhanced patient awareness, government initiatives promoting affordable care, and improved diagnostic access are further strengthening adoption.
Continued research into biosimilar efficacy and safety profiles is reinforcing patient trust As healthcare systems focus on reducing treatment costs and improving chronic disease outcomes, the diabetes type 2 segment is expected to sustain robust growth and remain the primary driver of market expansion.
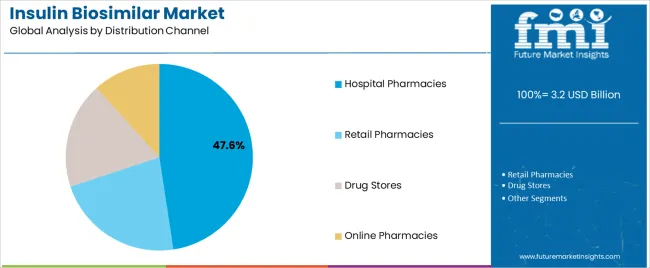
The hospital pharmacies segment, holding 47.60% of the distribution channel category, has emerged as the dominant channel due to its central role in dispensing biosimilar insulins for both inpatient and outpatient care. Strong institutional purchasing power and adherence to quality assurance standards have supported its leadership.
Hospital pharmacies offer direct access to prescribed insulin therapies, ensuring timely and regulated distribution. Integration with clinical care pathways and electronic health record systems has improved tracking and patient compliance.
Strategic partnerships between hospitals and biosimilar manufacturers have enhanced supply consistency and affordability Expansion of hospital networks in emerging regions and the adoption of digital inventory management systems are expected to reinforce this channel’s growth, ensuring that hospital pharmacies continue to serve as the cornerstone of insulin biosimilar distribution.
The insulin biosimilar market is witnessing significant expansion owing to the growing demand for cost-effective diabetes management solutions. Similarly, rising prevalence of diabetes is acting as a catalyst triggering insulin biosimilar sales.
The increasing competition among pharmaceutical companies has led to the development and commercialization of biosimilar versions of insulin. This surge in competition has been driven by the expiration of patents for several major insulin products, which paved the way for the entry of biosimilar alternatives.
Availability of insulin biosimilars is increasing accessibility and potentially lowering the cost of insulin for people with diabetes. Growing popularity of these diabetic medications will likely foster market growth during the next ten years.
Another noteworthy trend is the global push for improved access to affordable insulin therapy, particularly in developing countries where diabetes prevalence is rising. Governments and healthcare organizations are exploring biosimilars as a means to reduce treatment costs and enhance accessibility for patients.
Advancements in biotechnology and manufacturing processes are leading to the development of high-quality insulin biosimilars that closely resemble their reference products. This is increasing acceptance of biosimilars from healthcare professionals and patients alike, providing a positive outlook for the market.
Strategic collaborations and partnerships between pharmaceutical companies and healthcare providers have become prevalent. These developments are aiming to streamline distribution channels and expand market reach for insulin biosimilars. Overall, the insulin biosimilar market is characterized by innovation, increased competition, and a focus on improving affordability and accessibility of diabetes treatment globally.
Ongoing advancements in drug delivery systems are revitalizing the insulin biosimilar market. Thanks to the development of advanced solutions like insulin jet injectors, implantable pumps, and smart injectors, delivering insulin is becoming easier and more effective.
Global insulin biosimilar sales increased at a CAGR of 4.8% from 2020 to 2025. Total market revenue at the end of 2025 reached around USD 2,806.1 million. Over the next ten years, global demand for insulin biosimilars is projected to increase at 6.2% CAGR.
One prominent factor driving the growth of insulin biosimilar market is the rising prevalence of diabetes. Since insulin is responsible for regulating blood sugar levels, an inability to do so leads to hyperglycemia (raised blood sugar levels).
Hyperglycemia can damage critical bodily systems over time, particularly nerves and blood vessels. To counter this, patients opt for different treatments, including insulin medications like biosimilars. What makes insulin biosimilars popular is their effectiveness and affordability.
The prevalence of diabetes has been on a constant rise over the last few decades. In 2020, the number of people diagnosed with diabetes was around 3 million, which increased to 529 million in 2024.
Each year, about 1.5 million new cases of diabetes are diagnosed. This will continue to play a key role in propelling demand for diabetes treatments such as insulin biosimilars during the assessment period.
Insulin effectively lowers the blood glucose level and prevents microvascular complications such as retinopathy, nephropathy, small vessel arterial disease, etc. Insulin analogs, which are genetically altered forms of insulin, also act in a similar way and control the blood sugar level.
Biosimilar insulin and insulin analogs have further advantages, as they are available at lower prices than their reference product, further bolstering their adoption. This can promote competition, leading to a drop in drug and healthcare costs and increased patient access.
While most companies aim for a presence in developed markets, there is a huge opportunity for insulin biosimilar companies to grow in emerging countries. To succeed in these markets, biosimilar players must adopt a strategic, long-term approach focused on delivering affordable products and enhancing access in areas with significant untapped demand. This entails pursuing consistent sales growth, albeit with smaller profit margins than in developed markets.
Certain companies from emerging markets have already expanded their footprint beyond their home territories. Biocon in India, for instance, has introduced insulin glargine in over 20 emerging markets, leveraging partnerships in countries like Malaysia, Mexico, and Algeria.
India-based Wockhardt has commercialized insulin glargine in more than 30 countries, including Colombia, Indonesia, Tanzania, and Malaysia. Gan & Lee Pharmaceutical, a Chinese company, has introduced insulin glargine under various brand names in Argentina, Indonesia, and Brazil, among others.
Partnerships between multinationals and local players are a common strategy for entering emerging markets. Such collaborations provide a rapid entry route for multinationals, aiding in navigating complex regulatory landscapes, leveraging existing relationships, and reducing manufacturing costs.
For local companies, these partnerships offer opportunities to capitalize on their market position and local knowledge, fostering growth. Ultimately, in the insulin biosimilar industry, seizing the potential in emerging countries involves strategic partnerships, affordability, and tailored approaches to address diverse market dynamics.
The global insulin biosimilar industry faces significant regulatory challenges that hinder its growth. Obtaining approval for biosimilar products involves demonstrating similarity to the reference product through extensive and costly clinical trials.
Biologic products, often manufactured using genetically engineered systems, pose unique challenges due to the impossibility of creating identical copies. The proprietary nature of production processes for reference products and the inherent complexity of biological molecules amplify the difficulty of biosimilar development.
The gap between the reference product's development and biosimilar development initiation introduces technological challenges. Regulatory expectations make it imperative for biosimilar manufacturers to employ contemporary technologies while adhering to evolved industry standards and regulatory norms.
The European Medicines Agency (EMA) and the USA Food and Drug Administration (FDA) outline stringent requirements for biosimilar approval. This is leading to slow drug approvals, ultimately limiting market expansion.
Factors such as the lack of global regulatory harmonization remain confusing. Regional and country-specific legislation and guidance for biosimilars are at various stages of development and implementation. There is a lack of harmonization in the selection of the reference product, nomenclature, and the design of analytical, non-clinical, and clinical comparative studies.
The lack of global alignment creates a fragmented landscape, adding layers of complexity for insulin biosimilar manufacturers seeking regulatory approval. In navigating these intricate regulatory hurdles, the insulin biosimilar market encounters delays and uncertainties, limiting its growth potential despite the promise of providing lower-cost alternatives and greater access to biologics.
The table below shows the predicted growth rates of the top nations. Germany, India, and China are anticipated to record high CAGRs of 7.7%, 6.8%, and 5.8%, respectively, through 2035.
Market Growth Outlook by Key Countries
| Countries | Value CAGR |
|---|---|
| United States | 5.5% |
| China | 5.8% |
| India | 6.8% |
| Japan | 4.5% |
| Germany | 7.7% |
The United States insulin biosimilar industry is expected to be valued at USD 3.2 million in 2025. It held around 29.8% of the global insulin biosimilar market share in 2025. Over the assessment period, adoption of insulin biosimilars in the United States is set to rise at a CAGR of 5.5%.
The United States is leading the insulin biosimilar market due to several factors. The prevalence of diabetes is high in the United States, which creates a substantial demand for insulin and its alternatives.
The regulatory environment in the United States is conducive to the development and approval of biosimilars. It provides a pathway for companies to bring these products to market. As a result, the nation is witnessing increasing insulin biosimilar product launches and approvals.
The United States healthcare system emphasizes cost-effectiveness, prompting significant interest in biosimilars as more affordable alternatives to branded insulin products. The presence of well-established pharmaceutical and biotechnology companies with expertise in biosimilar development also contributes to the dominance of the United States.
Favorable reimbursement policies and a large patient population contribute to the increasing United States insulin biosimilar market share. Hence, the nation will likely remain a highly lucrative pocket for insulin biosimilar manufacturers.
China’s insulin biosimilar market is anticipated to progress at a CAGR of 5.8% during the forecast period. Overall, insulin biosimilar sales in the country will likely total USD 261.2 million in 2025.
China's dominance in the East Asia insulin biosimilar industry stems from its vast diabetic population, which fosters a huge demand for cost-effective treatment. Patients in the country are seeking affordable diabetes medications to live a healthy life, creating demand for insulin biosimilars.
The country's proactive regulatory approach, aimed at encouraging biosimilar development and adoption, contributes to the market expansion. Also, China prioritizes healthcare accessibility and innovation, which positions it as a key player in shaping the global landscape for insulin biosimilars.
The insulin biosimilar market in India is expected to grow with a CAGR of 6.8% during the forecast period. It will likely attain a valuation of USD 207.2 million in 2025, making it the most dominant market across South Asia & Pacific.
India’s large diabetic population, coupled with a focus on affordable healthcare solutions, positions it as a significant player. Similarly, the nation's regulatory initiatives supporting biosimilar development and a growing emphasis on healthcare innovation contribute to its prominence in the global insulin biosimilar landscape.
Being the hub of emerging pharmaceutical companies, India fosters healthy competition among market players, leading to affordable prices of insulin biosimilars for the patient. This will further boost India’s biosimilar market growth during the assessment period.
The section below shows the fast-acting insulin segment leading the global insulin biosimilar industry. It is expected to account for a revenue share of 57.6% in 2025. Based on indication, the diabetes type 2 segment will likely hold a market share of 80.6% in 2025. In terms of distribution channels, the retail pharmacies segment is set to account for a value share of 48.4% in 2025.
Market Growth Outlook by Type
| Type | Value CAGR |
|---|---|
| Fast-acting Insulin | 6.8% |
| Intermediate-acting Insulin | 4.0% |
| Long-acting Insulin | 6.1% |
As per the latest insulin biosimilar market analysis, demand for fast-acting insulin is expected to remain high throughout the forecast period. The target segment is anticipated to grow at a rapid CAGR of 6.8%, generating revenue worth USD 1,733.8 million in 2025.
The quick-acting insulin segment is expected to account for a revenue share of 57.6% in 2025. The combined factors of effectiveness and low cost are making fast-acting insulin popular among diabetic patients globally.
Fast-acting insulin plays a critical role in managing postprandial glucose levels. It is typically administered before meals to control blood sugar spikes, making it a crucial component in diabetes management.
Biosimilars of fast-acting insulin offer cost-effective alternatives while maintaining efficacy. This contributes to their prominence in the market, and the trend will likely persist during the assessment period.
Market Growth Outlook by Indication
| Indication | Value CAGR |
|---|---|
| Diabetes Type 1 | 7.1% |
| Diabetes Type 2 | 6.0% |
Based on indication, the diabetes type 2 segment is expected to lead the global insulin biosimilar market, holding a share of 80.6% in 2025. Over the forecast period, demand for insulin biosimilars for type 2 diabetes is projected to rise at 6.0% CAGR through 2035.
Multiple factors are driving growth of the target segment. These include rising incidence of type 2 diabetes globally and increasing popularity of insulin biosimilars for managing type 2 diabetes.
With a majority of diabetes cases falling under Type 2, there is a heightened demand for cost-effective insulin solutions. Insulin biosimilar manufacturers are strategically focusing on developing alternatives tailored to type 2 diabetes management, capitalizing on the larger patient population.
The market dominance is further fueled by the need to address affordability concerns and provide accessible treatment options. This factor aligns with the prevailing healthcare priorities.
Market Growth Outlook by Distribution Channel
| Distribution Channel | Value CAGR |
|---|---|
| Hospital Pharmacies | 6.5% |
| Retail Pharmacies | 5.3% |
| Drug Stores | 8.7% |
| Online Pharmacies | 7.8% |
The retail pharmacies segment is anticipated to grow at 6.5% CAGR during the assessment period. It will likely total a market valuation of USD 1,457.3 million in 2025, driven by rising consumer preference for purchasing insulin medication from retail pharmacies.
Due to their widespread presence and patient-centric approach, retail pharmacies have emerged as a dominant distribution channel in the insulin biosimilar market. They are becoming ideal destinations for diabetic patients to access affordable insulin medications.
Positioned in local communities, retail pharmacies offer immediate accessibility to biosimilar products, fostering patient trust through personalized interactions with pharmacists. Their established infrastructure, coupled with a direct connection to diverse demographic groups, facilitates broader market reach.
The convenience of face-to-face consultations and the ability to provide real-time guidance contribute to retail pharmacies leading the insulin biosimilar market. They ensure a seamless and accessible avenue for patients seeking diabetes management solutions.
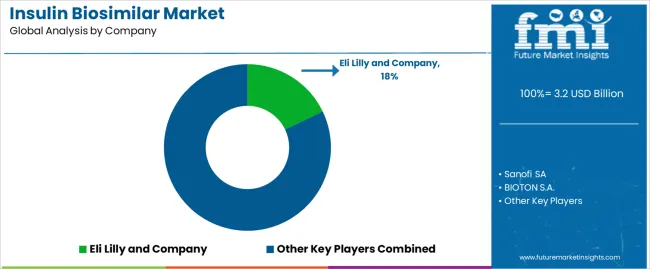
Key manufacturers of insulin biosimilars are constantly looking to expand their product portfolios to meet the diverse needs of diabetic patients. They are also navigating regulatory frameworks efficiently to receive quick approval from regulatory bodies like the Food & Drug Administration (FDA).
Several insulin biosimilar companies are adopting strategies like partnerships, collaborations, and alliances to expand their expertise in research, development, and commercialization. They are entering into collaborative agreements with local pharma companies to devise effective market entry strategies for emerging markets.
Recent Developments in the Insulin Biosimilar Market
The global insulin biosimilar market is estimated to be valued at USD 3.2 billion in 2025.
The market size for the insulin biosimilar market is projected to reach USD 5.8 billion by 2035.
The insulin biosimilar market is expected to grow at a 6.2% CAGR between 2025 and 2035.
The key product types in insulin biosimilar market are long-acting insulin, fast-acting insulin, _rapid-acting insulin analogs, _regular human insulin, intermediate-acting insulin, _nph human insulin and _pre-mixed insulin.
In terms of indication, diabetes type 2 segment to command 71.4% share in the insulin biosimilar market in 2025.


Full Research Suite comprises of:
Market outlook & trends analysis
Interviews & case studies
Strategic recommendations
Vendor profiles & capabilities analysis
5-year forecasts
8 regions and 60+ country-level data splits
Market segment data splits
12 months of continuous data updates
DELIVERED AS:
PDF EXCEL ONLINE
Insulin Pumps Market Size and Share Forecast Outlook 2025 to 2035
Insulin Pen Packaging Market Analysis - Size, Share, and Forecast Outlook 2025 to 2035
Insulin Pens Market – Growth & Forecast 2025 to 2035
Insulin Management System Market Growth - Trends & Forecast 2025 to 2035
Insulin Delivery Pen Market Growth – Trends & Forecast 2024-2034
Insulin Patch Pump Market
Non-Insulin Peptide Drugs Market Analysis - Size, Share, and Forecast Outlook 2025 to 2035
CIS Insulin Market Size and Share Forecast Outlook 2025 to 2035
Hyperinsulinemia Hypoglycaemia Treatment Market Insights by Type, Treatment, End User, and Region through 2035
Smart Insulin Pens Market Insights – Demand, Size & Industry Trends 2025 to 2035
The Disposable Insulin-delivery Device Market is segmented by Delivery Pumps, Patches, Pens, and Syringes from 2025 to 2035
Veterinary Insulin Drugs Market
Global Non-injectable Insulin Market Insights – Size, Trends & Forecast 2024-2034
Congenital Hyperinsulinism Treatment Market - Demand & Innovations 2025 to 2035
Biosimilar Testing Services Market Size and Share Forecast Outlook 2025 to 2035
Biosimilar Contract Manufacturing Market Size and Share Forecast Outlook 2025 to 2035
Biosimilar and Biologics Market Analysis – Size, Share, and Forecast Outlook 2025 to 2035
Remicade Biosimilar Market Analysis - Demand & Forecast 2025 to 2035
Global Psoriasis Biosimilars Market Analysis – Size, Share & Forecast 2024-2034
Interchangeable Biosimilars Market

Thank you!
You will receive an email from our Business Development Manager. Please be sure to check your SPAM/JUNK folder too.
Chat With
MaRIA