PARP Inhibitor Market Size and Share Forecast Outlook 2025 to 2035

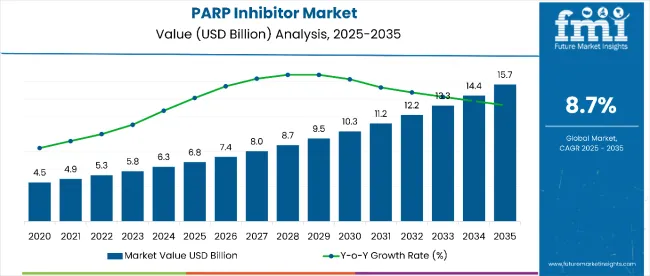
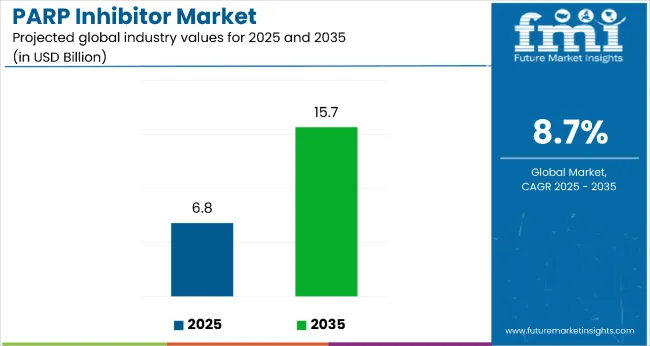
The PARP inhibitor market is estimated to be valued at USD 6.8 billion in 2025 and is projected to reach USD 15.7 billion by 2035, registering a compound annual growth rate (CAGR) of 8.7% over the forecast period. Increasing awareness of targeted cancer therapies, advancements in biomarker-driven treatment, and expansion into rare cancer indications are fueling market growth. Adoption of combination therapies with immunotherapy and chemotherapy is also contributing to market expansion.

The substantial expansion is fueled by increasing adoption of targeted cancer therapies, especially for ovarian, breast, prostate, and pancreatic cancers. The market is also gaining momentum from expansion into rare cancer indications and the integration of precision medicine techniques such as biomarker-driven patient selection. Regulatory support, increasing patient awareness, and the rise of combination therapies further accelerate the adoption of PARP inhibitors, contributing to steady market growth across global regions.

By 2030, the market is expected to reach around USD 10.3 billion, with an incremental growth of about USD 3.5 billion during the first half of the decade. The remaining USD 5.4 billion growth is anticipated in the latter half, illustrating balanced development over the forecast period. Innovations in combination treatment regimens, enhanced patient stratification, and expanded approvals for new PARP inhibitors are key drivers shaping this trajectory. Overall, the market outlook remains positive, supported by therapeutic advancements that improve treatment efficacy and patient outcomes.

Parp Inhibitors Market Value Analysis

Quick Stats for PARP Inhibitor Market

  • PARP Inhibitor Market Value (2025): USD 6.8 billion
  • PARP Inhibitor Market Forecast Value (2035): USD 15.7 billion
  • PARP Inhibitor Market Forecast CAGR: 8.7%
  • Leading Segment in PARP Inhibitor Market in 2025: Olaparib (86.2%)
  • Key Growth Regions in PARP Inhibitor Market: North America and Asia Pacific
  • Top Players in PARP Inhibitor Market: AstraZeneca, GlaxoSmithKline plc, Merck & Co., Inc., AbbVie Inc, Clovis Oncology

Parp Inhibitors Market

Metric Value
Estimated Value in 2025 (E) USD 6.8 billion
Forecast Value in 2035 (F) USD 15.7 billion
Forecast CAGR (2025 to 2035) 8.7%

The market holds an 86.2% share within the targeted cancer therapies segment, driven by its proven efficacy in treating BRCA-mutated and homologous recombination deficiency (HRD) cancers. It accounts for around 83.9% of the ovarian cancer treatment market, supported by strong clinical data and growing patient adoption. The market contributes nearly 38% to the overall oncology therapeutics landscape, bolstered by increasing use in breast, prostate, and pancreatic cancers. It holds close to 24% of the precision medicine segment, where biomarker-driven patient stratification strengthens its position. The share in the global targeted therapy market is about 20%, highlighting its expanding role in multimodal cancer treatment regimens.

The market is evolving with new combination therapies enhancing treatment outcomes and expanding indications into rare cancers. Pharmaceutical companies are investing in next-generation PARP inhibitors and companion diagnostic developments. Collaborations with healthcare providers and increased regulatory approvals are accelerating market penetration. Furthermore, growing awareness among clinicians and patients, along with rising accessibility through reimbursement policies, support broader adoption. These dynamics are reshaping the oncology treatment landscape and positioning PARP inhibitors as a key pillar of personalized cancer care.
Why is the PARP Inhibitor Market Growing?

The market is growing significantly due to multiple converging factors driven by advances in cancer treatment and precision medicine. One of the primary reasons is the increasing prevalence of cancers such as ovarian, breast, prostate, and pancreatic cancers, which are responsive to PARP inhibitor therapy. These inhibitors target tumors with specific genetic mutations, particularly BRCA1 and BRCA2, exploiting vulnerabilities in cancer cells by blocking DNA repair pathways, leading to enhanced treatment efficacy.

Additionally, advances in biomarker-driven patient stratification and genetic testing have improved the identification of eligible patients who are most likely to benefit from PARP inhibitors, thereby expanding the addressable patient population. Increasing awareness among healthcare professionals and patients about the benefits of targeted therapies has also contributed to higher adoption rates of PARP inhibitors.

PARP Inhibitor Market Analysis by Top Investment Segments

The market is segmented by drug type, indication, distribution channel, and region. By drug type, the market is categorized into Olaparib, Niraparib, Rucaparib, and Talazoparib. Based on indication, the market is divided into ovarian cancer, breast cancer, prostate cancer, and pancreatic cancer. In terms of distribution channel, the market is segmented into hospital pharmacies, retail pharmacies, and online pharmacies. Regionally, the market is classified into North America, Latin America, Western Europe, Eastern Europe, South Asia and Pacific, East Asia, and the Middle East & Africa.
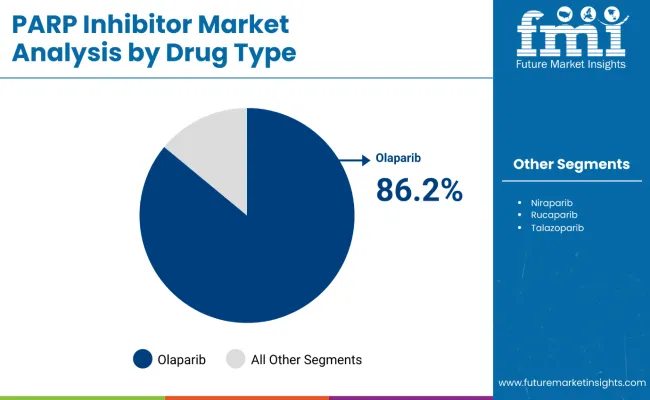
By Drug Type, Olaparib Accounts for 86.2% of the Market Share

Parp Inhibitors Market By Drug Type

The most lucrative segment within the PARP inhibitor market by drug type is Olaparib, which is projected to hold an overwhelming market share of 86.2% in 2025. Olaparib’s market dominance is attributed to its status as the first FDA-approved PARP inhibitor and its broad-spectrum applicability across multiple cancer indications, particularly ovarian and breast cancer. The drug’s proven clinical efficacy in extending progression-free survival and overall survival bolsters physician confidence and patient demand.

Olaparib's success is further enhanced by multiple regulatory approvals worldwide, comprehensive reimbursement coverage, and a strong clinical trial pipeline expanding its indications, including use in non-BRCA mutated cancers with homologous recombination deficiency (HRD). Its flexible administration and favorable safety profile also contribute to its competitive edge.
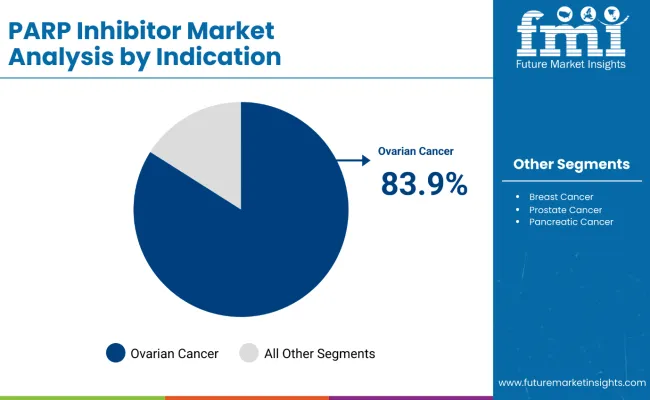
By Indication, Ovarian Cancer Accounts for 83.9% Market Share

Parp Inhibitors Market By Indication

The most lucrative segment by indication in the PARP inhibitor market is ovarian cancer, commanding a dominant market share of 83.9% as of 2025. This segment’s prominence is driven by the high incidence and significant unmet medical need associated with ovarian cancer, which is one of the most common gynecologic malignancies worldwide. Historically, ovarian cancer treatment options have been limited, positioning PARP inhibitors like Olaparib as breakthrough therapies that substantially improve progression-free survival for patients, especially those with BRCA mutations or homologous recombination deficiency (HRD).

The strong clinical validation of PARP inhibitors in ovarian cancer has led to widespread adoption, robust reimbursement policies, and accelerated regulatory approvals across major markets. Furthermore, ongoing trials are exploring expansions into earlier-stage ovarian cancer and maintenance therapies, which are expected to boost usage and market growth further. Compared to other indications like breast, prostate, and pancreatic cancers, ovarian cancer remains the primary revenue driver, benefiting from a combination of high patient volumes, compelling efficacy data, and progressive treatment paradigms, solidifying its position as the most lucrative indication segment in the PARP inhibitor market.

What are the Drivers, Restraints, and Key Trends of the PARP Inhibitor Market?

From 2025 to 2035, the PARP inhibitor market is propelled by increasing adoption of targeted cancer therapies that improve patient outcomes by exploiting DNA repair weaknesses in tumors. Advances in biomarker-driven precision medicine have allowed clinicians to better identify eligible patients, enhancing treatment efficacy and safety. This precision approach positions PARP inhibitors as essential components in personalized oncology regimens, expanding their clinical use across ovarian, breast, prostate, and pancreatic cancers.

Pharmaceutical Innovation and Regulatory Support Driving Market Growth

Rising pharmaceutical innovation is a primary growth catalyst for the PARP inhibitor market. Continuous investment in clinical trials exploring combination therapies with immunotherapy, chemotherapy, and novel agents is broadening treatment options and patient populations. Regulatory agencies are providing accelerated pathways and wider approvals, facilitating faster market access. Manufacturers offering robust clinical evidence and improved drug profiles, such as reduced side effects and enhanced potency, stand to capture sustained demand.

Advancements in Combination Therapies and Precision Oncology

Integration of combination regimens and companion diagnostic testing further enhances market expansion opportunities. The development of next-generation PARP inhibitors with improved selectivity and efficacy, combined with advancements in genomic testing, is optimizing therapeutic outcomes. These trends underscore the evolving paradigm of precision oncology, positioning PARP inhibitors as vital, growing pillars in modern cancer treatment with strong regulatory and clinical support.
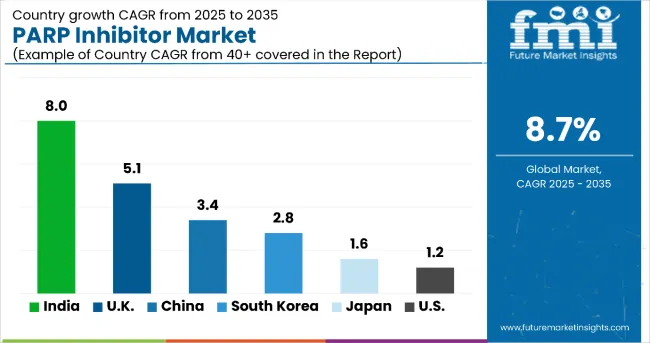
PARP Inhibitor Market Analysis by Key Countries

Parp Inhibitors Market By Country

Country CAGR (%)
India 8.0
United Kingdom 5.1
China 3.4
South Korea 2.8
Japan 1.6
United States 1.2

The market shows diverse growth across countries. India leads with an 8% CAGR driven by expanding healthcare access and rising cancer awareness. The UK follows at 5.1%, supported by strong NHS backing and advanced biomarker testing. China and Germany both grow steadily around 3-3.4%, fueled by healthcare investments and regulatory reforms. South Korea has moderate growth at 2.8%, backed by government initiatives and insurance coverage expansion. Japan’s market grows modestly at 1.6% due to regulatory strictness and an aging population. The US shows the slowest growth at 1.2%, influenced by market maturity and high treatment costs, despite being an innovation leader.

The report covers an in-depth analysis of 40+ countries; six top-performing OECD countries are highlighted below.

Growth Dynamics in PARP Inhibitor Market in the United Kingdom

Revenue from PARP inhibitor in the United Kingdom is expanding steadily with a CAGR of 5.1%. The NHS’s emphasis on advanced targeted cancer therapies and early diagnosis programs supports robust market growth. Access to innovative biomarker testing has improved patient stratification, enhancing treatment effectiveness and growing therapy adoption. Regulatory agility and reimbursement frameworks facilitate faster approvals and patient access. Strong collaboration between pharmaceutical companies and healthcare providers accelerates clinical trial activities. Increasing public and physician awareness about precision oncology also drives demand. Investments in personalized medicine infrastructure have strengthened treatment delivery. Overall, the UK market remains a vital hub for PARP inhibitor innovation and deployment.

  • Strong NHS support for targeted cancer therapies.
  • Rising investment in biomarker and genomic testing.
  • Expanding patient pool with early diagnosis programs.

Output Expansion in PARP Inhibitor Market in China

Demand for PARP inhibitor in China is projected to grow at a CAGR of 3.4%, fueled by expanding healthcare infrastructure and rising cancer incidence. Government policies encouraging domestic innovation and importation of novel therapies support increasing availability. The growing middle class with enhanced healthcare affordability stimulates demand for advanced oncology treatments. Improvements in diagnostic capabilities and wider access to genomic testing facilitate personalized treatment adoption. Expansion of cancer care centers across urban and rural regions enhances patient reach. Investments from key pharmaceutical players are scaling manufacturing and clinical development. Regulatory reforms accelerate market entry for new PARP inhibitors. These factors collectively drive steady output expansion in the Chinese PARP inhibitor market.

  • Large patient base with increasing cancer incidence.
  • Enhanced healthcare reimbursement policies.
  • Growing adoption of genetic testing and personalized therapies.

Structural Adoption in PARP Inhibitor Market in South Korea

Demand for PARP inhibitor in South Korea is growing at a CAGR of 2.8%, marked by high adoption within an advanced healthcare framework. Government initiatives focusing on innovation in cancer treatment emphasize early detection and targeted therapies. Pharmaceutical collaborations with research institutions enhance clinical trial success rates and drug development. Availability of companion diagnostic tests optimizes patient selection, bolstering treatment outcomes. Insurance coverage improvements allow broader patient access to PARP inhibitors. Aging demographics increase cancer patient populations, creating demand growth. Digital health solutions aid patient monitoring and compliance. These structural developments position South Korea’s market for steady expansion.

  • Supportive governmental cancer control programs.
  • Strong collaboration between pharma and research institutes.
  • Expanding health insurance coverage for targeted therapies.

Regulatory and Demand Trends in PARP Inhibitor Market in Japan

Demand for PARP inhibitor in Japan demonstrates moderate growth at 1.6% CAGR, shaped by stringent regulatory standards alongside strong demand driven by an aging population. The country’s meticulous approval process ensures drug safety and efficacy, fostering clinician confidence. Increasing use of precision oncology and biomarker testing enhances targeted treatment utilization. High healthcare standards and insurance coverage support consistent patient access. Pharmaceutical companies focus on innovation in drug delivery and combination therapies to meet evolving treatment needs. Research investments by domestic firms underpin ongoing market development. Patient awareness campaigns promote earlier diagnosis, further supporting the market. These dynamics contribute to a balanced growth trajectory for Japan’s PARP inhibitor sector.

  • Rigorous drug approval and safety protocols.
  • Growing emphasis on personalized cancer therapies.
  • Aging population drives oncology demand.

Expansion Patterns in PARP Inhibitor Market in the United States

Revenue from PARP inhibitor in the USA, with a CAGR of 1.2%, is characterized by extensive pharmaceutical research and widespread adoption of precision medicine. High investment in clinical trials drives innovation in combination therapies and next-generation PARP inhibitors. Advanced genomic testing facilitates effective patient stratification, improving therapeutic outcomes. Despite high treatment costs and regulatory complexities moderating rapid uptake, reimbursement programs enable access for many patients. Increasing collaboration between biotech startups and large pharma accelerates drug development pipelines. Growing awareness among oncologists and patients supports market growth. Digital health technologies improve patient adherence and monitoring. This expansion pattern highlights the US as a crucial, dynamic market for PARP inhibitors.

  • Leading global pharmaceutical R&D hub.
  • Extensive clinical trials and approvals.
  • Growing use of combination therapies.

Output Surge in PARP Inhibitor Market in India

Revenue from PARP inhibitor in India is experiencing rapid growth with an estimated CAGR of 8%, driven by expanding healthcare infrastructure and increasing cancer awareness. Rising government healthcare initiatives promote early detection and personalized medicine adoption. Greater availability of genomic testing and diagnostic facilities supports precision oncology treatments. Growing affordability and insurance penetration increase patient access to PARP inhibitors. Pharmaceutical companies are expanding local production capacities and clinical trial activity to meet demand. Increased collaboration with global firms enhances technology transfer and innovation. The rise of oncology specialty centers across urban and semi-urban areas increases treatment reach. These factors collectively fuel a surge in market output and expansion.
  • Rapidly expanding oncology care facilities.
  • Increasing public and private healthcare investment.
  • Growing genetic testing and personalized medicine awareness.

Competitive Landscape of the PARP Inhibitor Market

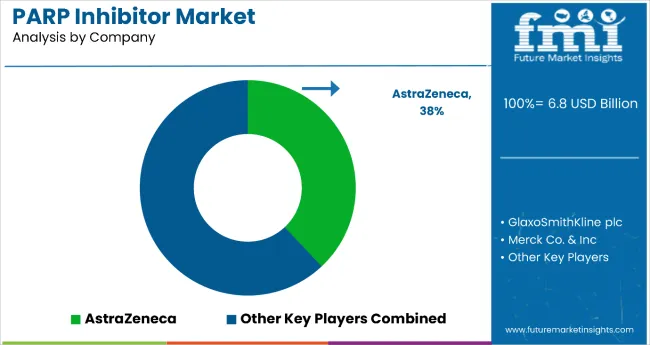
Parp Inhibitors Market By Company

The market is characterized by the dominance of well-established pharmaceutical giants alongside emerging innovative companies. AstraZeneca leads the market, primarily due to its flagship drug Olaparib, which holds the largest market share owing to broad regulatory approvals and extensive clinical evidence supporting its efficacy across multiple cancer types. Other key players include GlaxoSmithKline plc, Merck & Co., Inc., AbbVie Inc, and Clovis Oncology, all of which actively invest in research and development to expand indications and improve drug formulations.

These companies leverage robust global marketing networks, extensive clinical trial pipelines, and strategic collaborations with diagnostic firms to advance companion biomarker testing, enhancing patient selection and treatment outcomes. Additionally, emerging startups and smaller biotech firms are driving innovation by developing next-generation PARP inhibitors with improved selectivity, potency, and safety profiles, targeting resistant or rare cancer types.

Report Scope - PARP Inhibitor Market

Items Values
Quantitative Units (2025) USD 6.8 billion
Drug Type Olaparib, Niraparib, Rucaparib, Talazoparib
Indication Ovarian Cancer, Breast Cancer, Prostate Cancer, Pancreatic Cancer
Distribution Channel Hospital Pharmacies, Retail Pharmacies, Online Pharmacies
Regions Covered North America, Latin America, Western Europe, Eastern Europe, South Asia and Pacific, East Asia, Middle East & Africa
Countries Covered United States, United Kingdom, Germany, China, India, Japan, South Korea, France, Canada, Brazil, Australia, and 40+ countries
Key Companies Profiled AstraZeneca PLC, GlaxoSmithKline plc, Merck & Co., AbbVie Inc., Clovis Oncology, Tesaro , Pfizer Inc., Janssen Pharmaceuticals
Additional Attributes Dollar sales segmented by drug type and indication, growing adoption of precision oncology, expansion of companion diagnostic testing, increasing use of combination therapies, evolving regulatory approvals, and rising patient awareness of personalized treatment strategies

Key Segmentation

By Drug Type:

  • Olaparib
  • Niraparib
  • Rucaparib
  • Talazoparib

By Indication:

  • Ovarian Cancer
  • Breast Cancer
  • Prostate Cancer
  • Pancreatic Cancer

By Distribution Channel:

  • Hospital Pharmacies
  • Retail Pharmacies
  • Online Pharmacies

By Region:

  • North America
  • Latin America
  • Europe
  • East Asia
  • South Asia
  • Oceania
  • Middle East and Africa

Table of Content

  1. Executive Summary
    • Global Market Outlook
    • Demand-side Trends
    • Supply-side Trends
    • Technology Roadmap Analysis
    • Analysis and Recommendations
  2. Market Overview
    • Market Coverage / Taxonomy
    • Market Definition / Scope / Limitations
  3. Market Background
    • Market Dynamics
      • Drivers
      • Restraints
      • Opportunity
      • Trends
    • Scenario Forecast
      • Demand in Optimistic Scenario
      • Demand in Likely Scenario
      • Demand in Conservative Scenario
    • Opportunity Map Analysis
    • Product Life Cycle Analysis
    • Supply Chain Analysis
      • Supply Side Participants and their Roles
        • Producers
        • Mid-Level Participants (Traders/ Agents/ Brokers)
        • Wholesalers and Distributors
      • Value Added and Value Created at Node in the Supply Chain
      • List of Raw Material Suppliers
      • List of Existing and Potential Buyer’s
    • Investment Feasibility Matrix
    • Value Chain Analysis
      • Profit Margin Analysis
      • Wholesalers and Distributors
      • Retailers
    • PESTLE and Porter’s Analysis
    • Regulatory Landscape
      • By Key Regions
      • By Key Countries
    • Regional Parent Market Outlook
    • Production and Consumption Statistics
    • Import and Export Statistics
  4. Global Market Analysis 2020 to 2024 and Forecast, 2025 to 2035
    • Historical Market Size Value (USD Billion) & Volume (Metric Tons) Analysis, 2020 to 2024
    • Current and Future Market Size Value (USD Billion) & Volume (Metric Tons) Projections, 2025 to 2035
      • Y-o-Y Growth Trend Analysis
      • Absolute $ Opportunity Analysis
  5. Global Market Pricing Analysis 2020 to 2024 and Forecast 2025 to 2035
  6. Global Market Analysis 2020 to 2024 and Forecast 2025 to 2035, By Drug Type
    • Introduction / Key Findings
    • Historical Market Size Value (USD Billion) & Volume (Metric Tons) Analysis By Drug Type, 2020 to 2024
    • Current and Future Market Size Value (USD Billion) & Volume (Metric Tons) Analysis and Forecast By Drug Type, 2025 to 2035
      • Olaparib
      • Niraparib
      • Rucaparib
      • Talazoparib
    • Y-o-Y Growth Trend Analysis By Drug Type, 2020 to 2024
    • Absolute $ Opportunity Analysis By Drug Type, 2025 to 2035
  7. Global Market Analysis 2020 to 2024 and Forecast 2025 to 2035, By Indication
    • Introduction / Key Findings
    • Historical Market Size Value (USD Billion) & Volume (Metric Tons) Analysis By Indication, 2020 to 2024
    • Current and Future Market Size Value (USD Billion) & Volume (Metric Tons) Analysis and Forecast By Indication, 2025 to 2035
      • Ovarian Cancer
      • Breast Cancer
      • Prostate Cancer
      • Pancreatic Cancer
    • Y-o-Y Growth Trend Analysis By Indication, 2020 to 2024
    • Absolute $ Opportunity Analysis By Indication, 2025 to 2035
  8. Global Market Analysis 2020 to 2024 and Forecast 2025 to 2035, By Distribution Channel
    • Introduction / Key Findings
    • Historical Market Size Value (USD Billion) & Volume (Metric Tons) Analysis By Distribution Channel, 2020 to 2024
    • Current and Future Market Size Value (USD Billion) & Volume (Metric Tons) Analysis and Forecast By Distribution Channel, 2025 to 2035
      • Hospital Pharmacies
      • Retail Pharmacies
      • Online Pharmacies
    • Y-o-Y Growth Trend Analysis By Distribution Channel, 2020 to 2024
    • Absolute $ Opportunity Analysis By Distribution Channel, 2025 to 2035
  9. Global Market Analysis 2020 to 2024 and Forecast 2025 to 2035, By Region
    • Introduction
    • Historical Market Size Value (USD Billion) & Volume (Metric Tons) Analysis By Region, 2020 to 2024
    • Current Market Size Value (USD Billion) & Volume (Metric Tons) Analysis and Forecast By Region, 2025 to 2035
      • North America
      • Latin America
      • Western Europe
      • Eastern Europe
      • East Asia
      • South Asia & Pacific
      • Middle East and Africa
    • Market Attractiveness Analysis By Region
  10. North America Market Analysis 2020 to 2024 and Forecast 2025 to 2035, By Country
    • Historical Market Size Value (USD Billion) & Volume (Metric Tons) Trend Analysis By Market Taxonomy, 2020 to 2024
    • Market Size Value (USD Billion) & Volume (Metric Tons) Forecast By Market Taxonomy, 2025 to 2035
      • By Country
        • USA
        • Canada
        • Mexico
      • By Drug Type
      • By Indication
      • By Distribution Channel
    • Market Attractiveness Analysis
      • By Country
      • By Drug Type
      • By Indication
      • By Distribution Channel
    • Key Takeaways
  11. Latin America Market Analysis 2020 to 2024 and Forecast 2025 to 2035, By Country
    • Historical Market Size Value (USD Billion) & Volume (Metric Tons) Trend Analysis By Market Taxonomy, 2020 to 2024
    • Market Size Value (USD Billion) & Volume (Metric Tons) Forecast By Market Taxonomy, 2025 to 2035
      • By Country
        • Brazil
        • Argentina
        • Rest of LATAM
      • By Drug Type
      • By Indication
      • By Distribution Channel
    • Market Attractiveness Analysis
      • By Country
      • By Drug Type
      • By Indication
      • By Distribution Channel
    • Key Takeaways
  12. Western Europe Market Analysis 2020 to 2024 and Forecast 2025 to 2035, By Country
    • Historical Market Size Value (USD Billion) & Volume (Metric Tons) Trend Analysis By Market Taxonomy, 2020 to 2024
    • Market Size Value (USD Billion) & Volume (Metric Tons) Forecast By Market Taxonomy, 2025 to 2035
      • By Country
        • Germany
        • Italy
        • France
        • UK
        • Spain
        • BENELUX
        • Nordic
        • Rest of W.Europe
      • By Drug Type
      • By Indication
      • By Distribution Channel
    • Market Attractiveness Analysis
      • By Country
      • By Drug Type
      • By Indication
      • By Distribution Channel
    • Key Takeaways
  13. Eastern Europe Market Analysis 2020 to 2024 and Forecast 2025 to 2035, By Country
    • Historical Market Size Value (USD Billion) & Volume (Metric Tons) Trend Analysis By Market Taxonomy, 2020 to 2024
    • Market Size Value (USD Billion) & Volume (Metric Tons) Forecast By Market Taxonomy, 2025 to 2035
      • By Country
        • Russia
        • Hungary
        • Poland
        • Balkan & Baltics
        • Rest of E. Europe
      • By Drug Type
      • By Indication
      • By Distribution Channel
    • Market Attractiveness Analysis
      • By Country
      • By Drug Type
      • By Indication
      • By Distribution Channel
    • Key Takeaways
  14. East Asia Market Analysis 2020 to 2024 and Forecast 2025 to 2035, By Country
    • Historical Market Size Value (USD Billion) & Volume (Metric Tons) Trend Analysis By Market Taxonomy, 2020 to 2024
    • Market Size Value (USD Billion) & Volume (Metric Tons) Forecast By Market Taxonomy, 2025 to 2035
      • By Country
        • China
        • Japan
        • South Korea
      • By Drug Type
      • By Indication
      • By Distribution Channel
    • Market Attractiveness Analysis
      • By Country
      • By Drug Type
      • By Indication
      • By Distribution Channel
    • Key Takeaways
  15. South Asia & Pacific Market Analysis 2020 to 2024 and Forecast 2025 to 2035, By Country
    • Historical Market Size Value (USD Billion) & Volume (Metric Tons) Trend Analysis By Market Taxonomy, 2020 to 2024
    • Market Size Value (USD Billion) & Volume (Metric Tons) Forecast By Market Taxonomy, 2025 to 2035
      • By Country
        • India
        • Australia & New Zealand
        • ASEAN
        • Rest of SAP
      • By Drug Type
      • By Indication
      • By Distribution Channel
    • Market Attractiveness Analysis
      • By Country
      • By Drug Type
      • By Indication
      • By Distribution Channel
    • Key Takeaways
  16. Middle East and Africa Market Analysis 2020 to 2024 and Forecast 2025 to 2035, By Country
    • Historical Market Size Value (USD Billion) & Volume (Metric Tons) Trend Analysis By Market Taxonomy, 2020 to 2024
    • Market Size Value (USD Billion) & Volume (Metric Tons) Forecast By Market Taxonomy, 2025 to 2035
      • By Country
        • GCC Countries
        • Northern Africa
        • South Africa
        • Turkiye
        • Rest of MEA
      • By Drug Type
      • By Indication
      • By Distribution Channel
    • Market Attractiveness Analysis
      • By Country
      • By Drug Type
      • By Indication
      • By Distribution Channel
    • Key Takeaways
  17. Key Countries Market Analysis
    • USA
      • Pricing Analysis
      • Market Share Analysis, 2024
        • By Drug Type
        • By Indication
        • By Distribution Channel
    • Canada
      • Pricing Analysis
      • Market Share Analysis, 2024
        • By Drug Type
        • By Indication
        • By Distribution Channel
    • Brazil
      • Pricing Analysis
      • Market Share Analysis, 2024
        • By Drug Type
        • By Indication
        • By Distribution Channel
    • Mexico
      • Pricing Analysis
      • Market Share Analysis, 2024
        • By Drug Type
        • By Indication
        • By Distribution Channel
    • Argentina
      • Pricing Analysis
      • Market Share Analysis, 2024
        • By Drug Type
        • By Indication
        • By Distribution Channel
  18. Market Structure Analysis
    • Competition Dashboard
    • Competition Benchmarking
    • Market Share Analysis of Top Players
      • By Regional
      • By Drug Type
      • By Indication
      • By Distribution Channel
  19. Competition Analysis
    • Competition Deep Dive
      • AstraZeneca
        • Overview
        • Product Portfolio
        • Profitability by Market Segments (Product/Age /Sales Channel/Region)
        • Sales Footprint
        • Strategy Overview
          • Marketing Strategy
          • Product Strategy
          • Channel Strategy
      • GlaxoSmithKline plc
        • Overview
        • Product Portfolio
        • Profitability by Market Segments (Product/Age /Sales Channel/Region)
        • Sales Footprint
        • Strategy Overview
          • Marketing Strategy
          • Product Strategy
          • Channel Strategy
      • AbbVie Inc
        • Overview
        • Product Portfolio
        • Profitability by Market Segments (Product/Age /Sales Channel/Region)
        • Sales Footprint
        • Strategy Overview
          • Marketing Strategy
          • Product Strategy
          • Channel Strategy
      • Merck & Co., Inc.
        • Overview
        • Product Portfolio
        • Profitability by Market Segments (Product/Age /Sales Channel/Region)
        • Sales Footprint
        • Strategy Overview
          • Marketing Strategy
          • Product Strategy
          • Channel Strategy
      • Clovis Oncology
        • Overview
        • Product Portfolio
        • Profitability by Market Segments (Product/Age /Sales Channel/Region)
        • Sales Footprint
        • Strategy Overview
          • Marketing Strategy
          • Product Strategy
          • Channel Strategy
      • Johnson & Johnson Services, Inc
        • Overview
        • Product Portfolio
        • Profitability by Market Segments (Product/Age /Sales Channel/Region)
        • Sales Footprint
        • Strategy Overview
          • Marketing Strategy
          • Product Strategy
          • Channel Strategy
      • Pfizer Inc.
        • Overview
        • Product Portfolio
        • Profitability by Market Segments (Product/Age /Sales Channel/Region)
        • Sales Footprint
        • Strategy Overview
          • Marketing Strategy
          • Product Strategy
          • Channel Strategy
      • Genentech, Inc.
        • Overview
        • Product Portfolio
        • Profitability by Market Segments (Product/Age /Sales Channel/Region)
        • Sales Footprint
        • Strategy Overview
          • Marketing Strategy
          • Product Strategy
          • Channel Strategy
      • Artios Pharma
        • Overview
        • Product Portfolio
        • Profitability by Market Segments (Product/Age /Sales Channel/Region)
        • Sales Footprint
        • Strategy Overview
          • Marketing Strategy
          • Product Strategy
          • Channel Strategy
      • Sierra Oncology, Inc.
        • Overview
        • Product Portfolio
        • Profitability by Market Segments (Product/Age /Sales Channel/Region)
        • Sales Footprint
        • Strategy Overview
          • Marketing Strategy
          • Product Strategy
          • Channel Strategy
      • Karyopharm Therapeutics Inc.
        • Overview
        • Product Portfolio
        • Profitability by Market Segments (Product/Age /Sales Channel/Region)
        • Sales Footprint
        • Strategy Overview
          • Marketing Strategy
          • Product Strategy
          • Channel Strategy
  20. Assumptions & Acronyms Used
  21. Research Methodology

List of Tables

  • Table 1: Global Market Value (USD Billion) Forecast by Region, 2020-2035
  • Table 2: Global Market Volume (Metric Tons) Forecast by Region, 2020-2035
  • Table 3: Global Market Value (USD Billion) Forecast by Drug Type, 2020-2035
  • Table 4: Global Market Volume (Metric Tons) Forecast by Drug Type, 2020-2035
  • Table 5: Global Market Value (USD Billion) Forecast by Indication, 2020-2035
  • Table 6: Global Market Volume (Metric Tons) Forecast by Indication, 2020-2035
  • Table 7: Global Market Value (USD Billion) Forecast by Distribution Channel, 2020-2035
  • Table 8: Global Market Volume (Metric Tons) Forecast by Distribution Channel, 2020-2035
  • Table 9: North America Market Value (USD Billion) Forecast by Country, 2020-2035
  • Table 10: North America Market Volume (Metric Tons) Forecast by Country, 2020-2035
  • Table 11: North America Market Value (USD Billion) Forecast by Drug Type, 2020-2035
  • Table 12: North America Market Volume (Metric Tons) Forecast by Drug Type, 2020-2035
  • Table 13: North America Market Value (USD Billion) Forecast by Indication, 2020-2035
  • Table 14: North America Market Volume (Metric Tons) Forecast by Indication, 2020-2035
  • Table 15: North America Market Value (USD Billion) Forecast by Distribution Channel, 2020-2035
  • Table 16: North America Market Volume (Metric Tons) Forecast by Distribution Channel, 2020-2035
  • Table 17: Latin America Market Value (USD Billion) Forecast by Country, 2020-2035
  • Table 18: Latin America Market Volume (Metric Tons) Forecast by Country, 2020-2035
  • Table 19: Latin America Market Value (USD Billion) Forecast by Drug Type, 2020-2035
  • Table 20: Latin America Market Volume (Metric Tons) Forecast by Drug Type, 2020-2035
  • Table 21: Latin America Market Value (USD Billion) Forecast by Indication, 2020-2035
  • Table 22: Latin America Market Volume (Metric Tons) Forecast by Indication, 2020-2035
  • Table 23: Latin America Market Value (USD Billion) Forecast by Distribution Channel, 2020-2035
  • Table 24: Latin America Market Volume (Metric Tons) Forecast by Distribution Channel, 2020-2035
  • Table 25: Western Europe Market Value (USD Billion) Forecast by Country, 2020-2035
  • Table 26: Western Europe Market Volume (Metric Tons) Forecast by Country, 2020-2035
  • Table 27: Western Europe Market Value (USD Billion) Forecast by Drug Type, 2020-2035
  • Table 28: Western Europe Market Volume (Metric Tons) Forecast by Drug Type, 2020-2035
  • Table 29: Western Europe Market Value (USD Billion) Forecast by Indication, 2020-2035
  • Table 30: Western Europe Market Volume (Metric Tons) Forecast by Indication, 2020-2035
  • Table 31: Western Europe Market Value (USD Billion) Forecast by Distribution Channel, 2020-2035
  • Table 32: Western Europe Market Volume (Metric Tons) Forecast by Distribution Channel, 2020-2035
  • Table 33: Eastern Europe Market Value (USD Billion) Forecast by Country, 2020-2035
  • Table 34: Eastern Europe Market Volume (Metric Tons) Forecast by Country, 2020-2035
  • Table 35: Eastern Europe Market Value (USD Billion) Forecast by Drug Type, 2020-2035
  • Table 36: Eastern Europe Market Volume (Metric Tons) Forecast by Drug Type, 2020-2035
  • Table 37: Eastern Europe Market Value (USD Billion) Forecast by Indication, 2020-2035
  • Table 38: Eastern Europe Market Volume (Metric Tons) Forecast by Indication, 2020-2035
  • Table 39: Eastern Europe Market Value (USD Billion) Forecast by Distribution Channel, 2020-2035
  • Table 40: Eastern Europe Market Volume (Metric Tons) Forecast by Distribution Channel, 2020-2035
  • Table 41: East Asia Market Value (USD Billion) Forecast by Country, 2020-2035
  • Table 42: East Asia Market Volume (Metric Tons) Forecast by Country, 2020-2035
  • Table 43: East Asia Market Value (USD Billion) Forecast by Drug Type, 2020-2035
  • Table 44: East Asia Market Volume (Metric Tons) Forecast by Drug Type, 2020-2035
  • Table 45: East Asia Market Value (USD Billion) Forecast by Indication, 2020-2035
  • Table 46: East Asia Market Volume (Metric Tons) Forecast by Indication, 2020-2035
  • Table 47: East Asia Market Value (USD Billion) Forecast by Distribution Channel, 2020-2035
  • Table 48: East Asia Market Volume (Metric Tons) Forecast by Distribution Channel, 2020-2035
  • Table 49: South Asia & Pacific Market Value (USD Billion) Forecast by Country, 2020-2035
  • Table 50: South Asia & Pacific Market Volume (Metric Tons) Forecast by Country, 2020-2035
  • Table 51: South Asia & Pacific Market Value (USD Billion) Forecast by Drug Type, 2020-2035
  • Table 52: South Asia & Pacific Market Volume (Metric Tons) Forecast by Drug Type, 2020-2035
  • Table 53: South Asia & Pacific Market Value (USD Billion) Forecast by Indication, 2020-2035
  • Table 54: South Asia & Pacific Market Volume (Metric Tons) Forecast by Indication, 2020-2035
  • Table 55: South Asia & Pacific Market Value (USD Billion) Forecast by Distribution Channel, 2020-2035
  • Table 56: South Asia & Pacific Market Volume (Metric Tons) Forecast by Distribution Channel, 2020-2035
  • Table 57: Middle East and Africa Market Value (USD Billion) Forecast by Country, 2020-2035
  • Table 58: Middle East and Africa Market Volume (Metric Tons) Forecast by Country, 2020-2035
  • Table 59: Middle East and Africa Market Value (USD Billion) Forecast by Drug Type, 2020-2035
  • Table 60: Middle East and Africa Market Volume (Metric Tons) Forecast by Drug Type, 2020-2035
  • Table 61: Middle East and Africa Market Value (USD Billion) Forecast by Indication, 2020-2035
  • Table 62: Middle East and Africa Market Volume (Metric Tons) Forecast by Indication, 2020-2035
  • Table 63: Middle East and Africa Market Value (USD Billion) Forecast by Distribution Channel, 2020-2035
  • Table 64: Middle East and Africa Market Volume (Metric Tons) Forecast by Distribution Channel, 2020-2035

List of Figures

  • Figure 1: Global Market Volume (Metric Tons) Forecast 2020-2035
  • Figure 2: Global Market Pricing Analysis
  • Figure 3: Global Market Value (USD Billion) Forecast 2020-2035
  • Figure 4: Global Market Value Share and BPS Analysis by Drug Type, 2025 and 2035
  • Figure 5: Global Market Y-o-Y Growth Comparison by Drug Type, 2025-2035
  • Figure 6: Global Market Attractiveness Analysis by Drug Type
  • Figure 7: Global Market Value Share and BPS Analysis by Indication, 2025 and 2035
  • Figure 8: Global Market Y-o-Y Growth Comparison by Indication, 2025-2035
  • Figure 9: Global Market Attractiveness Analysis by Indication
  • Figure 10: Global Market Value Share and BPS Analysis by Distribution Channel, 2025 and 2035
  • Figure 11: Global Market Y-o-Y Growth Comparison by Distribution Channel, 2025-2035
  • Figure 12: Global Market Attractiveness Analysis by Distribution Channel
  • Figure 13: Global Market Value (USD Billion) Share and BPS Analysis by Region, 2025 and 2035
  • Figure 14: Global Market Y-o-Y Growth Comparison by Region, 2025-2035
  • Figure 15: Global Market Attractiveness Analysis by Region
  • Figure 16: North America Market Incremental $ Opportunity, 2025-2035
  • Figure 17: Latin America Market Incremental $ Opportunity, 2025-2035
  • Figure 18: Western Europe Market Incremental $ Opportunity, 2025-2035
  • Figure 19: Eastern Europe Market Incremental $ Opportunity, 2025-2035
  • Figure 20: East Asia Market Incremental $ Opportunity, 2025-2035
  • Figure 21: South Asia & Pacific Market Incremental $ Opportunity, 2025-2035
  • Figure 22: Middle East and Africa Market Incremental $ Opportunity, 2025-2035
  • Figure 23: North America Market Value Share and BPS Analysis by Country, 2025 and 2035
  • Figure 24: North America Market Value Share and BPS Analysis by Drug Type, 2025 and 2035
  • Figure 25: North America Market Y-o-Y Growth Comparison by Drug Type, 2025-2035
  • Figure 26: North America Market Attractiveness Analysis by Drug Type
  • Figure 27: North America Market Value Share and BPS Analysis by Indication, 2025 and 2035
  • Figure 28: North America Market Y-o-Y Growth Comparison by Indication, 2025-2035
  • Figure 29: North America Market Attractiveness Analysis by Indication
  • Figure 30: North America Market Value Share and BPS Analysis by Distribution Channel, 2025 and 2035
  • Figure 31: North America Market Y-o-Y Growth Comparison by Distribution Channel, 2025-2035
  • Figure 32: North America Market Attractiveness Analysis by Distribution Channel
  • Figure 33: Latin America Market Value Share and BPS Analysis by Country, 2025 and 2035
  • Figure 34: Latin America Market Value Share and BPS Analysis by Drug Type, 2025 and 2035
  • Figure 35: Latin America Market Y-o-Y Growth Comparison by Drug Type, 2025-2035
  • Figure 36: Latin America Market Attractiveness Analysis by Drug Type
  • Figure 37: Latin America Market Value Share and BPS Analysis by Indication, 2025 and 2035
  • Figure 38: Latin America Market Y-o-Y Growth Comparison by Indication, 2025-2035
  • Figure 39: Latin America Market Attractiveness Analysis by Indication
  • Figure 40: Latin America Market Value Share and BPS Analysis by Distribution Channel, 2025 and 2035
  • Figure 41: Latin America Market Y-o-Y Growth Comparison by Distribution Channel, 2025-2035
  • Figure 42: Latin America Market Attractiveness Analysis by Distribution Channel
  • Figure 43: Western Europe Market Value Share and BPS Analysis by Country, 2025 and 2035
  • Figure 44: Western Europe Market Value Share and BPS Analysis by Drug Type, 2025 and 2035
  • Figure 45: Western Europe Market Y-o-Y Growth Comparison by Drug Type, 2025-2035
  • Figure 46: Western Europe Market Attractiveness Analysis by Drug Type
  • Figure 47: Western Europe Market Value Share and BPS Analysis by Indication, 2025 and 2035
  • Figure 48: Western Europe Market Y-o-Y Growth Comparison by Indication, 2025-2035
  • Figure 49: Western Europe Market Attractiveness Analysis by Indication
  • Figure 50: Western Europe Market Value Share and BPS Analysis by Distribution Channel, 2025 and 2035
  • Figure 51: Western Europe Market Y-o-Y Growth Comparison by Distribution Channel, 2025-2035
  • Figure 52: Western Europe Market Attractiveness Analysis by Distribution Channel
  • Figure 53: Eastern Europe Market Value Share and BPS Analysis by Country, 2025 and 2035
  • Figure 54: Eastern Europe Market Value Share and BPS Analysis by Drug Type, 2025 and 2035
  • Figure 55: Eastern Europe Market Y-o-Y Growth Comparison by Drug Type, 2025-2035
  • Figure 56: Eastern Europe Market Attractiveness Analysis by Drug Type
  • Figure 57: Eastern Europe Market Value Share and BPS Analysis by Indication, 2025 and 2035
  • Figure 58: Eastern Europe Market Y-o-Y Growth Comparison by Indication, 2025-2035
  • Figure 59: Eastern Europe Market Attractiveness Analysis by Indication
  • Figure 60: Eastern Europe Market Value Share and BPS Analysis by Distribution Channel, 2025 and 2035
  • Figure 61: Eastern Europe Market Y-o-Y Growth Comparison by Distribution Channel, 2025-2035
  • Figure 62: Eastern Europe Market Attractiveness Analysis by Distribution Channel
  • Figure 63: East Asia Market Value Share and BPS Analysis by Country, 2025 and 2035
  • Figure 64: East Asia Market Value Share and BPS Analysis by Drug Type, 2025 and 2035
  • Figure 65: East Asia Market Y-o-Y Growth Comparison by Drug Type, 2025-2035
  • Figure 66: East Asia Market Attractiveness Analysis by Drug Type
  • Figure 67: East Asia Market Value Share and BPS Analysis by Indication, 2025 and 2035
  • Figure 68: East Asia Market Y-o-Y Growth Comparison by Indication, 2025-2035
  • Figure 69: East Asia Market Attractiveness Analysis by Indication
  • Figure 70: East Asia Market Value Share and BPS Analysis by Distribution Channel, 2025 and 2035
  • Figure 71: East Asia Market Y-o-Y Growth Comparison by Distribution Channel, 2025-2035
  • Figure 72: East Asia Market Attractiveness Analysis by Distribution Channel
  • Figure 73: South Asia & Pacific Market Value Share and BPS Analysis by Country, 2025 and 2035
  • Figure 74: South Asia & Pacific Market Value Share and BPS Analysis by Drug Type, 2025 and 2035
  • Figure 75: South Asia & Pacific Market Y-o-Y Growth Comparison by Drug Type, 2025-2035
  • Figure 76: South Asia & Pacific Market Attractiveness Analysis by Drug Type
  • Figure 77: South Asia & Pacific Market Value Share and BPS Analysis by Indication, 2025 and 2035
  • Figure 78: South Asia & Pacific Market Y-o-Y Growth Comparison by Indication, 2025-2035
  • Figure 79: South Asia & Pacific Market Attractiveness Analysis by Indication
  • Figure 80: South Asia & Pacific Market Value Share and BPS Analysis by Distribution Channel, 2025 and 2035
  • Figure 81: South Asia & Pacific Market Y-o-Y Growth Comparison by Distribution Channel, 2025-2035
  • Figure 82: South Asia & Pacific Market Attractiveness Analysis by Distribution Channel
  • Figure 83: Middle East and Africa Market Value Share and BPS Analysis by Country, 2025 and 2035
  • Figure 84: Middle East and Africa Market Value Share and BPS Analysis by Drug Type, 2025 and 2035
  • Figure 85: Middle East and Africa Market Y-o-Y Growth Comparison by Drug Type, 2025-2035
  • Figure 86: Middle East and Africa Market Attractiveness Analysis by Drug Type
  • Figure 87: Middle East and Africa Market Value Share and BPS Analysis by Indication, 2025 and 2035
  • Figure 88: Middle East and Africa Market Y-o-Y Growth Comparison by Indication, 2025-2035
  • Figure 89: Middle East and Africa Market Attractiveness Analysis by Indication
  • Figure 90: Middle East and Africa Market Value Share and BPS Analysis by Distribution Channel, 2025 and 2035
  • Figure 91: Middle East and Africa Market Y-o-Y Growth Comparison by Distribution Channel, 2025-2035
  • Figure 92: Middle East and Africa Market Attractiveness Analysis by Distribution Channel
  • Figure 93: Global Market - Tier Structure Analysis
  • Figure 94: Global Market - Company Share Analysis

Frequently Asked Questions

How big is the PARP inhibitor market in 2025?

The global PARP inhibitor market is estimated to be valued at USD 6.8 billion in 2025.

What will be the size of the PARP inhibitor market in 2035?

The market size for PARP inhibitors is projected to reach USD 15.7 billion by 2035.

How much will be the PARP inhibitor market growth between 2025 and 2035?

The PARP inhibitor market is expected to grow at an 8.7% CAGR between 2025 and 2035.

Which drug type is projected to lead in the PARP inhibitor market in 2025?

Olaparib is projected to lead in the PARP inhibitor market with 86.2% market share in 2025.

Which indication segment is expected to contribute a significant share in the PARP inhibitor market in 2025?

In terms of indication, ovarian cancer is projected to command 83.9% share in the PARP inhibitor market in 2025.

Explore Similar Insights

Future Market Insights

PARP Inhibitor Market

Chat With

MaRIA

Hi There, I am MaRIA, Your Market Research Intelligence Assistant. How may I help you?