The PCSK9 inhibitor market is expanding significantly, driven by the growing prevalence of cardiovascular disorders and hypercholesterolemia worldwide. Increasing clinical validation of PCSK9 inhibition as an effective therapeutic pathway for patients unresponsive to statins has strengthened its clinical relevance.
The market benefits from ongoing innovation in biologics, improved patient adherence through extended dosing intervals, and the rising focus on precision lipid management. Regulatory approvals across major regions and positive real-world efficacy outcomes have reinforced market penetration among both specialty and general care providers.
Additionally, the aging global population and the growing incidence of lifestyle-induced hyperlipidemia are driving steady prescription growth. With increased accessibility through reimbursement support and biosimilar development, the PCSK9 inhibitor market is expected to sustain its growth momentum, supported by advancements in formulation technologies and expanding indications in secondary prevention of atherosclerotic cardiovascular diseases.
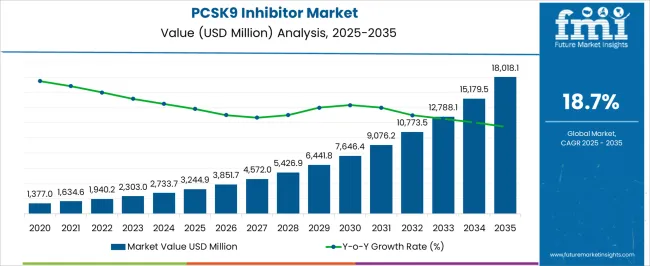
| Metric | Value |
|---|---|
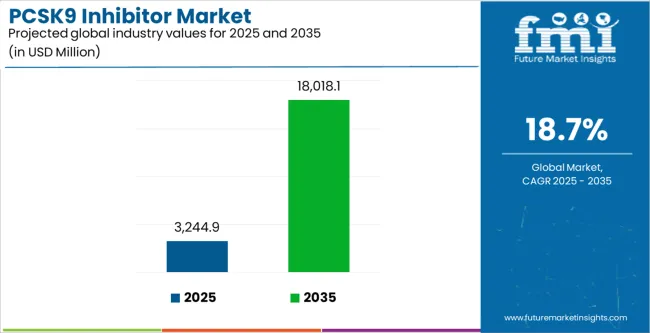
| PCSK9 Inhibitor Market Estimated Value in (2025 E) | USD 3244.9 million |
| PCSK9 Inhibitor Market Forecast Value in (2035 F) | USD 18018.1 million |
| Forecast CAGR (2025 to 2035) | 18.7% |
The market is segmented by Drug, Modality, Indication, and Sales Channel and region. By Drug, the market is divided into Evolocumab, Alirocumab, Inclisiran, and Tafolecimab. In terms of Modality, the market is classified into Fully-Humanized Monoclonal Antibodies and siRNA. Based on Indication, the market is segmented into Familial Hyper Cholesterolemia, Primary Hyperlipidemia, and Prevention Of Other Cardiovascular Events. By Sales Channel, the market is divided into Hospitals, Specialty Clinics, Retail Pharmacies, and Online Pharmacies. Regionally, the market is classified into North America, Latin America, Western Europe, Eastern Europe, Balkan & Baltic Countries, Russia & Belarus, Central Asia, East Asia, South Asia & Pacific, and the Middle East & Africa.
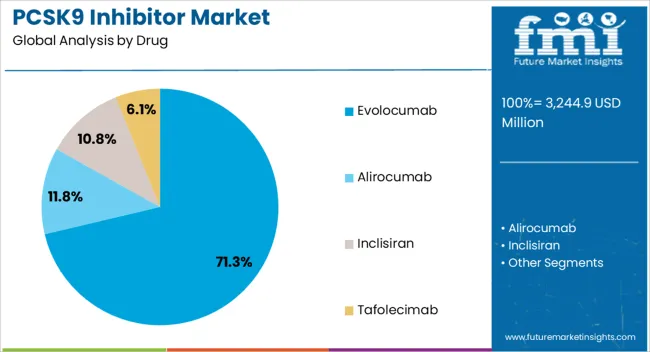
The evolocumab segment dominates the drug category with approximately 71.30% share, reflecting its widespread clinical adoption and established efficacy profile. Its strong therapeutic performance in reducing low-density lipoprotein cholesterol (LDL-C) has positioned it as a preferred choice among healthcare providers.
The segment benefits from extensive clinical data, broad regulatory approvals, and consistent patient outcomes across diverse demographic groups. Market leadership is further supported by robust commercial availability and inclusion in major treatment guidelines for high-risk cardiovascular patients.
Continued physician confidence and expanding insurance coverage have strengthened its adoption trajectory. With ongoing post-marketing surveillance confirming safety and sustained efficacy, evolocumab is expected to maintain its leading position throughout the forecast horizon.
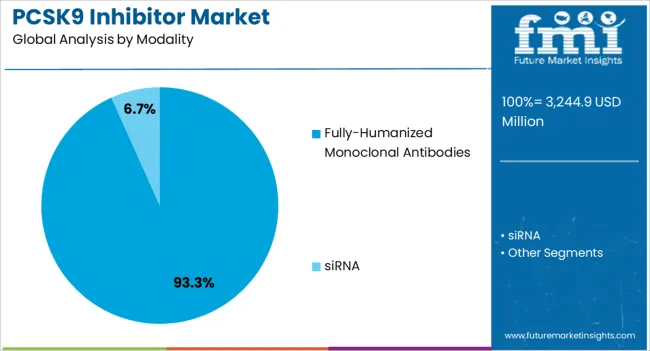
The fully-humanized monoclonal antibodies segment holds approximately 93.30% share in the modality category, supported by their superior immunogenicity profile and long-term therapeutic reliability. This modality has become the cornerstone of PCSK9 inhibition due to its ability to deliver consistent, high-specificity LDL-C reduction without triggering adverse immune responses.
Advances in antibody engineering and biomanufacturing have improved scalability and cost efficiency, further driving adoption. The segment’s dominance is reinforced by the success of leading biologics like evolocumab and alirocumab, which have demonstrated durable clinical outcomes.
Ongoing research into next-generation antibody formats and alternative delivery systems is expected to sustain innovation in this space, ensuring continued leadership of fully-humanized monoclonal antibodies in PCSK9 therapy.
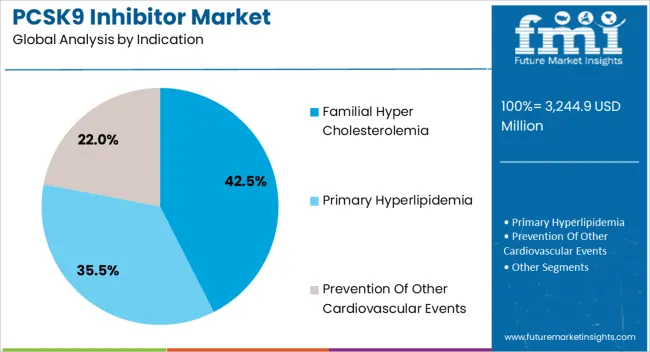
The familial hypercholesterolemia segment accounts for approximately 42.50% share of the indication category, driven by increased diagnostic awareness and improved screening initiatives across healthcare systems. Early identification of genetically predisposed patients has heightened the need for effective lipid-lowering therapies where traditional statins are inadequate.
PCSK9 inhibitors have demonstrated strong efficacy in this population, offering targeted reduction of LDL-C levels and lowering cardiovascular risk. Expanding patient access through genetic counseling programs and specialized lipid clinics has reinforced segment growth.
With growing clinical recognition of the condition and wider therapeutic adoption, the familial hypercholesterolemia segment is expected to remain a core revenue driver for the market.
Rapid Shift toward Personalized Medicine is a Key Market-shaping Trend
The emergence of PCSK9 inhibitors has completely revolutionized how people manage high cholesterol, also known as bad LDL cholesterol. Owing to their safe and highly effective nature, they are witnessing higher demand globally, and the trend will likely continue through 2035.
Research has shown that PCSK9 inhibitors can reduce LDL cholesterol by 50% to 60% on average compared to statins. They work by targeting the PCSK9 protein, which plays a key role in regulating LSL levels in the blood. These novel drugs can also reduce the risk of CVDs.
The rising incidence of cardiovascular diseases is acting as a catalyst fueling demand for PCSK9 inhibitors. Similarly, the growing geriatric population will likely create growth opportunities for PCSK9 inhibitor manufacturers.
Cardiovascular diseases, such as stroke and heart attacks, continue to be a leading cause of morbidity and mortality globally. As per the World Health Organization (WHO), around 17.9 million people die from CVDs annually. This is expected to uplift the demand for cholesterol-lowering therapies like PCSK9 inhibitors.
One significant modifiable risk factor for myocardial infarction, stroke, and cardiovascular disease-related death is the amount of low-density lipoprotein cholesterol (LDL-C). To counter this, people consume medications like PCSK9 inhibitors, thereby fueling their sales.
PCSK9 inhibitors have proven to be remarkably effective in reducing LDL-C, especially in people who are intolerant to statins or have a family history of high cholesterol. Thus, growing cases of high cholesterol will likely propel sales of PCSK9 inhibitors through 2035.
Research and development efforts to find novel therapeutic interventions have surged in response to the growing burden of cardiovascular diseases (CVDs). This is paving the way for the development and approval of new PCSK9 inhibitors.
The global market for PCSK9 inhibitors recorded a stupendous CAGR of 21.3% from 2020 to 2025. It reached a valuation of USD 2,250.4 million at the end of 2025. In the forecast period, PCSK9 inhibitor sales are set to soar at 18.7% CAGR.
The remarkable expansion of the PCSK9 inhibitor market can be attributed mostly to the clinical efficacy and safety of these drugs. These novel biopharmaceuticals have revolutionized the treatment of hypercholesterolemia and cardiovascular disorders by specifically targeting proprotein convertase subtilisin/kexin type 9 (PCSK9).
A thorough examination of the clinical environment demonstrates how PCSK9 inhibitors' safety and efficacy are propelling their broad use and aiding in the market's growth. The principal factor behind the growing market for PCSK9 inhibitor drugs is the medications' exceptional clinical efficacy.
Low-density lipoprotein cholesterol (LDL-C) levels are significantly lowered by PCSK9 inhibitors, either taken as monotherapy or in combination with statins, according to numerous clinical trials. Known as "bad cholesterol," low-density lipoprotein (LDL-C) is a major cause of atherosclerosis and coronary heart disease.
The market for PCSK9 inhibitors has grown significantly in recent years due to the growing regulatory backing and approval for these novel cholesterol-lowering medications. The regulatory environment significantly shapes the pharmaceutical sector, impacting drug research, market accessibility, and patient care.
The rise of the PCSK9 inhibitor market has been greatly aided by the regulatory agencies' increasing recognition and endorsement of these drugs globally. Growing awareness of the higher effectiveness of these medications will likely fuel their sales through 2035.
The regulatory approval of PCSK9 inhibitors by major organizations like the European Medicines Agency (EMA) and the USA Food and Drug Administration (FDA) was a significant turning point in the development of these drugs. With these approvals, the treatment of hypercholesterolemia and atherosclerotic cardiovascular disorders underwent a paradigm change.
Patient empowerment has emerged as a major concern for awareness initiatives. Patient advocacy groups and cardiovascular health organizations are essential in informing people about the advantages of PCSK9 inhibitor drugs. These programs help people feel more empowered and knowledgeable, which in turn influences treatment decisions by facilitating educated conversations between patients and their healthcare professionals.
The rising demand for PCSK9 inhibitors is indicative of the increase in health awareness. Acknowledging the expanding market potential, pharmaceutical companies are allocating resources toward research and development to improve current formulations and create novel PCSK9 inhibitor drugs. The market for PCSK9 inhibitors is growing at a rapid pace thanks to this cycle of awareness, market response, and innovation.
Rising Prevalence of Familial Hypercholesterolemia
Meeting the unmet requirements of individuals with hypercholesterolemia that are difficult to treat is one of the major potential growth areas in the PCSK9 inhibitor market. An important cardiovascular risk is posed by familial hypercholesterolemia, a genetic condition that results in abnormally high cholesterol levels.
PCSK9 inhibitors function by blocking PCSK9, a protein that controls the quantity of LDL receptors on the surface of hepatic cells, providing a tailored treatment strategy. By doing this, these inhibitors improve the liver's capacity to eliminate LDL-C from the blood. They provide a potentially effective treatment option for individuals whose conventional medications are unable to sufficiently regulate their cholesterol levels.
Targeting the underlying cause of hypercholesterolemia, these medications improve the liver's capacity to eliminate LDL-C from the bloodstream by blocking PCSK9 activity. PCSK9 inhibitors' adaptability and ease of use help individuals with hard-to-treat hypercholesterolemia get the care they need. By meeting the challenges and overcoming them, manufacturers are creating opportunities for the PCSK9 inhibitor market to grow in the coming years.
Growing Interest in Precision Medicine
The PCSK9 inhibitor market is expected to grow rapidly due to the changing nature of cardiovascular care and the growing emphasis on individualized therapy. Demand for focused and customized strategies is rising as medical professionals become more aware of the variation in individual patients' responses to lipid-lowering treatments.
PCSK9 inhibitors are useful tools for customizing treatment plans based on specific patient profiles. This is because of their distinct mechanism of action and capacity to achieve significant LDL-C reductions.
PCSK9 inhibitors are an outstanding example of precision medicine in cardiovascular treatment. These inhibitors address a significant component of cardiovascular risk by modulating the levels of low-density lipoprotein cholesterol (LDL-C) and targeting the PCSK9 protein.
High Cost of PCSK9 Inhibitors and Lack of Reimbursement Policies
The reimbursement landscape is a major factor in deciding which PCSK9 medications are accessible. There's a chance that a lot of healthcare systems and insurers won't pay for these medications in full because of financial limitations and the necessity to put cost-effectiveness first.
In order to shape payment rules, negotiations between healthcare payers and pharmaceutical producers are essential. The complex dynamics of these talks frequently lead to a trade-off between the clinical advantages of PCSK9 inhibitors and the stakeholders' financial interests in healthcare.
The high cost of these biopharmaceuticals is a key factor limiting the growth of the PCSK9 inhibitor market. Significant research investments and technological breakthroughs are needed to develop and produce PCSK9 inhibitors, which is an expensive process.
The problem comes when healthcare payers, both public and private, face financial restraints and must weigh the clinical advantages of PCSK9 inhibitors against their viability from an economic standpoint. The hefty cost of PCSK9 inhibitors frequently causes insurance companies to hesitate to offer full coverage.
The hesitation derives from the need to weigh the financial viability of healthcare systems against the demand for patient access to cutting-edge treatments. Payers must decide if the additional therapeutic benefits provided by PCSK9 inhibitors outweigh the premium cost when compared to other cholesterol-lowering medications, such as statins, which can be a difficult decision to make.
The availability of healthcare resources, such as trained doctors and specialized facilities, may vary significantly between various locations or nations. This may lead to unequal access to therapies for cardiovascular diseases such as primary hyperlipidemia and familial hypercholesterolemia.
The unequal access to therapies makes it difficult for patients in underserved or isolated locations to receive rapid, effective care. Treatments for cardiovascular diseases can be expensive, specifically the more sophisticated ones that include intravitreal injections. This can limit market expansion through 2035.
Population-level economic differences may result in financial barriers for some individuals, making it more difficult for them to afford the appropriate treatment. Patients may be discouraged from obtaining or completing therapy for PCSK9 inhibitors if it is out of their financial reach.
The table below highlights the growth projections of the top nations. The United States is expected to lead the global PCSK9 inhibitor industry throughout the forecast period. This can be attributed to rising cases of cardiovascular diseases, increasing awareness of familial hypercholesterolemia, and growing demand for novel LDL cholesterol-lowering drugs and cholesterol management medications.
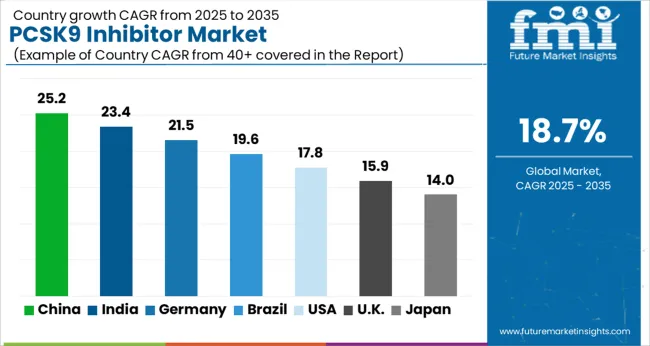
The United States dominates the global PCSK9 inhibitor industry, contributing a value share of 41.6% in 2025. Over the assessment period, demand for PCSK9 inhibitors in the United States is projected to increase at a CAGR of 17.0%. Some of the key drivers/trends include:
The United States has a substantial burden of cardiovascular diseases (CVD), with a large population affected by conditions such as coronary artery disease, heart attacks, and strokes. Given the association between high cholesterol levels and cardiovascular risk, there is a considerable demand for effective cholesterol-lowering therapies like PCSK9 inhibitors.
The United States has a well-developed and advanced healthcare infrastructure with widespread access to medical care. This facilitates the diagnosis and management of cardiovascular risk factors, including high cholesterol levels, thereby fostering market growth.
The strong presence of leading PCSK9 inhibitor manufacturers is another key factor expected to improve the United States PCSK9 inhibitor market share. These top companies are launching new clinical trials to expand their portfolio of PCSK9 inhibitors.
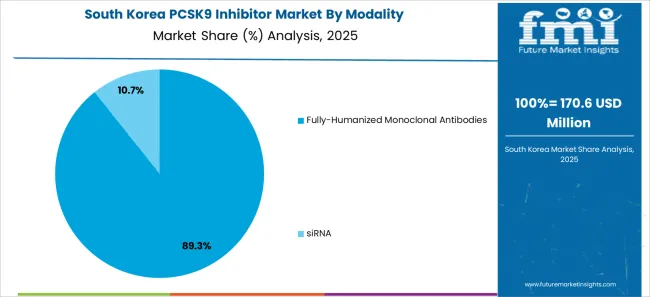
South Korea is emerging as a highly lucrative market for PCSK9 inhibitor manufacturers, and the trend is expected to continue through 2035. It held a dominant revenue share of 57.9% in the East Asia PCSK9 inhibitor market in 2025.
Over the forecast period, South Korea's PCSK9 inhibitor industry is poised to advance at a staggering CAGR of 26.2%. It will likely total USD 1,251.03 million in 2035, driven by factors like:
As the economy grows and the standard of living improves, there is a trend of increased healthcare spending in South Korea. This can lead to greater demand for various healthcare products, including pharmaceuticals like PCSK9 inhibitors.
South Korea has been an active participant in clinical trials and research collaborations. Pharmaceutical manufacturers may find opportunities to engage in partnerships with Korean research institutions and hospitals for clinical development. This will likely further boost the growth of Korea’s PCSK9 inhibitor market.
India’s PCSK9 inhibitor market is anticipated to grow at a CAGR of 9.4% during the forecast period. The total market valuation in the nation will likely reach USD 284.68 million in 2035. This can be attributed to a combination of factors, including:
The expanding middle-class population in India is associated with improved affordability and increased spending on healthcare. This can potentially drive the demand for innovative and advanced pharmaceutical products, including PCSK9 inhibitors.
Government initiatives aimed at improving healthcare infrastructure, increasing access to healthcare services, and addressing non-communicable diseases may create an environment conducive to the adoption of advanced pharmaceuticals. This will positively impact sales of PCSK9 inhibitors across India.
The section below shows the evolocumab segment dominating the PCSK9 inhibitor industry. It is projected to account for a revenue share of 71.3% in 2025. Based on modality, the fully humanized monoclonal antibodies segment will likely hold a market share of 93.3% in 2025.
By indication, the familial hyper cholesterolemia category is expected to lead the market, holding a value share of 42.5% in 2025. Based on sales channels, the hospitals segment is poised to expand at 13.2% CAGR, holding a market share of 40.9% in 2025.
Market Growth Outlook by Drug
| Drug | Value CAGR |
|---|---|
| Alirocumab | 11.3% |
| Evolocumab | 19.4% |
| Inclisiran | 31.3% |
Evolocumab remains the most favorable choice for patients with high cholesterol. As per the latest analysis, demand for evolocumab is projected to rise at 19.4% CAGR during the forecast period, totaling a valuation of USD 9,272.36 million in 2035.
Evolocumab, sold under the brand name Repatha, is often considered the most effective PCSK9 inhibitor at lowering LDL-C levels. It has shown a slightly greater average reduction in LDL-C levels compared to other PCSK9 inhibitors, thereby fueling its adoption and demand.
Market Growth Outlook by Modality
| Modality | Value CAGR |
|---|---|
| Fully-humanized monoclonal antibodies | 17.9% |
| siRNA | 31.3% |
Both small interfering RNA (siRNA) and fully humanized monoclonal antibodies (mAbs) are emerging classes of PCSK9 inhibitors with the tendency to revolutionize lipid-lowering therapy. Among these, fully humanized mAbs remain a popular category owing to their well-established efficacy and safety profiles.
The fully humanized monoclonal antibodies segment is anticipated to thrive at 17.9% CAGR during the forecast period. It will likely hold a value share of 93.3% in 2025.
Market Growth Outlook by Key Indication
| Indication | Value CAGR |
|---|---|
| Primary Hyperlipidemia | 20.7% |
| Familial Hyper Cholesterolemia | 14.6% |
| Prevention of Other Cardiovascular Events | 24.8% |
Based on indication, the familial hyper cholesterolemia segment is set to account for a revenue share of 42.5% in 2025. Over the forecast period, the same segment will likely exhibit a CAGR of 14.6%. This is due to factors like
Familial hypercholesterolemia is often difficult to manage with traditional lipid-lowering therapies alone. PCSK9 inhibitors offer a targeted approach to lower LDL-C levels in these patients, addressing an unmet medical need for effective treatments.
Familial hypercholesterolemia can also affect children, and PCSK9 inhibitors have been studied and approved for use in pediatric populations. This expands the potential patient pool for PCSK9 inhibitors in addressing familial hypercholesterolemia.
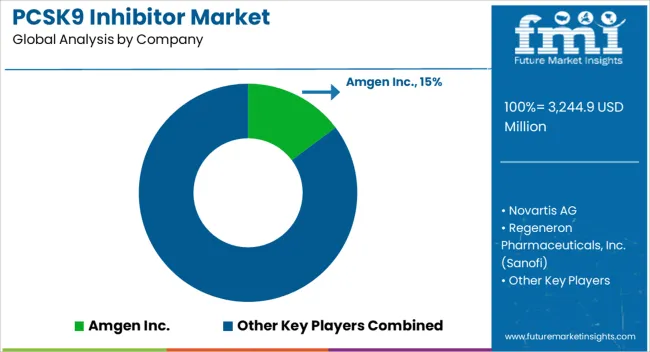
Clinical trials can serve as a powerful promotional strategy for a company, offering a multifaceted approach to showcasing its commitment to innovation, patient care, and scientific advancement. Securing approval from the USA Food and Drug Administration (FDA) is a significant achievement for any pharmaceutical or biopharmaceutical company.
Top manufacturers of PCSK9 inhibitors are heavily investing in research and development to explore novel treatment approaches for high cholesterol. For instance, they are exploring combination therapies with other cholesterol-lowering drugs to broaden the application of PCSK9 inhibitors and improve patient outcomes.
Recent Developments in the PCSK9 Inhibitor Market
The global pcsk9 inhibitor market is estimated to be valued at USD 3,244.9 million in 2025.
The market size for the pcsk9 inhibitor market is projected to reach USD 18,018.1 million by 2035.
The pcsk9 inhibitor market is expected to grow at a 18.7% CAGR between 2025 and 2035.
The key product types in pcsk9 inhibitor market are evolocumab, alirocumab, inclisiran and tafolecimab.
In terms of modality, fully-humanized monoclonal antibodies segment to command 93.3% share in the pcsk9 inhibitor market in 2025.


Full Research Suite comprises of:
Market outlook & trends analysis
Interviews & case studies
Strategic recommendations
Vendor profiles & capabilities analysis
5-year forecasts
8 regions and 60+ country-level data splits
Market segment data splits
12 months of continuous data updates
DELIVERED AS:
PDF EXCEL ONLINE
FcRn Inhibitors Market Size and Share Forecast Outlook 2025 to 2035
PARP Inhibitor Market Analysis – Size, Share, and Forecast Outlook 2025 to 2035
CGRP Inhibitors Market Trends - Growth, Demand & Forecast 2025 to 2035
Global KRAS Inhibitor Market Analysis – Size, Share & Forecast 2024-2034
SGLT2 Inhibitors Market Size and Share Forecast Outlook 2025 to 2035
SGLT2 Inhibitors Treatment Market Overview – Trends & Growth 2024-2034
NF-KB Inhibitors Market
Mould Inhibitors Market
Kinase Inhibitors For Cancer Treatment Market Size and Share Forecast Outlook 2025 to 2035
Kinase Inhibitor in Autoimmune Diseases Market Size and Share Forecast Outlook 2025 to 2035
Enzyme Inhibitors Market
Galectin Inhibitor Therapeutics Market
Paraffin Inhibitors Market
Corrosion Inhibitors Market Growth - Trends & Forecast 2025 to 2035
Checkpoint Inhibitor Refractory Cancer Market Size and Share Forecast Outlook 2025 to 2035
PD-1/PD-L1 Inhibitors Market – Trends, Growth & Forecast 2025 to 2035
Mouse RNase Inhibitor Market Size and Share Forecast Outlook 2025 to 2035
Proton Pump Inhibitors Market Insights - Demand, Size & Industry Trends 2025 to 2035
Angiopoietin Inhibitors Therapeutic Market
Oilfield Scale Inhibitor Market Size and Share Forecast Outlook 2025 to 2035

Thank you!
You will receive an email from our Business Development Manager. Please be sure to check your SPAM/JUNK folder too.
Chat With
MaRIA