Reports

- Global Locations -

Headquarters

Future Market Insights, Inc.

Christiana Corporate, 200
Continental Drive, Suite 401,
Newark, Delaware - 19713,
United States

T: +1-845-579-5705

Americas

Future Market Insights, Inc.

616 Corporate Way, Suite 2-9018,
Valley Cottage, NY 10989, United States

T: +1-347-918-3531

MEA

Future Market Insights

1602-6 Jumeirah Bay X2 Tower, Plot No: JLT-PH2-X2A,
Jumeirah Lakes Towers, Dubai,
United Arab Emirates

Europe

Future Market Insights

3rd Floor, 207 Regent Street,
W1B 3HH London
United Kingdom

T: + 44 (0) 20 8123 9659
D: +44 (0) 20 3287 4268

Asia Pacific

Future Market Insights

IndiaLand Global Tech Park, Unit UG-1, Behind Grand HighStreet, Phase 1, Hinjawadi, MH, Pune – 411057, India

Kinase Inhibitor in Autoimmune Diseases Market Snapshot (2023 to 2033)

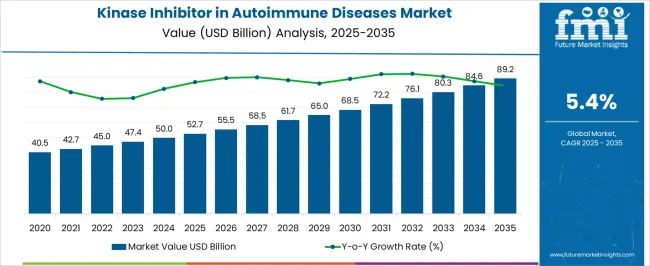
The global kinase inhibitor in autoimmune diseases market is expected to be valued at US$ 47,430 Million in 2023 and is anticipated to expand at a CAGR of 5.4%. Owing to the technological advances in healthcare the market is likely to propel to US$ 80,252 Million by 2033.

The increasing healthcare spending and increasing awareness pertaining to autoimmune diseases are likely to drive the growth of the kinase inhibitor in the autoimmune diseases market in the forecast period.

Report Attribute Details
Expected Market Value (2023) US$ 47,430 Million
Projected Forecast Value (2033) US$ 80,252 Million
Global Growth Rate (2023 to 2033) 5.4% CAGR

Don't pay for what you don't need

Customize your report by selecting specific countries or regions and save 30%!

Kinase Inhibitor in Autoimmune Diseases Market Revenue Analysis 2018 to 2022 vs. Future Outlook 2023 to 2033

The kinase inhibitor in the autoimmune diseases market is expected to gain market growth in the forecast period of 2023 to 2033. Latest market analysis by FMI the market is to grow at a CAGR of 5.4% in the above-mentioned forecast period.

Autoimmune diseases occur when the immune system attacks one or more cells of the body which are functioning normally owing to the irregularities. The mis-functioning of the immune system is a result of the failure to recognize immune cells, tissues, and organs and produce autoantibodies targeting these cells.

There are massive technological developments happening in the healthcare sector, especially in the area of autoimmune disease treatment. Companies are making use of this technology to develop much more evolved forms of tyrosine kinase inhibitors. This might increase the demand for kinase inhibitors for cancer treatment during the forecast period. Presently, pharmaceutical companies are investing heavily in Research and Development to develop enhanced kinase inhibitors. This is currently driving the market growth. The global kinase inhibitor in the autoimmune diseases market rose at a CAGR of 5.1% from 2018 to 2022.

What Market Trends Are Influencing the Kinase Inhibitor in Autoimmune Diseases Market?

Growing Healthcare Spending to Drive the Kinase Inhibitor in Autoimmune Disease Market

The increasing prevalence of autoimmune and chronic diseases including rheumatic arthritis, psoriatic arthritis, ulcerative colitis, etc. is expected to drive the growth of kinase inhibitors in the autoimmune disease market.

Additionally, the increasing number of special designations for drugs in the pipeline is also expected to fuel the growth of the market. Kinase Inhibitor in the autoimmune disease market is primarily driven by a few key factors such as the rising prevalence of autoimmune disease, patient awareness regarding rising healthcare concerns, increase in healthcare expenditure.

The considerable efforts by the governments as well as the private players across the world in improving, rebuilding, and innovating healthcare infrastructure across the globe are also translating into various worthwhile development opportunities for the players in the global kinase inhibitor autoimmune diseases market in coming years. Rising government initiatives and the increase in automation technologies lead to higher sensitivity, faster and easy performing diagnosis test results, and prevention of disease.

Increased Research and Development Drive the Market During the Forecast Period

The rising prevalence of autoimmune diseases is likely to fuel the growth of the kinase inhibitor in the autoimmune disease market. Therefore, a consistent increase in the autoimmune patient population across the world has been identified as one of the major factors driving the kinase inhibitor in the autoimmune disease market.

The pharmaceutical companies on Research and Development to come up with potential kinase inhibitors for the treatment of autoimmune diseases are driving the growth of kinase inhibitors in the autoimmune disease market, globally. More than 400 diseases have been associated directly or indirectly with protein kinase. The success of kinase inhibitors in treating autoimmune diseases such as rheumatoid arthritis, psoriasis, and psoriatic arthritis has showcased their therapeutic potential. This success, coupled with a greater understanding of inflammatory signaling cascades, led to kinase inhibitors taking center stage to pursue new anti-inflammatory agents for the treatment of immune-mediated diseases.

The expected launch of emerging therapies such as SHR0302, Ruxolitinib, Branebrutinib, Ritlecitinib, Ritlecitinib/PF-06650833/ Tofacitinib, Abrocitinib, PF-06826647, Brepocitinib, SHR0302, Ruxolitinib, Branebrutinib likely to drive the market during the forecast period.

Sabyasachi Ghosh
Sabyasachi Ghosh

Principal Consultant

Talk to Analyst

Find your sweet spots for generating winning opportunities in this market.

Which Factors Are Restraining the Growth in the Kinase Inhibitor in Autoimmune Diseases Market?

Lack of Skilled Professional May Hamper the Market Growth

The high cost associated with the latest clinical trials and complex approvals processes is acting as a major obstruction to the growth of kinase inhibitors in the autoimmune diseases market. On the other hand, the dearth of skilled professionals and technicians as well as the rise in the lack of understanding about the basic aetiology of autoimmune disorders may restrict the growth in the global kinase inhibitor autoimmune diseases market in near future.

However, modernization, as well as technological advancements in medical and healthcare devices as well as the constant efforts by the industry players on geographical as well as product offerings expansion, are anticipated to bolster the rising demand in the global kinase inhibitor in autoimmune diseases market over the forecast period.
Country-Wise Insights

What Makes the USA an Attractive Market for Kinase Inhibitors in Autoimmune Diseases?

Increasing Rate of Autoimmune Diseases in the USA to Propel the Market Growth

The USA is estimated to account for over 5.2% of the North American market in 2022. The growth of the market in the region is attributed to the increasing prevalence of autoimmune diseases. North America holds a leading position in the Kinase inhibitor in the autoimmune disease Market due to the growing incidence of autoimmune disorders such as rheumatoid arthritis, and diabetes type I in the region.

According to the National Institutes of Health, up to 23.5 million Americans (more than seven percent of the population) suffer from an autoimmune disease - and the prevalence is rising.

Government initiatives such as the Affordable Care Act and Patient Protection Act are further fueling the growth of the market size of kinase inhibitors in autoimmune diseases.

Why is the Kinase Inhibitor in Autoimmune Diseases Market in Europe Expected to Be Highly Opportunistic?

Rising Investments in Research and Development Driving Growth in Europe Market

The Europe kinase inhibitors in the autoimmune disease market are expected to rise at a CAGR of 5.1% from 2023 to 2033. Europe is expected to have the second-largest market for global kinase inhibitors in the autoimmune disease market. Increasing awareness among people about diseases is also a major factor that may boost the growth of the market in this region.

The growing advancement of healthcare infrastructure, increasing per-capita income, and MNCs strengthening their distribution network all these factors also boost the market growth. Increased penetration of new technologies such as potable diagnostic equipment and novel biomarkers are contributing largely to the market growth of Europe.

Which Factors Are Supporting Growth of the Kinase Inhibitor in the Autoimmune Diseases Market in Asia Pacific?

Rapid development in pharmaceuticals to drive the market growth in Asia Pacific

Asia Pacific is anticipated to experience the fastest growth in the kinase inhibitors in the autoimmune diseases market as a result of an increase in the prevalence of chronic diseases, and autoimmune diseases. Asia is expected to be the fastest-growing market in the upcoming years. This is due to the rising aging population and improving healthcare infrastructure in this region. Moreover, rising awareness about better healthcare facilities is also driving the growth of the autoimmune disease treatment market in the region.

Rising awareness about healthcare and increasing investments in Research and Development in pharmaceutical and life sciences sectors are some of the key factors driving the growth of the global kinase inhibitor in the autoimmune diseases market. However, in the Middle East and Africa market growth is expected to be limited due to slow economic growth, underdeveloped infrastructure, and lower access to technological advancement.

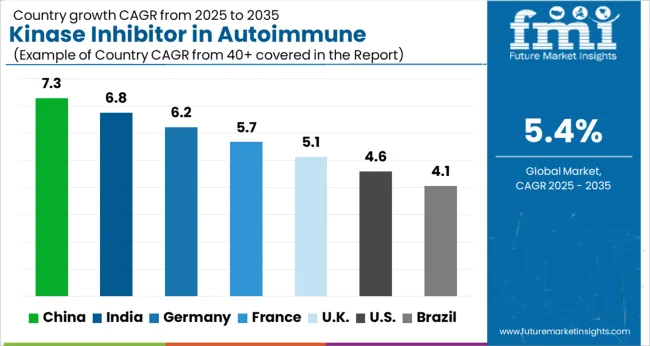
Country-wise Forecast CAGRs for the Kinase Inhibitor in Autoimmune Diseases Market

UK 5.1%
India 4.8%
South Korea 4.9%
China 5.0%
USA 5.2%

Get the data you need at a Fraction of the cost

Personalize your report by choosing insights you need
and save 40%!

Category wise Insights

Based on Drug Type, Which Is the Most Prominent Segment in The Kinase Inhibitor in Autoimmune Diseases Market?

Anti-inflammatory Drugs Segment remains dominant among other Drugs Types

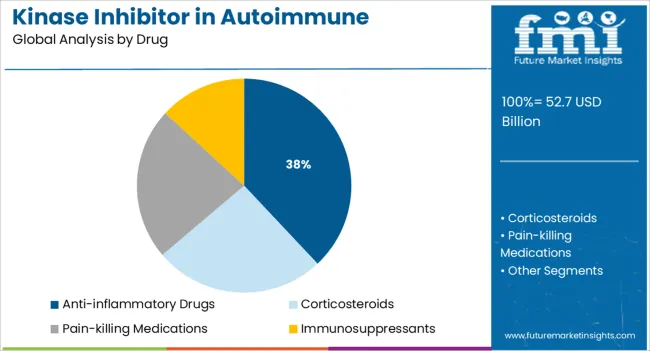
Anti-inflammatory Drugs (NSAIDs) dominated the industry in 2023. The anti-inflammatory segment dominated the global market in 2023 with a revenue share of over 45.3%. This is attributed to the high level of penetration of drugs, and availability at lower cost in comparison to drugs of other classes.

Some of the drugs to treat autoimmune diseases include NSAID, DMARD, biologic DMARD, and 5-ASA. Other therapies such as bridge therapy, topical therapy, phototherapy, and recombinant technology are also used for the treatment of these diseases. On the other hand, corticosteroids anticipated to witness the fastest growth over the forecast period are typically used to treat rheumatologic diseases, like rheumatoid arthritis, lupus, or vasculitis.

Start-up Scenario

How do New Entrants Contribute to the Kinase Inhibitor in Autoimmune Diseases Market?

With technological innovations happening at a rapid pace, and companies looking for ways to increase customer engagement, start-ups are taking all possible steps to establish a name for themselves in the kinase inhibitor in the autoimmune diseases market.

Some of the start-ups in the kinase inhibitor in autoimmune diseases market include-
  • Avila Therapeutics focuses on the design and development of targeted covalent drugs. The company's product pipeline has been built using its proprietary Avilomics platform and is currently focused on cancer, viral infection, and autoimmune disease. Avila's most advanced product candidate, AVL-292, a potential treatment for cancer and autoimmune diseases, is currently in Phase 1 clinical testing. Avila was acquired by Celgene in March 2012.
  • Polymed biopharmaceuticals - Developer of small molecule therapeutics for cancer and autoimmune diseases. The company has protein degradation therapeutics HPB-001 for cancer and HPB-002 for autoimmune disease. Also, has a protein kinase inhibitor HPB-003 which provides an anti-inflammation effect.
  • Sareum Holdings discovers and develops small-molecule therapeutics for cancer and autoimmune diseases. The company has developed SKIL (Sareum Kinase Inhibitor Library) platform for drug discovery which is used to inhibit many different kinases. The company's other product includes TYK2 inhibitor which is used for the treatment of autoimmune diseases such as psoriasis, lupus, and colon cancer.
  • Dynamix provides a portfolio of drug discovery and development. Its drug candidate is PKM2 is in the preclinical trial for cancer metabolism, It also develops kinase inhibitors such as SYK and JYK3 for cancer and autoimmune disease therapy. Its DynamixFit is the proprietary technology that helps in 3D-based in silico drug design.

Competitive Landscape

The professional survey study carefully analyses the operations and overview of the corporate structures and functioning of the leading and major manufacturers and players functional within the global kinase inhibitor in the autoimmune diseases market. It assesses its product offerings, financial outlook, sales, revenue, and growth over the forecast period.

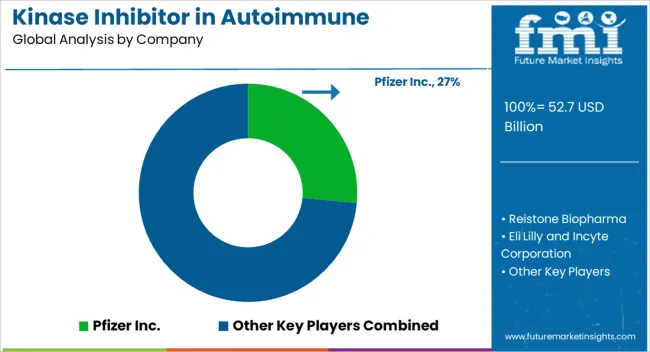
Some of the leading manufacturers and players assessed in the global kinase inhibitor in autoimmune treatment market include Pfizer, Reistone Biopharma, Eli Lily and Incyte Corporation, AbbVie, Gilead Sciences, Astellas Pharma, Japan Tobacco and Torii Pharmaceutical, Incyte Corporation, Bristol Myers Squibb, Galapagos NV, and others

Manufacturers and players functional in the global kinase inhibitor in autoimmune diseases market are adopting various corporate growth strategies such as new product launches, mergers and acquisitions, and geographical expansion, among others.

  • In December 2022 - AbbVie and HotSpot Therapeutics, Inc., a biotechnology company pioneering the discovery and development of small molecule allosteric therapies for the treatment of cancer and autoimmune diseases, today announced an exclusive worldwide collaboration and option to license agreement for HotSpot's discovery-stage IRF5 program for the treatment of autoimmune diseases.
  • In August 2021 - Reistone Biopharma, focused on development of treatments for immune & inflammation-related diseases, announced positive top-line results from a Phase 2 study evaluating the safety and effectiveness of once-daily SHR0302 in adults with alopecia areata (AA). Treatment was well tolerated, and safety was consistent with other JAK1 inhibitors. AA is an autoimmune disease that causes hair loss in patches or sometimes complete hair loss, leading to high psychological burden.

Report Scope

Report Attribute Details
Growth Rate CAGR from 2023 to 2033
Expected Market Value (2023) US$ 47,430 Million
Projected Forecast Value (2033) US$ 80,252 Million
Base Year for Estimation 2022
Historical Data 2018 to 2022
Forecast Period 2023 to 2033
Quantitative Units Revenue in USD Million & CAGR from 2023 to 2033
Report Coverage Revenue Forecast, Volume Forecast, Company Ranking, Competitive Landscape, Growth Factors, Trends & Pricing Analysis
Segments Covered
  • Treatment
  • Drug
  • Region
Regions Covered
  • North America
  • Latin America
  • Europe
  • Asia Pacific
  • Middle East & Africa
Key Countries Profiled
  • USA
  • Canada
  • Brazil
  • Mexico
  • Germany
  • UK
  • France
  • Spain
  • Italy
  • China
  • Japan
  • South Korea
  • Singapore
  • Thailand
  • Indonesia
  • Australia
  • New Zealand
Key Companies Profiled
  • Pfizer
  • Reistone Biopharma
  • Eli Lily and Company
  • AbbVie
  • Gilead Sciences
  • Astellas Pharma
  • Japan Tobacco and Torii Pharmaceutical
  • Incyte Corporation
  • Bristol Myers Squibb
  • Galapagos NV
Customization Available Upon Request

Key Segments Covered in the Kinase Inhibitor in Autoimmune Diseases Industry Survey

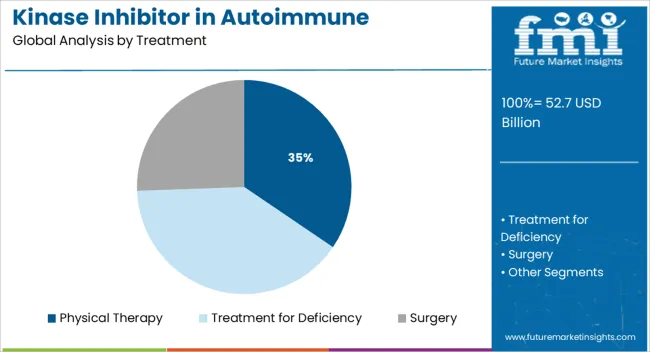
Kinase Inhibitor in Autoimmune Diseases Market by Treatment:

  • Physical therapy
  • Treatment of Deficiency
  • Surgery

Kinase Inhibitor in Autoimmune Diseases Market by Drug:

  • Anti-inflammatory Drugs
  • Corticosteroids
  • Pain-killing Medications
  • Immunosuppressants

Kinase Inhibitor in Autoimmune Diseases Market by Region:

  • North America
  • Latin America
  • Europe Kinase
  • Asia Pacific
  • Middle East & Africa

Frequently Asked Questions

What is the expected valuation of the kinase inhibitor in the autoimmune diseases market?

The global kinase inhibitor in autoimmune diseases market is likely to reach a valuation of US$ 47,430 Million by the end of 2023.

Who are the key players in the kinase inhibitor in autoimmune diseases market?

Pfizer, Reistone Biopharma, Eli Lily and Incyte Corporation, AbbVie, Gilead Sciences, Astellas Pharma are some of the key players in the global kinase inhibitor in autoimmune diseases market

What are the future prospects for kinase inhibitor in autoimmune diseases market sales?

Sales of the kinase inhibitor in autoimmune diseases market are likely to expand at 5.4% CAGR through 2033

Which are the top 5 countries driving demand for biopharma plastics?

The USA, Canada, Japan, China, & Germany are expected to drive most of the demand for kinase inhibitor in autoimmune diseases market

What will be the global kinase inhibitor in autoimmune diseases market revenue total by 2033?

By the end of 2033, the global market for kinase inhibitor in autoimmune diseases market is predicted to reach a valuation of US$ 80,252 Million

Table of Content

1. Executive Summary | Kinase Inhibitor in Autoimmune Diseases Market

    1.1. Global Market Outlook

    1.2. Demand-side Trends

    1.3. Supply-side Trends

    1.4. Technology Roadmap Analysis

    1.5. Analysis and Recommendations

2. Market Overview

    2.1. Market Coverage / Taxonomy

    2.2. Market Definition / Scope / Limitations

3. Market Background

    3.1. Market Dynamics

        3.1.1. Drivers

        3.1.2. Restraints

        3.1.3. Opportunity

        3.1.4. Trends

    3.2. Scenario Forecast

        3.2.1. Demand in Optimistic Scenario

        3.2.2. Demand in Likely Scenario

        3.2.3. Demand in Conservative Scenario

    3.3. Opportunity Map Analysis

    3.4. Investment Feasibility Matrix

    3.5. PESTLE and Porter’s Analysis

    3.6. Regulatory Landscape

        3.6.1. By Key Regions

        3.6.2. By Key Countries

    3.7. Regional Parent Market Outlook

4. Global Market Analysis 2018 to 2022 and Forecast, 2023 to 2033

    4.1. Historical Market Size Value (US$ Million) Analysis, 2018 to 2022

    4.2. Current and Future Market Size Value (US$ Million) Projections, 2023 to 2033

        4.2.1. Y-o-Y Growth Trend Analysis

        4.2.2. Absolute $ Opportunity Analysis

5. Global Market Analysis 2018 to 2022 and Forecast 2023 to 2033, By Treatment

    5.1. Introduction / Key Findings

    5.2. Historical Market Size Value (US$ Million) Analysis By Treatment, 2018 to 2022

    5.3. Current and Future Market Size Value (US$ Million) Analysis and Forecast By Treatment, 2023 to 2033

        5.3.1. Physical Therapy

        5.3.2. Treatment for Deficiency

        5.3.3. Surgery

    5.4. Y-o-Y Growth Trend Analysis By Treatment, 2018 to 2022

    5.5. Absolute $ Opportunity Analysis By Treatment, 2023 to 2033

6. Global Market Analysis 2018 to 2022 and Forecast 2023 to 2033, By Drug

    6.1. Introduction / Key Findings

    6.2. Historical Market Size Value (US$ Million) Analysis By Drug, 2018 to 2022

    6.3. Current and Future Market Size Value (US$ Million) Analysis and Forecast By Drug, 2023 to 2033

        6.3.1. Anti-inflammatory Drugs

        6.3.2. Corticosteroids

        6.3.3. Pain-killing Medications

        6.3.4. Immunosuppressants

    6.4. Y-o-Y Growth Trend Analysis By Drug, 2018 to 2022

    6.5. Absolute $ Opportunity Analysis By Drug, 2023 to 2033

7. Global Market Analysis 2018 to 2022 and Forecast 2023 to 2033, By Region

    7.1. Introduction

    7.2. Historical Market Size Value (US$ Million) Analysis By Region, 2018 to 2022

    7.3. Current Market Size Value (US$ Million) Analysis and Forecast By Region, 2023 to 2033

        7.3.1. North America

        7.3.2. Latin America

        7.3.3. Europe

        7.3.4. Asia Pacific

        7.3.5.Middle East and Africa (MEA)

    7.4. Market Attractiveness Analysis By Region

8. North America Market Analysis 2018 to 2022 and Forecast 2023 to 2033, By Country

    8.1. Historical Market Size Value (US$ Million) Trend Analysis By Market Taxonomy, 2018 to 2022

    8.2. Market Size Value (US$ Million) Forecast By Market Taxonomy, 2023 to 2033

        8.2.1. By Country

            8.2.1.1. United States of America

            8.2.1.2. Canada

        8.2.2. By Treatment

        8.2.3. By Drug

    8.3. Market Attractiveness Analysis

        8.3.1. By Country

        8.3.2. By Treatment

        8.3.3. By Drug

    8.4. Key Takeaways

9. Latin America Market Analysis 2018 to 2022 and Forecast 2023 to 2033, By Country

    9.1. Historical Market Size Value (US$ Million) Trend Analysis By Market Taxonomy, 2018 to 2022

    9.2. Market Size Value (US$ Million) Forecast By Market Taxonomy, 2023 to 2033

        9.2.1. By Country

            9.2.1.1. Brazil

            9.2.1.2. Mexico

            9.2.1.3. Rest of Latin America

        9.2.2. By Treatment

        9.2.3. By Drug

    9.3. Market Attractiveness Analysis

        9.3.1. By Country

        9.3.2. By Treatment

        9.3.3. By Drug

    9.4. Key Takeaways

10. Europe Market Analysis 2018 to 2022 and Forecast 2023 to 2033, By Country

    10.1. Historical Market Size Value (US$ Million) Trend Analysis By Market Taxonomy, 2018 to 2022

    10.2. Market Size Value (US$ Million) Forecast By Market Taxonomy, 2023 to 2033

        10.2.1. By Country

            10.2.1.1. Germany

            10.2.1.2. United Kingdom

            10.2.1.3. France

            10.2.1.4. Spain

            10.2.1.5. Italy

            10.2.1.6. Rest of Europe

        10.2.2. By Treatment

        10.2.3. By Drug

    10.3. Market Attractiveness Analysis

        10.3.1. By Country

        10.3.2. By Treatment

        10.3.3. By Drug

    10.4. Key Takeaways

11. Asia Pacific Market Analysis 2018 to 2022 and Forecast 2023 to 2033, By Country

    11.1. Historical Market Size Value (US$ Million) Trend Analysis By Market Taxonomy, 2018 to 2022

    11.2. Market Size Value (US$ Million) Forecast By Market Taxonomy, 2023 to 2033

        11.2.1. By Country

            11.2.1.1. China

            11.2.1.2. Japan

            11.2.1.3. South Korea

            11.2.1.4. Singapore

            11.2.1.5. Thailand

            11.2.1.6. Indonesia

            11.2.1.7. Australia

            11.2.1.8. New Zealand

            11.2.1.9. Rest of Asia Pacific

        11.2.2. By Treatment

        11.2.3. By Drug

    11.3. Market Attractiveness Analysis

        11.3.1. By Country

        11.3.2. By Treatment

        11.3.3. By Drug

    11.4. Key Takeaways

12. MEA Market Analysis 2018 to 2022 and Forecast 2023 to 2033, By Country

    12.1. Historical Market Size Value (US$ Million) Trend Analysis By Market Taxonomy, 2018 to 2022

    12.2. Market Size Value (US$ Million) Forecast By Market Taxonomy, 2023 to 2033

        12.2.1. By Country

            12.2.1.1. GCC Countries

            12.2.1.2. South Africa

            12.2.1.3. Israel

            12.2.1.4. Rest of MEA

        12.2.2. By Treatment

        12.2.3. By Drug

    12.3. Market Attractiveness Analysis

        12.3.1. By Country

        12.3.2. By Treatment

        12.3.3. By Drug

    12.4. Key Takeaways

13. Key Countries Market Analysis

    13.1. United States of America

        13.1.1. Pricing Analysis

        13.1.2. Market Share Analysis, 2022

            13.1.2.1. By Treatment

            13.1.2.2. By Drug

    13.2. Canada

        13.2.1. Pricing Analysis

        13.2.2. Market Share Analysis, 2022

            13.2.2.1. By Treatment

            13.2.2.2. By Drug

    13.3. Brazil

        13.3.1. Pricing Analysis

        13.3.2. Market Share Analysis, 2022

            13.3.2.1. By Treatment

            13.3.2.2. By Drug

    13.4. Mexico

        13.4.1. Pricing Analysis

        13.4.2. Market Share Analysis, 2022

            13.4.2.1. By Treatment

            13.4.2.2. By Drug

    13.5. Germany

        13.5.1. Pricing Analysis

        13.5.2. Market Share Analysis, 2022

            13.5.2.1. By Treatment

            13.5.2.2. By Drug

    13.6. United Kingdom

        13.6.1. Pricing Analysis

        13.6.2. Market Share Analysis, 2022

            13.6.2.1. By Treatment

            13.6.2.2. By Drug

    13.7. France

        13.7.1. Pricing Analysis

        13.7.2. Market Share Analysis, 2022

            13.7.2.1. By Treatment

            13.7.2.2. By Drug

    13.8. Spain

        13.8.1. Pricing Analysis

        13.8.2. Market Share Analysis, 2022

            13.8.2.1. By Treatment

            13.8.2.2. By Drug

    13.9. Italy

        13.9.1. Pricing Analysis

        13.9.2. Market Share Analysis, 2022

            13.9.2.1. By Treatment

            13.9.2.2. By Drug

    13.10. China

        13.10.1. Pricing Analysis

        13.10.2. Market Share Analysis, 2022

            13.10.2.1. By Treatment

            13.10.2.2. By Drug

    13.11. Japan

        13.11.1. Pricing Analysis

        13.11.2. Market Share Analysis, 2022

            13.11.2.1. By Treatment

            13.11.2.2. By Drug

    13.12. South Korea

        13.12.1. Pricing Analysis

        13.12.2. Market Share Analysis, 2022

            13.12.2.1. By Treatment

            13.12.2.2. By Drug

    13.13. Singapore

        13.13.1. Pricing Analysis

        13.13.2. Market Share Analysis, 2022

            13.13.2.1. By Treatment

            13.13.2.2. By Drug

    13.14. Thailand

        13.14.1. Pricing Analysis

        13.14.2. Market Share Analysis, 2022

            13.14.2.1. By Treatment

            13.14.2.2. By Drug

    13.15. Indonesia

        13.15.1. Pricing Analysis

        13.15.2. Market Share Analysis, 2022

            13.15.2.1. By Treatment

            13.15.2.2. By Drug

    13.16. Australia

        13.16.1. Pricing Analysis

        13.16.2. Market Share Analysis, 2022

            13.16.2.1. By Treatment

            13.16.2.2. By Drug

    13.17. New Zealand

        13.17.1. Pricing Analysis

        13.17.2. Market Share Analysis, 2022

            13.17.2.1. By Treatment

            13.17.2.2. By Drug

    13.18. GCC Countries

        13.18.1. Pricing Analysis

        13.18.2. Market Share Analysis, 2022

            13.18.2.1. By Treatment

            13.18.2.2. By Drug

    13.19. South Africa

        13.19.1. Pricing Analysis

        13.19.2. Market Share Analysis, 2022

            13.19.2.1. By Treatment

            13.19.2.2. By Drug

    13.20. Israel

        13.20.1. Pricing Analysis

        13.20.2. Market Share Analysis, 2022

            13.20.2.1. By Treatment

            13.20.2.2. By Drug

14. Market Structure Analysis

    14.1. Competition Dashboard

    14.2. Competition Benchmarking

    14.3. Market Share Analysis of Top Players

        14.3.1. By Regional

        14.3.2. By Treatment

        14.3.3. By Drug

15. Competition Analysis

    15.1. Competition Deep Dive

        15.1.1. Pfizer

            15.1.1.1. Overview

            15.1.1.2. Product Portfolio

            15.1.1.3. Profitability by Market Segments

            15.1.1.4. Sales Footprint

            15.1.1.5. Strategy Overview

                15.1.1.5.1. Marketing Strategy

        15.1.2. Reistone Biopharma

            15.1.2.1. Overview

            15.1.2.2. Product Portfolio

            15.1.2.3. Profitability by Market Segments

            15.1.2.4. Sales Footprint

            15.1.2.5. Strategy Overview

                15.1.2.5.1. Marketing Strategy

        15.1.3. Eli Lily and Incyte Corporation

            15.1.3.1. Overview

            15.1.3.2. Product Portfolio

            15.1.3.3. Profitability by Market Segments

            15.1.3.4. Sales Footprint

            15.1.3.5. Strategy Overview

                15.1.3.5.1. Marketing Strategy

        15.1.4. AbbVie

            15.1.4.1. Overview

            15.1.4.2. Product Portfolio

            15.1.4.3. Profitability by Market Segments

            15.1.4.4. Sales Footprint

            15.1.4.5. Strategy Overview

                15.1.4.5.1. Marketing Strategy

        15.1.5. Gilead Sciences

            15.1.5.1. Overview

            15.1.5.2. Product Portfolio

            15.1.5.3. Profitability by Market Segments

            15.1.5.4. Sales Footprint

            15.1.5.5. Strategy Overview

                15.1.5.5.1. Marketing Strategy

        15.1.6. Astellas Pharma

            15.1.6.1. Overview

            15.1.6.2. Product Portfolio

            15.1.6.3. Profitability by Market Segments

            15.1.6.4. Sales Footprint

            15.1.6.5. Strategy Overview

                15.1.6.5.1. Marketing Strategy

        15.1.7. Japan Tobacco and Torii Pharmaceutical

            15.1.7.1. Overview

            15.1.7.2. Product Portfolio

            15.1.7.3. Profitability by Market Segments

            15.1.7.4. Sales Footprint

            15.1.7.5. Strategy Overview

                15.1.7.5.1. Marketing Strategy

        15.1.8. Incyte Corporation

            15.1.8.1. Overview

            15.1.8.2. Product Portfolio

            15.1.8.3. Profitability by Market Segments

            15.1.8.4. Sales Footprint

            15.1.8.5. Strategy Overview

                15.1.8.5.1. Marketing Strategy

        15.1.9. Bristol Myers Squibb

            15.1.9.1. Overview

            15.1.9.2. Product Portfolio

            15.1.9.3. Profitability by Market Segments

            15.1.9.4. Sales Footprint

            15.1.9.5. Strategy Overview

                15.1.9.5.1. Marketing Strategy

        15.1.10. Galapagos NV

            15.1.10.1. Overview

            15.1.10.2. Product Portfolio

            15.1.10.3. Profitability by Market Segments

            15.1.10.4. Sales Footprint

            15.1.10.5. Strategy Overview

                15.1.10.5.1. Marketing Strategy

16. Assumptions & Acronyms Used

17. Research Methodology

Don't pay for what you don't need

Customize your report by selecting specific countries or regions and save 30%!

List of Tables

Table 1: Global Market Value (US$ Million) Forecast by Region, 2018 to 2033

Table 2: Global Market Value (US$ Million) Forecast by Treatment, 2018 to 2033

Table 3: Global Market Value (US$ Million) Forecast by Drug, 2018 to 2033

Table 4: North America Market Value (US$ Million) Forecast by Country, 2018 to 2033

Table 5: North America Market Value (US$ Million) Forecast by Treatment, 2018 to 2033

Table 6: North America Market Value (US$ Million) Forecast by Drug, 2018 to 2033

Table 7: Latin America Market Value (US$ Million) Forecast by Country, 2018 to 2033

Table 8: Latin America Market Value (US$ Million) Forecast by Treatment, 2018 to 2033

Table 9: Latin America Market Value (US$ Million) Forecast by Drug, 2018 to 2033

Table 10: Europe Market Value (US$ Million) Forecast by Country, 2018 to 2033

Table 11: Europe Market Value (US$ Million) Forecast by Treatment, 2018 to 2033

Table 12: Europe Market Value (US$ Million) Forecast by Drug, 2018 to 2033

Table 13: Asia Pacific Market Value (US$ Million) Forecast by Country, 2018 to 2033

Table 14: Asia Pacific Market Value (US$ Million) Forecast by Treatment, 2018 to 2033

Table 15: Asia Pacific Market Value (US$ Million) Forecast by Drug, 2018 to 2033

Table 16: MEA Market Value (US$ Million) Forecast by Country, 2018 to 2033

Table 17: MEA Market Value (US$ Million) Forecast by Treatment, 2018 to 2033

Table 18: MEA Market Value (US$ Million) Forecast by Drug, 2018 to 2033
Sabyasachi Ghosh
Sabyasachi Ghosh

Principal Consultant

Talk to Analyst

Find your sweet spots for generating winning opportunities in this market.

List of Charts

Figure 1: Global Market Value (US$ Million) by Treatment, 2023 to 2033

Figure 2: Global Market Value (US$ Million) by Drug, 2023 to 2033

Figure 3: Global Market Value (US$ Million) by Region, 2023 to 2033

Figure 4: Global Market Value (US$ Million) Analysis by Region, 2018 to 2033

Figure 5: Global Market Value Share (%) and BPS Analysis by Region, 2023 to 2033

Figure 6: Global Market Y-o-Y Growth (%) Projections by Region, 2023 to 2033

Figure 7: Global Market Value (US$ Million) Analysis by Treatment, 2018 to 2033

Figure 8: Global Market Value Share (%) and BPS Analysis by Treatment, 2023 to 2033

Figure 9: Global Market Y-o-Y Growth (%) Projections by Treatment, 2023 to 2033

Figure 10: Global Market Value (US$ Million) Analysis by Drug, 2018 to 2033

Figure 11: Global Market Value Share (%) and BPS Analysis by Drug, 2023 to 2033

Figure 12: Global Market Y-o-Y Growth (%) Projections by Drug, 2023 to 2033

Figure 13: Global Market Attractiveness by Treatment, 2023 to 2033

Figure 14: Global Market Attractiveness by Drug, 2023 to 2033

Figure 15: Global Market Attractiveness by Region, 2023 to 2033

Figure 16: North America Market Value (US$ Million) by Treatment, 2023 to 2033

Figure 17: North America Market Value (US$ Million) by Drug, 2023 to 2033

Figure 18: North America Market Value (US$ Million) by Country, 2023 to 2033

Figure 19: North America Market Value (US$ Million) Analysis by Country, 2018 to 2033

Figure 20: North America Market Value Share (%) and BPS Analysis by Country, 2023 to 2033

Figure 21: North America Market Y-o-Y Growth (%) Projections by Country, 2023 to 2033

Figure 22: North America Market Value (US$ Million) Analysis by Treatment, 2018 to 2033

Figure 23: North America Market Value Share (%) and BPS Analysis by Treatment, 2023 to 2033

Figure 24: North America Market Y-o-Y Growth (%) Projections by Treatment, 2023 to 2033

Figure 25: North America Market Value (US$ Million) Analysis by Drug, 2018 to 2033

Figure 26: North America Market Value Share (%) and BPS Analysis by Drug, 2023 to 2033

Figure 27: North America Market Y-o-Y Growth (%) Projections by Drug, 2023 to 2033

Figure 28: North America Market Attractiveness by Treatment, 2023 to 2033

Figure 29: North America Market Attractiveness by Drug, 2023 to 2033

Figure 30: North America Market Attractiveness by Country, 2023 to 2033

Figure 31: Latin America Market Value (US$ Million) by Treatment, 2023 to 2033

Figure 32: Latin America Market Value (US$ Million) by Drug, 2023 to 2033

Figure 33: Latin America Market Value (US$ Million) by Country, 2023 to 2033

Figure 34: Latin America Market Value (US$ Million) Analysis by Country, 2018 to 2033

Figure 35: Latin America Market Value Share (%) and BPS Analysis by Country, 2023 to 2033

Figure 36: Latin America Market Y-o-Y Growth (%) Projections by Country, 2023 to 2033

Figure 37: Latin America Market Value (US$ Million) Analysis by Treatment, 2018 to 2033

Figure 38: Latin America Market Value Share (%) and BPS Analysis by Treatment, 2023 to 2033

Figure 39: Latin America Market Y-o-Y Growth (%) Projections by Treatment, 2023 to 2033

Figure 40: Latin America Market Value (US$ Million) Analysis by Drug, 2018 to 2033

Figure 41: Latin America Market Value Share (%) and BPS Analysis by Drug, 2023 to 2033

Figure 42: Latin America Market Y-o-Y Growth (%) Projections by Drug, 2023 to 2033

Figure 43: Latin America Market Attractiveness by Treatment, 2023 to 2033

Figure 44: Latin America Market Attractiveness by Drug, 2023 to 2033

Figure 45: Latin America Market Attractiveness by Country, 2023 to 2033

Figure 46: Europe Market Value (US$ Million) by Treatment, 2023 to 2033

Figure 47: Europe Market Value (US$ Million) by Drug, 2023 to 2033

Figure 48: Europe Market Value (US$ Million) by Country, 2023 to 2033

Figure 49: Europe Market Value (US$ Million) Analysis by Country, 2018 to 2033

Figure 50: Europe Market Value Share (%) and BPS Analysis by Country, 2023 to 2033

Figure 51: Europe Market Y-o-Y Growth (%) Projections by Country, 2023 to 2033

Figure 52: Europe Market Value (US$ Million) Analysis by Treatment, 2018 to 2033

Figure 53: Europe Market Value Share (%) and BPS Analysis by Treatment, 2023 to 2033

Figure 54: Europe Market Y-o-Y Growth (%) Projections by Treatment, 2023 to 2033

Figure 55: Europe Market Value (US$ Million) Analysis by Drug, 2018 to 2033

Figure 56: Europe Market Value Share (%) and BPS Analysis by Drug, 2023 to 2033

Figure 57: Europe Market Y-o-Y Growth (%) Projections by Drug, 2023 to 2033

Figure 58: Europe Market Attractiveness by Treatment, 2023 to 2033

Figure 59: Europe Market Attractiveness by Drug, 2023 to 2033

Figure 60: Europe Market Attractiveness by Country, 2023 to 2033

Figure 61: Asia Pacific Market Value (US$ Million) by Treatment, 2023 to 2033

Figure 62: Asia Pacific Market Value (US$ Million) by Drug, 2023 to 2033

Figure 63: Asia Pacific Market Value (US$ Million) by Country, 2023 to 2033

Figure 64: Asia Pacific Market Value (US$ Million) Analysis by Country, 2018 to 2033

Figure 65: Asia Pacific Market Value Share (%) and BPS Analysis by Country, 2023 to 2033

Figure 66: Asia Pacific Market Y-o-Y Growth (%) Projections by Country, 2023 to 2033

Figure 67: Asia Pacific Market Value (US$ Million) Analysis by Treatment, 2018 to 2033

Figure 68: Asia Pacific Market Value Share (%) and BPS Analysis by Treatment, 2023 to 2033

Figure 69: Asia Pacific Market Y-o-Y Growth (%) Projections by Treatment, 2023 to 2033

Figure 70: Asia Pacific Market Value (US$ Million) Analysis by Drug, 2018 to 2033

Figure 71: Asia Pacific Market Value Share (%) and BPS Analysis by Drug, 2023 to 2033

Figure 72: Asia Pacific Market Y-o-Y Growth (%) Projections by Drug, 2023 to 2033

Figure 73: Asia Pacific Market Attractiveness by Treatment, 2023 to 2033

Figure 74: Asia Pacific Market Attractiveness by Drug, 2023 to 2033

Figure 75: Asia Pacific Market Attractiveness by Country, 2023 to 2033

Figure 76: MEA Market Value (US$ Million) by Treatment, 2023 to 2033

Figure 77: MEA Market Value (US$ Million) by Drug, 2023 to 2033

Figure 78: MEA Market Value (US$ Million) by Country, 2023 to 2033

Figure 79: MEA Market Value (US$ Million) Analysis by Country, 2018 to 2033

Figure 80: MEA Market Value Share (%) and BPS Analysis by Country, 2023 to 2033

Figure 81: MEA Market Y-o-Y Growth (%) Projections by Country, 2023 to 2033

Figure 82: MEA Market Value (US$ Million) Analysis by Treatment, 2018 to 2033

Figure 83: MEA Market Value Share (%) and BPS Analysis by Treatment, 2023 to 2033

Figure 84: MEA Market Y-o-Y Growth (%) Projections by Treatment, 2023 to 2033

Figure 85: MEA Market Value (US$ Million) Analysis by Drug, 2018 to 2033

Figure 86: MEA Market Value Share (%) and BPS Analysis by Drug, 2023 to 2033

Figure 87: MEA Market Y-o-Y Growth (%) Projections by Drug, 2023 to 2033

Figure 88: MEA Market Attractiveness by Treatment, 2023 to 2033

Figure 89: MEA Market Attractiveness by Drug, 2023 to 2033

Figure 90: MEA Market Attractiveness by Country, 2023 to 2033

Recommendations

Healthcare

Kinase Inhibitors For Cancer Treatment Market

Published : November 2022

Healthcare

Creatine Kinase Reagent Market

Published : September 2022

Explore Healthcare Insights

View Reports

Kinase Inhibitor in Autoimmune Diseases Market