Mine Scaler Market Size and Share Forecast Outlook 2025 to 2035

The Mine Scaler Market is estimated to be valued at USD 1.7 billion in 2025 and is projected to reach USD 2.4 billion by 2035, registering a compound annual growth rate (CAGR) of 3.5% over the forecast period.
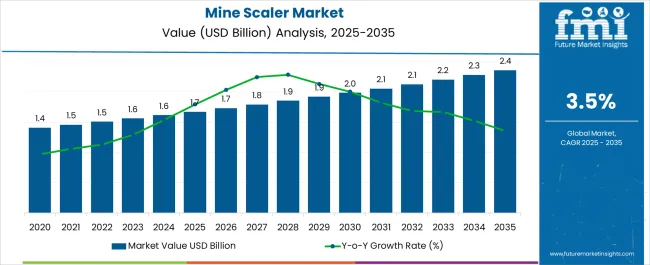
Quick Stats for Mine Scaler Market

  • Mine Scaler Market Value (2025): USD 1.7 billion
  • Mine Scaler Market Forecast Value (2035): USD 2.4 billion
  • Mine Scaler Market Forecast CAGR: 3.5%
  • Leading Segment in Mine Scaler Market in 2025: Up To 10 Feet (40.0%)
  • Key Growth Regions in Mine Scaler Market: North America, Asia-Pacific, Europe
  • Top Key Players in Mine Scaler Market: Astec Industries, Alamo Group, Ergo Dveloppement, Jama Mining Machines, Breaker Technology

Mine Scaler Market Market Value Analysis

Mine Scaler Market Key Takeaways

Metric Value
Mine Scaler Market Estimated Value in (2025 E) USD 1.7 billion
Mine Scaler Market Forecast Value in (2035 F) USD 2.4 billion
Forecast CAGR (2025 to 2035) 3.5%

Why is the Mine Scaler Market Growing?

The Mine Scaler market is experiencing steady growth driven by the increasing demand for enhanced safety and operational efficiency in underground and surface mining operations. The current market scenario reflects a shift towards equipment that can efficiently remove loose rock and scale from mine walls, thereby reducing accident risks and improving workflow continuity. Technological advancements in automation and operator-assisted scaling have further contributed to the adoption of scalable mining equipment.

The market is supported by increasing investments in coal, metal, and mineral mining, where operational efficiency and safety standards are strictly enforced. As mining operations expand to deeper shafts and more complex geological formations, the demand for precise and reliable scaling equipment is rising. Additionally, equipment that can be easily adapted to different mine environments is being preferred.

The future outlook is expected to be driven by integration with digital monitoring systems, improved power efficiency, and ergonomic designs that reduce operator fatigue Overall, the market is projected to grow steadily due to heightened safety regulations and increasing mechanization in the mining sector.

Segmental Analysis

The mine scaler market is segmented by operational height, scaler type, application, and geographic regions. By operational height, mine scaler market is divided into Up To 10 Feet, 10 – 25 Feet, and More Than 25 Feet. In terms of scaler type, mine scaler market is classified into Hammer Feed Scaler, Vibratory Pick Scaler, and Boom Scaler. Based on application, mine scaler market is segmented into Coal Mining, Metal Mining, and Mineral Mining. Regionally, the mine scaler industry is classified into North America, Latin America, Western Europe, Eastern Europe, Balkan & Baltic Countries, Russia & Belarus, Central Asia, East Asia, South Asia & Pacific, and the Middle East & Africa.
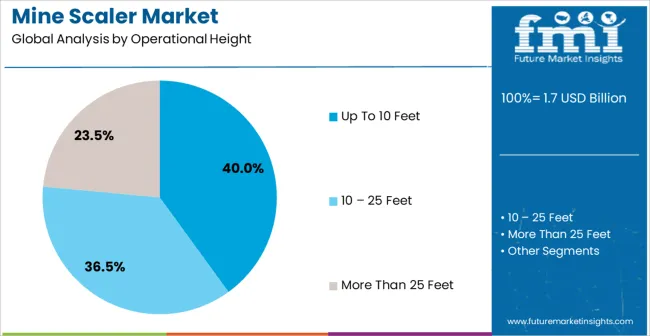
Insights into the Up To 10 Feet Operational Height Segment

Mine Scaler Market Analysis By Operational Height

The operational height segment reaching up to 10 feet is expected to account for 40.00% of the Mine Scaler market revenue in 2025. This leading position is being attributed to its versatility and suitability for a wide range of underground and surface mining conditions where moderate scaling reach is sufficient. Equipment in this category is widely adopted because it provides a balance between maneuverability and operational efficiency, allowing operators to remove loose rock safely without excessive setup time.

The segment has benefited from the increasing emphasis on worker safety and regulatory compliance, as well as the growing preference for machinery that reduces manual labor. Additionally, the ability to scale efficiently within standard mine shafts and tunnels without requiring structural modifications has reinforced its adoption.

Future growth is expected to be supported by enhancements in power delivery, durability, and operator assistance features that increase productivity while maintaining a high level of safety The ease of integration with different scaling techniques and adaptability to varying rock conditions further positions this segment as a preferred choice in the market.
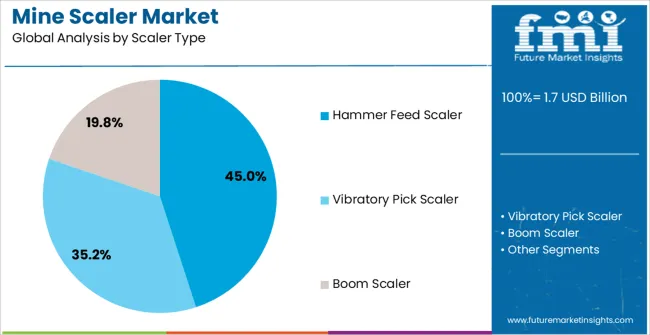
Insights into the Hammer Feed Scaler Segment

Mine Scaler Market Analysis By Scaler Type

The Hammer Feed Scaler segment is projected to hold 45.00% of the Mine Scaler market revenue in 2025, emerging as the leading scaler type. This dominance is being driven by its robust performance in removing hard and loosely attached rock in both coal and mineral mining operations. The segment’s growth has been fueled by the equipment’s ability to deliver consistent scaling results while minimizing operator exposure to hazardous areas.

The hammer feed mechanism allows precise control over scaling operations, reducing downtime and improving operational efficiency. Adoption has been further encouraged by the equipment’s compatibility with varying mine layouts and its durability under intensive usage. As safety regulations tighten and mines seek to reduce human intervention in high-risk zones, hammer feed scalers are increasingly being preferred.

Future market growth is expected to be driven by technological improvements that enhance reliability, reduce maintenance needs, and integrate ergonomic controls, allowing safer and more efficient scaling operations The combination of effectiveness, reliability, and adaptability ensures that hammer feed scalers remain a top choice in the mining sector.
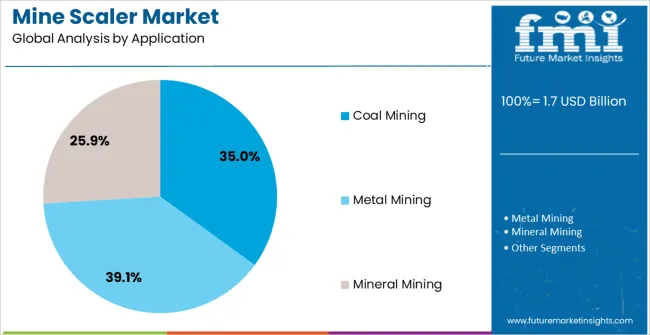
Insights into the Coal Mining Application Segment

Mine Scaler Market Analysis By Application

The coal mining application segment is expected to capture 35.00% of the Mine Scaler market revenue in 2025, making it the largest end-use application. This leading share is being attributed to the high requirement for continuous scaling operations in coal mines, where loose rock can pose significant safety hazards and operational interruptions. Coal mines have widely adopted mechanized scaling equipment to enhance worker safety, reduce accidents, and ensure compliance with strict regulatory standards.

The growth of this segment has been accelerated by the ongoing need to maintain production efficiency while addressing the unique challenges of underground coal mining environments. Equipment that can operate reliably under dusty and confined conditions has been particularly favored. The adoption of advanced scaling systems has also been supported by the push towards automation and reduced manual intervention.

As coal production continues to expand in several regions, the demand for efficient and safe scaling solutions is expected to remain strong Future growth will be driven by improvements in equipment longevity, operational speed, and integration with broader mine safety and monitoring systems.

Market Overview

Mine Scaler Market: Introduction

Underground mining is carried out for the extraction of minerals and ores that are buried far below the earth’s surface. Mine scalers are underground mining equipment used for scaling mines. Mine scalers are broadly categorised as hammer feed scalers, vibratory pick scalers and boom scalers.

Among all the types of mine scalers, the boom type scaler is gaining momentum in the mine scaler market owing to high performance, durability and increased scaling productivity. The continuously increasing demand for minerals and rare metals is driving the underground mining sector, which is expected to drive the mine scaler market.

In addition, technologically advanced mine scalers are being developed through innovative methods owing to the growing demand for increasing productivity and safety.
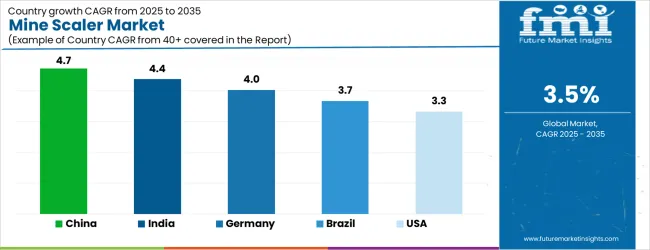
Analysis of Mine Scaler Market By Key Countries

Mine Scaler Market Cagr Analysis By Country

Country CAGR
China 4.7%
India 4.4%
Germany 4.0%
Brazil 3.7%
USA 3.3%
UK 3.0%
Japan 2.6%

Country-wise Analysis

The Mine Scaler Market is expected to register a CAGR of 3.5% during the forecast period, exhibiting varied country level momentum. China leads with the highest CAGR of 10.1%, followed by India at 9.4%. Developed markets such as Germany, France, and the UK continue to expand steadily, while the USA is likely to grow at consistent rates. Japan posts the lowest CAGR at 2.6%, yet still underscores a broadly positive trajectory for the global Mine Scaler Market. In 2024, Germany held a dominant revenue in the Western Europe market and is expected to grow with a CAGR of 4.0%. The USA Mine Scaler Market is estimated to be valued at USD 615.9 million in 2025 and is anticipated to reach a valuation of USD 615.9 million by 2035. Sales are projected to rise at a CAGR of 0.0% over the forecast period between 2025 and 2035. While Japan and South Korea markets are estimated to be valued at USD 75.9 million and USD 42.8 million respectively in 2025.
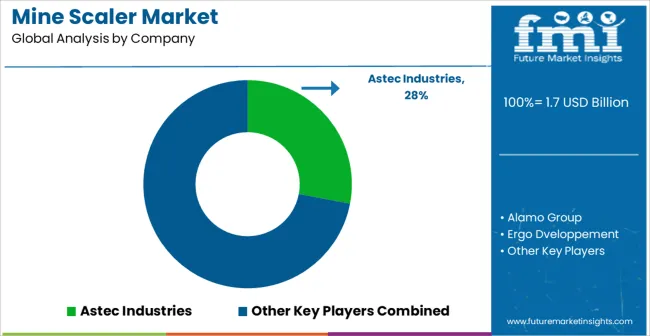
Key Players in the Mine Scaler Market

Mine Scaler Market Analysis By Company

  • Astec Industries
  • Alamo Group
  • Ergo Dveloppement
  • Jama Mining Machines
  • Breaker Technology

Scope of the Report

Item Value
Quantitative Units USD 1.7 Billion
Operational Height Up To 10 Feet, 10 – 25 Feet, and More Than 25 Feet
Scaler Type Hammer Feed Scaler, Vibratory Pick Scaler, and Boom Scaler
Application Coal Mining, Metal Mining, and Mineral Mining
Regions Covered North America, Europe, Asia-Pacific, Latin America, Middle East & Africa
Country Covered United States, Canada, Germany, France, United Kingdom, China, Japan, India, Brazil, South Africa
Key Companies Profiled Astec Industries, Alamo Group, Ergo Dveloppement, Jama Mining Machines, and Breaker Technology

Mine Scaler Market by Segments

Operational Height:

  • Up To 10 Feet
  • 10 – 25 Feet
  • More Than 25 Feet

Scaler Type:

  • Hammer Feed Scaler
  • Vibratory Pick Scaler
  • Boom Scaler

Application:

  • Coal Mining
  • Metal Mining
  • Mineral Mining

Region:

  • North America
    • USA
    • Canada
    • Mexico
  • Latin America
    • Brazil
    • Chile
    • Rest of Latin America
  • Western Europe
    • Germany
    • UK
    • Italy
    • Spain
    • France
    • Nordic
    • BENELUX
    • Rest of Western Europe
  • Eastern Europe
    • Russia
    • Poland
    • Hungary
    • Balkan & Baltic
    • Rest of Eastern Europe
  • East Asia
    • China
    • Japan
    • South Korea
  • South Asia and Pacific
    • India
    • ASEAN
    • Australia & New Zealand
    • Rest of South Asia and Pacific
  • Middle East & Africa
    • Kingdom of Saudi Arabia
    • Other GCC Countries
    • Turkiye
    • South Africa
    • Other African Union
    • Rest of Middle East & Africa

Table of Content

  1. Executive Summary
    • Global Market Outlook
    • Demand-side Trends
    • Supply-side Trends
    • Technology Roadmap Analysis
    • Analysis and Recommendations
  2. Market Overview
    • Market Coverage / Taxonomy
    • Market Definition / Scope / Limitations
  3. Market Background
    • Market Dynamics
      • Drivers
      • Restraints
      • Opportunity
      • Trends
    • Scenario Forecast
      • Demand in Optimistic Scenario
      • Demand in Likely Scenario
      • Demand in Conservative Scenario
    • Opportunity Map Analysis
    • Product Life Cycle Analysis
    • Supply Chain Analysis
    • Investment Feasibility Matrix
    • Value Chain Analysis
    • PESTLE and Porter’s Analysis
    • Regulatory Landscape
    • Regional Parent Market Outlook
    • Production and Consumption Statistics
    • Import and Export Statistics
  4. Global Market Analysis 2020 to 2024 and Forecast, 2025 to 2035
    • Historical Market Size Value (USD Million) Analysis, 2020 to 2024
    • Current and Future Market Size Value (USD Million) Projections, 2025 to 2035
      • Y-o-Y Growth Trend Analysis
      • Absolute $ Opportunity Analysis
  5. Global Market Pricing Analysis 2020 to 2024 and Forecast 2025 to 2035
  6. Global Market Analysis 2020 to 2024 and Forecast 2025 to 2035, By Operational Height
    • Introduction / Key Findings
    • Historical Market Size Value (USD Million) Analysis By Operational Height , 2020 to 2024
    • Current and Future Market Size Value (USD Million) Analysis and Forecast By Operational Height , 2025 to 2035
      • Up To 10 Feet
      • 10 – 25 Feet
      • More Than 25 Feet
    • Y-o-Y Growth Trend Analysis By Operational Height , 2020 to 2024
    • Absolute $ Opportunity Analysis By Operational Height , 2025 to 2035
  7. Global Market Analysis 2020 to 2024 and Forecast 2025 to 2035, By Scaler Type
    • Introduction / Key Findings
    • Historical Market Size Value (USD Million) Analysis By Scaler Type, 2020 to 2024
    • Current and Future Market Size Value (USD Million) Analysis and Forecast By Scaler Type, 2025 to 2035
      • Hammer Feed Scaler
      • Vibratory Pick Scaler
      • Boom Scaler
    • Y-o-Y Growth Trend Analysis By Scaler Type, 2020 to 2024
    • Absolute $ Opportunity Analysis By Scaler Type, 2025 to 2035
  8. Global Market Analysis 2020 to 2024 and Forecast 2025 to 2035, By Application
    • Introduction / Key Findings
    • Historical Market Size Value (USD Million) Analysis By Application, 2020 to 2024
    • Current and Future Market Size Value (USD Million) Analysis and Forecast By Application, 2025 to 2035
      • Coal Mining
      • Metal Mining
      • Mineral Mining
    • Y-o-Y Growth Trend Analysis By Application, 2020 to 2024
    • Absolute $ Opportunity Analysis By Application, 2025 to 2035
  9. Global Market Analysis 2020 to 2024 and Forecast 2025 to 2035, By Region
    • Introduction
    • Historical Market Size Value (USD Million) Analysis By Region, 2020 to 2024
    • Current Market Size Value (USD Million) Analysis and Forecast By Region, 2025 to 2035
      • North America
      • Latin America
      • Western Europe
      • Eastern Europe
      • East Asia
      • South Asia and Pacific
      • Middle East & Africa
    • Market Attractiveness Analysis By Region
  10. North America Market Analysis 2020 to 2024 and Forecast 2025 to 2035, By Country
    • Historical Market Size Value (USD Million) Trend Analysis By Market Taxonomy, 2020 to 2024
    • Market Size Value (USD Million) Forecast By Market Taxonomy, 2025 to 2035
      • By Country
        • USA
        • Canada
        • Mexico
      • By Operational Height
      • By Scaler Type
      • By Application
    • Market Attractiveness Analysis
      • By Country
      • By Operational Height
      • By Scaler Type
      • By Application
    • Key Takeaways
  11. Latin America Market Analysis 2020 to 2024 and Forecast 2025 to 2035, By Country
    • Historical Market Size Value (USD Million) Trend Analysis By Market Taxonomy, 2020 to 2024
    • Market Size Value (USD Million) Forecast By Market Taxonomy, 2025 to 2035
      • By Country
        • Brazil
        • Chile
        • Rest of Latin America
      • By Operational Height
      • By Scaler Type
      • By Application
    • Market Attractiveness Analysis
      • By Country
      • By Operational Height
      • By Scaler Type
      • By Application
    • Key Takeaways
  12. Western Europe Market Analysis 2020 to 2024 and Forecast 2025 to 2035, By Country
    • Historical Market Size Value (USD Million) Trend Analysis By Market Taxonomy, 2020 to 2024
    • Market Size Value (USD Million) Forecast By Market Taxonomy, 2025 to 2035
      • By Country
        • Germany
        • UK
        • Italy
        • Spain
        • France
        • Nordic
        • BENELUX
        • Rest of Western Europe
      • By Operational Height
      • By Scaler Type
      • By Application
    • Market Attractiveness Analysis
      • By Country
      • By Operational Height
      • By Scaler Type
      • By Application
    • Key Takeaways
  13. Eastern Europe Market Analysis 2020 to 2024 and Forecast 2025 to 2035, By Country
    • Historical Market Size Value (USD Million) Trend Analysis By Market Taxonomy, 2020 to 2024
    • Market Size Value (USD Million) Forecast By Market Taxonomy, 2025 to 2035
      • By Country
        • Russia
        • Poland
        • Hungary
        • Balkan & Baltic
        • Rest of Eastern Europe
      • By Operational Height
      • By Scaler Type
      • By Application
    • Market Attractiveness Analysis
      • By Country
      • By Operational Height
      • By Scaler Type
      • By Application
    • Key Takeaways
  14. East Asia Market Analysis 2020 to 2024 and Forecast 2025 to 2035, By Country
    • Historical Market Size Value (USD Million) Trend Analysis By Market Taxonomy, 2020 to 2024
    • Market Size Value (USD Million) Forecast By Market Taxonomy, 2025 to 2035
      • By Country
        • China
        • Japan
        • South Korea
      • By Operational Height
      • By Scaler Type
      • By Application
    • Market Attractiveness Analysis
      • By Country
      • By Operational Height
      • By Scaler Type
      • By Application
    • Key Takeaways
  15. South Asia and Pacific Market Analysis 2020 to 2024 and Forecast 2025 to 2035, By Country
    • Historical Market Size Value (USD Million) Trend Analysis By Market Taxonomy, 2020 to 2024
    • Market Size Value (USD Million) Forecast By Market Taxonomy, 2025 to 2035
      • By Country
        • India
        • ASEAN
        • Australia & New Zealand
        • Rest of South Asia and Pacific
      • By Operational Height
      • By Scaler Type
      • By Application
    • Market Attractiveness Analysis
      • By Country
      • By Operational Height
      • By Scaler Type
      • By Application
    • Key Takeaways
  16. Middle East & Africa Market Analysis 2020 to 2024 and Forecast 2025 to 2035, By Country
    • Historical Market Size Value (USD Million) Trend Analysis By Market Taxonomy, 2020 to 2024
    • Market Size Value (USD Million) Forecast By Market Taxonomy, 2025 to 2035
      • By Country
        • Kingdom of Saudi Arabia
        • Other GCC Countries
        • Turkiye
        • South Africa
        • Other African Union
        • Rest of Middle East & Africa
      • By Operational Height
      • By Scaler Type
      • By Application
    • Market Attractiveness Analysis
      • By Country
      • By Operational Height
      • By Scaler Type
      • By Application
    • Key Takeaways
  17. Key Countries Market Analysis
    • USA
      • Pricing Analysis
      • Market Share Analysis, 2024
        • By Operational Height
        • By Scaler Type
        • By Application
    • Canada
      • Pricing Analysis
      • Market Share Analysis, 2024
        • By Operational Height
        • By Scaler Type
        • By Application
    • Mexico
      • Pricing Analysis
      • Market Share Analysis, 2024
        • By Operational Height
        • By Scaler Type
        • By Application
    • Brazil
      • Pricing Analysis
      • Market Share Analysis, 2024
        • By Operational Height
        • By Scaler Type
        • By Application
    • Chile
      • Pricing Analysis
      • Market Share Analysis, 2024
        • By Operational Height
        • By Scaler Type
        • By Application
    • Germany
      • Pricing Analysis
      • Market Share Analysis, 2024
        • By Operational Height
        • By Scaler Type
        • By Application
    • UK
      • Pricing Analysis
      • Market Share Analysis, 2024
        • By Operational Height
        • By Scaler Type
        • By Application
    • Italy
      • Pricing Analysis
      • Market Share Analysis, 2024
        • By Operational Height
        • By Scaler Type
        • By Application
    • Spain
      • Pricing Analysis
      • Market Share Analysis, 2024
        • By Operational Height
        • By Scaler Type
        • By Application
    • France
      • Pricing Analysis
      • Market Share Analysis, 2024
        • By Operational Height
        • By Scaler Type
        • By Application
    • India
      • Pricing Analysis
      • Market Share Analysis, 2024
        • By Operational Height
        • By Scaler Type
        • By Application
    • ASEAN
      • Pricing Analysis
      • Market Share Analysis, 2024
        • By Operational Height
        • By Scaler Type
        • By Application
    • Australia & New Zealand
      • Pricing Analysis
      • Market Share Analysis, 2024
        • By Operational Height
        • By Scaler Type
        • By Application
    • China
      • Pricing Analysis
      • Market Share Analysis, 2024
        • By Operational Height
        • By Scaler Type
        • By Application
    • Japan
      • Pricing Analysis
      • Market Share Analysis, 2024
        • By Operational Height
        • By Scaler Type
        • By Application
    • South Korea
      • Pricing Analysis
      • Market Share Analysis, 2024
        • By Operational Height
        • By Scaler Type
        • By Application
    • Russia
      • Pricing Analysis
      • Market Share Analysis, 2024
        • By Operational Height
        • By Scaler Type
        • By Application
    • Poland
      • Pricing Analysis
      • Market Share Analysis, 2024
        • By Operational Height
        • By Scaler Type
        • By Application
    • Hungary
      • Pricing Analysis
      • Market Share Analysis, 2024
        • By Operational Height
        • By Scaler Type
        • By Application
    • Kingdom of Saudi Arabia
      • Pricing Analysis
      • Market Share Analysis, 2024
        • By Operational Height
        • By Scaler Type
        • By Application
    • Turkiye
      • Pricing Analysis
      • Market Share Analysis, 2024
        • By Operational Height
        • By Scaler Type
        • By Application
    • South Africa
      • Pricing Analysis
      • Market Share Analysis, 2024
        • By Operational Height
        • By Scaler Type
        • By Application
  18. Market Structure Analysis
    • Competition Dashboard
    • Competition Benchmarking
    • Market Share Analysis of Top Players
      • By Regional
      • By Operational Height
      • By Scaler Type
      • By Application
  19. Competition Analysis
    • Competition Deep Dive
      • Astec Industries
        • Overview
        • Product Portfolio
        • Profitability by Market Segments (Product/Age /Sales Channel/Region)
        • Sales Footprint
        • Strategy Overview
          • Marketing Strategy
          • Product Strategy
          • Channel Strategy
      • Alamo Group
      • Ergo Dveloppement
      • Jama Mining Machines
      • Breaker Technology
  20. Assumptions & Acronyms Used
  21. Research Methodology

List of Tables

  • Table 1: Global Market Value (USD Million) Forecast by Region, 2020-2035
  • Table 2: Global Market Value (USD Million) Forecast by Operational Height , 2020-2035
  • Table 3: Global Market Value (USD Million) Forecast by Scaler Type, 2020-2035
  • Table 4: Global Market Value (USD Million) Forecast by Application, 2020-2035
  • Table 5: North America Market Value (USD Million) Forecast by Country, 2020-2035
  • Table 6: North America Market Value (USD Million) Forecast by Operational Height , 2020-2035
  • Table 7: North America Market Value (USD Million) Forecast by Scaler Type, 2020-2035
  • Table 8: North America Market Value (USD Million) Forecast by Application, 2020-2035
  • Table 9: Latin America Market Value (USD Million) Forecast by Country, 2020-2035
  • Table 10: Latin America Market Value (USD Million) Forecast by Operational Height , 2020-2035
  • Table 11: Latin America Market Value (USD Million) Forecast by Scaler Type, 2020-2035
  • Table 12: Latin America Market Value (USD Million) Forecast by Application, 2020-2035
  • Table 13: Western Europe Market Value (USD Million) Forecast by Country, 2020-2035
  • Table 14: Western Europe Market Value (USD Million) Forecast by Operational Height , 2020-2035
  • Table 15: Western Europe Market Value (USD Million) Forecast by Scaler Type, 2020-2035
  • Table 16: Western Europe Market Value (USD Million) Forecast by Application, 2020-2035
  • Table 17: Eastern Europe Market Value (USD Million) Forecast by Country, 2020-2035
  • Table 18: Eastern Europe Market Value (USD Million) Forecast by Operational Height , 2020-2035
  • Table 19: Eastern Europe Market Value (USD Million) Forecast by Scaler Type, 2020-2035
  • Table 20: Eastern Europe Market Value (USD Million) Forecast by Application, 2020-2035
  • Table 21: East Asia Market Value (USD Million) Forecast by Country, 2020-2035
  • Table 22: East Asia Market Value (USD Million) Forecast by Operational Height , 2020-2035
  • Table 23: East Asia Market Value (USD Million) Forecast by Scaler Type, 2020-2035
  • Table 24: East Asia Market Value (USD Million) Forecast by Application, 2020-2035
  • Table 25: South Asia and Pacific Market Value (USD Million) Forecast by Country, 2020-2035
  • Table 26: South Asia and Pacific Market Value (USD Million) Forecast by Operational Height , 2020-2035
  • Table 27: South Asia and Pacific Market Value (USD Million) Forecast by Scaler Type, 2020-2035
  • Table 28: South Asia and Pacific Market Value (USD Million) Forecast by Application, 2020-2035
  • Table 29: Middle East & Africa Market Value (USD Million) Forecast by Country, 2020-2035
  • Table 30: Middle East & Africa Market Value (USD Million) Forecast by Operational Height , 2020-2035
  • Table 31: Middle East & Africa Market Value (USD Million) Forecast by Scaler Type, 2020-2035
  • Table 32: Middle East & Africa Market Value (USD Million) Forecast by Application, 2020-2035

List of Figures

  • Figure 1: Global Market Pricing Analysis
  • Figure 2: Global Market Value (USD Million) Forecast 2020-2035
  • Figure 3: Global Market Value Share and BPS Analysis by Operational Height , 2025 and 2035
  • Figure 4: Global Market Y-o-Y Growth Comparison by Operational Height , 2025-2035
  • Figure 5: Global Market Attractiveness Analysis by Operational Height
  • Figure 6: Global Market Value Share and BPS Analysis by Scaler Type, 2025 and 2035
  • Figure 7: Global Market Y-o-Y Growth Comparison by Scaler Type, 2025-2035
  • Figure 8: Global Market Attractiveness Analysis by Scaler Type
  • Figure 9: Global Market Value Share and BPS Analysis by Application, 2025 and 2035
  • Figure 10: Global Market Y-o-Y Growth Comparison by Application, 2025-2035
  • Figure 11: Global Market Attractiveness Analysis by Application
  • Figure 12: Global Market Value (USD Million) Share and BPS Analysis by Region, 2025 and 2035
  • Figure 13: Global Market Y-o-Y Growth Comparison by Region, 2025-2035
  • Figure 14: Global Market Attractiveness Analysis by Region
  • Figure 15: North America Market Incremental Dollar Opportunity, 2025-2035
  • Figure 16: Latin America Market Incremental Dollar Opportunity, 2025-2035
  • Figure 17: Western Europe Market Incremental Dollar Opportunity, 2025-2035
  • Figure 18: Eastern Europe Market Incremental Dollar Opportunity, 2025-2035
  • Figure 19: East Asia Market Incremental Dollar Opportunity, 2025-2035
  • Figure 20: South Asia and Pacific Market Incremental Dollar Opportunity, 2025-2035
  • Figure 21: Middle East & Africa Market Incremental Dollar Opportunity, 2025-2035
  • Figure 22: North America Market Value Share and BPS Analysis by Country, 2025 and 2035
  • Figure 23: North America Market Value Share and BPS Analysis by Operational Height , 2025 and 2035
  • Figure 24: North America Market Y-o-Y Growth Comparison by Operational Height , 2025-2035
  • Figure 25: North America Market Attractiveness Analysis by Operational Height
  • Figure 26: North America Market Value Share and BPS Analysis by Scaler Type, 2025 and 2035
  • Figure 27: North America Market Y-o-Y Growth Comparison by Scaler Type, 2025-2035
  • Figure 28: North America Market Attractiveness Analysis by Scaler Type
  • Figure 29: North America Market Value Share and BPS Analysis by Application, 2025 and 2035
  • Figure 30: North America Market Y-o-Y Growth Comparison by Application, 2025-2035
  • Figure 31: North America Market Attractiveness Analysis by Application
  • Figure 32: Latin America Market Value Share and BPS Analysis by Country, 2025 and 2035
  • Figure 33: Latin America Market Value Share and BPS Analysis by Operational Height , 2025 and 2035
  • Figure 34: Latin America Market Y-o-Y Growth Comparison by Operational Height , 2025-2035
  • Figure 35: Latin America Market Attractiveness Analysis by Operational Height
  • Figure 36: Latin America Market Value Share and BPS Analysis by Scaler Type, 2025 and 2035
  • Figure 37: Latin America Market Y-o-Y Growth Comparison by Scaler Type, 2025-2035
  • Figure 38: Latin America Market Attractiveness Analysis by Scaler Type
  • Figure 39: Latin America Market Value Share and BPS Analysis by Application, 2025 and 2035
  • Figure 40: Latin America Market Y-o-Y Growth Comparison by Application, 2025-2035
  • Figure 41: Latin America Market Attractiveness Analysis by Application
  • Figure 42: Western Europe Market Value Share and BPS Analysis by Country, 2025 and 2035
  • Figure 43: Western Europe Market Value Share and BPS Analysis by Operational Height , 2025 and 2035
  • Figure 44: Western Europe Market Y-o-Y Growth Comparison by Operational Height , 2025-2035
  • Figure 45: Western Europe Market Attractiveness Analysis by Operational Height
  • Figure 46: Western Europe Market Value Share and BPS Analysis by Scaler Type, 2025 and 2035
  • Figure 47: Western Europe Market Y-o-Y Growth Comparison by Scaler Type, 2025-2035
  • Figure 48: Western Europe Market Attractiveness Analysis by Scaler Type
  • Figure 49: Western Europe Market Value Share and BPS Analysis by Application, 2025 and 2035
  • Figure 50: Western Europe Market Y-o-Y Growth Comparison by Application, 2025-2035
  • Figure 51: Western Europe Market Attractiveness Analysis by Application
  • Figure 52: Eastern Europe Market Value Share and BPS Analysis by Country, 2025 and 2035
  • Figure 53: Eastern Europe Market Value Share and BPS Analysis by Operational Height , 2025 and 2035
  • Figure 54: Eastern Europe Market Y-o-Y Growth Comparison by Operational Height , 2025-2035
  • Figure 55: Eastern Europe Market Attractiveness Analysis by Operational Height
  • Figure 56: Eastern Europe Market Value Share and BPS Analysis by Scaler Type, 2025 and 2035
  • Figure 57: Eastern Europe Market Y-o-Y Growth Comparison by Scaler Type, 2025-2035
  • Figure 58: Eastern Europe Market Attractiveness Analysis by Scaler Type
  • Figure 59: Eastern Europe Market Value Share and BPS Analysis by Application, 2025 and 2035
  • Figure 60: Eastern Europe Market Y-o-Y Growth Comparison by Application, 2025-2035
  • Figure 61: Eastern Europe Market Attractiveness Analysis by Application
  • Figure 62: East Asia Market Value Share and BPS Analysis by Country, 2025 and 2035
  • Figure 63: East Asia Market Value Share and BPS Analysis by Operational Height , 2025 and 2035
  • Figure 64: East Asia Market Y-o-Y Growth Comparison by Operational Height , 2025-2035
  • Figure 65: East Asia Market Attractiveness Analysis by Operational Height
  • Figure 66: East Asia Market Value Share and BPS Analysis by Scaler Type, 2025 and 2035
  • Figure 67: East Asia Market Y-o-Y Growth Comparison by Scaler Type, 2025-2035
  • Figure 68: East Asia Market Attractiveness Analysis by Scaler Type
  • Figure 69: East Asia Market Value Share and BPS Analysis by Application, 2025 and 2035
  • Figure 70: East Asia Market Y-o-Y Growth Comparison by Application, 2025-2035
  • Figure 71: East Asia Market Attractiveness Analysis by Application
  • Figure 72: South Asia and Pacific Market Value Share and BPS Analysis by Country, 2025 and 2035
  • Figure 73: South Asia and Pacific Market Value Share and BPS Analysis by Operational Height , 2025 and 2035
  • Figure 74: South Asia and Pacific Market Y-o-Y Growth Comparison by Operational Height , 2025-2035
  • Figure 75: South Asia and Pacific Market Attractiveness Analysis by Operational Height
  • Figure 76: South Asia and Pacific Market Value Share and BPS Analysis by Scaler Type, 2025 and 2035
  • Figure 77: South Asia and Pacific Market Y-o-Y Growth Comparison by Scaler Type, 2025-2035
  • Figure 78: South Asia and Pacific Market Attractiveness Analysis by Scaler Type
  • Figure 79: South Asia and Pacific Market Value Share and BPS Analysis by Application, 2025 and 2035
  • Figure 80: South Asia and Pacific Market Y-o-Y Growth Comparison by Application, 2025-2035
  • Figure 81: South Asia and Pacific Market Attractiveness Analysis by Application
  • Figure 82: Middle East & Africa Market Value Share and BPS Analysis by Country, 2025 and 2035
  • Figure 83: Middle East & Africa Market Value Share and BPS Analysis by Operational Height , 2025 and 2035
  • Figure 84: Middle East & Africa Market Y-o-Y Growth Comparison by Operational Height , 2025-2035
  • Figure 85: Middle East & Africa Market Attractiveness Analysis by Operational Height
  • Figure 86: Middle East & Africa Market Value Share and BPS Analysis by Scaler Type, 2025 and 2035
  • Figure 87: Middle East & Africa Market Y-o-Y Growth Comparison by Scaler Type, 2025-2035
  • Figure 88: Middle East & Africa Market Attractiveness Analysis by Scaler Type
  • Figure 89: Middle East & Africa Market Value Share and BPS Analysis by Application, 2025 and 2035
  • Figure 90: Middle East & Africa Market Y-o-Y Growth Comparison by Application, 2025-2035
  • Figure 91: Middle East & Africa Market Attractiveness Analysis by Application
  • Figure 92: Global Market - Tier Structure Analysis
  • Figure 93: Global Market - Company Share Analysis

Frequently Asked Questions

How big is the mine scaler market in 2025?

The global mine scaler market is estimated to be valued at USD 1.7 billion in 2025.

What will be the size of mine scaler market in 2035?

The market size for the mine scaler market is projected to reach USD 2.4 billion by 2035.

How much will be the mine scaler market growth between 2025 and 2035?

The mine scaler market is expected to grow at a 3.5% CAGR between 2025 and 2035.

What are the key product types in the mine scaler market?

The key product types in mine scaler market are up to 10 feet, 10 – 25 feet and more than 25 feet.

Which scaler type segment to contribute significant share in the mine scaler market in 2025?

In terms of scaler type, hammer feed scaler segment to command 45.0% share in the mine scaler market in 2025.

Explore Similar Insights

Future Market Insights

Mine Scaler Market

Chat With MaRIA

Chat With

MaRIA

Hi There, I am MaRIA, Your Market Research Intelligence Assistant. How may I help you?