The amine market is projected to grow from USD 43.3 billion in 2025 to USD 109.3 billion by 2035, registering a strong 9.7% CAGR driven by expanding agrochemical, pharmaceutical, gas treatment, and industrial cleaning applications. Ethanol amines account for the largest share at 42%, supported by widespread use in carbon capture solvents, surfactants, and herbicide intermediates, while aliphatic and aromatic amines gain traction in pharmaceutical synthesis, water treatment, and polyurethane production. Petrochemical routes, holding 71% share, remain dominant due to integrated ethylene oxide and ammonia value chains enabling economies of scale, although bio-based and renewable feedstock routes continue to grow as sustainability pressures intensify.
Asia Pacific remains the core growth hub, led by India (11.6% CAGR) and China (11.2% CAGR) as capacity expansions accelerate for agrochemicals, pharmaceuticals, and gas treatment chemicals, while Australia (10.7%), Japan (8.7%), Brazil (6%), the United States (5.5%), and Germany (5.1%) show steady advancement linked to specialty applications and carbon capture initiatives. Competition stays moderately consolidated, with global leaders such as BASF SE, Huntsman International, Eastman Chemical Company, Evonik Industries AG, Solvay, INEOS, and Nouryon focusing on EO-integrated production systems, high-purity specialty grades, and low-emission solvent innovation, while Indian and Chinese players including Alkyl Amines Chemicals Ltd. and Balaji Amines Ltd. strengthen positions through capacity additions, cost-advantaged manufacturing, and domestic supply security.
Industrial applications remain a strong pillar of growth. Amines play a crucial role in gas treatment, particularly in natural gas processing, refinery operations, and petrochemical production, where they are used to remove carbon dioxide and hydrogen sulfide. With increasing natural gas consumption, expansion of refining capacity, and global interest in cleaner-burning fuels, demand for amine-based gas sweetening solutions remains robust. Water treatment is another major industrial area where amines are used for pH adjustment, corrosion inhibition, sludge control, and purification processes. Rapid industrialization, urbanization, and rising water treatment needs ensure consistent demand across municipal and industrial facilities.
One of the strongest market drivers is the pharmaceutical sector. Amines are widely used as intermediates in producing active pharmaceutical ingredients, analgesics, antihistamines, and various chemical synthesis pathways. With global pharmaceutical manufacturing expanding and demand for generic formulations rising, the consumption of high-purity amines continues to increase. Growth in biotechnology, specialty drugs, and advanced synthesis routes further reinforces the need for amine-based intermediates.
Technological developments are also influencing the competitive landscape. Advancements in catalyst engineering, continuous processing, and purification methods are enabling manufacturers to produce amines with improved quality, reduced impurities, and enhanced performance characteristics. These innovations allow the industry to meet the stringent requirements of high-value applications such as electronics, precision coatings, and pharmaceutical synthesis.
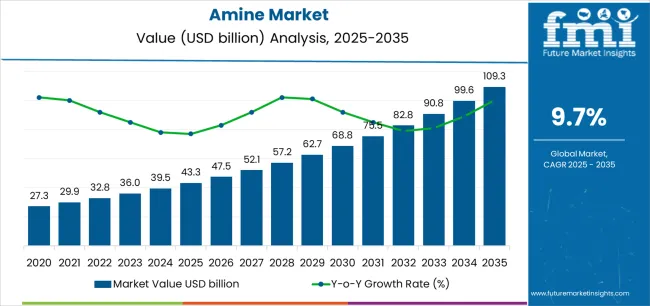
Between 2025 and 2030, the amine market is projected to expand from USD 43.3 billion to USD 69.2 billion, resulting in a value increase of USD 25.9 billion, which represents 39.2% of the total forecast growth for the decade. This phase of development will be shaped by rising demand for agrochemical intermediates supporting global food security initiatives, product innovation in specialty amine formulations and bio-based production routes, as well as expanding integration with carbon capture technologies and advanced water treatment systems. Companies are establishing competitive positions through investment in petrochemical-integrated production platforms, sustainable manufacturing solutions, and strategic market expansion across agrochemical, pharmaceutical, and industrial applications.
From 2030 to 2035, the market is forecast to grow from USD 69.2 billion to USD 109.3 billion, adding another USD 40.1 billion, which constitutes 60.8% of the overall ten-year expansion. This period is expected to be characterized by the expansion of specialized amine derivatives, including high-purity grades for pharmaceutical and electronics applications and bio-renewable feedstock integration, strategic collaborations between chemical manufacturers and end-user industries, and an enhanced focus on low-emission production technologies and circular economy principles. The growing emphasis on carbon capture utilization and storage initiatives and sustainable agrochemical formulations will drive demand for advanced, high-performance amine solutions across diverse industrial applications.
| Metric | Value |
|---|---|
| Market Value (2025) | USD 43.3 billion |
| Market Forecast Value (2035) | USD 109.3 billion |
| Forecast CAGR (2025-2035) | 9.7% |
The amine market grows by enabling manufacturers across agrochemical, pharmaceutical, and industrial sectors to access versatile chemical intermediates essential for herbicide production, drug synthesis, surfactant formulation, and gas treatment applications. Agrochemical producers face mounting pressure to increase crop yields and reduce environmental impact, with amine-based herbicide intermediates providing critical building blocks for glyphosate, glufosinate, and other selective herbicides that support global food security while meeting regulatory requirements. The pharmaceutical industry's expansion creates demand for specialized amine intermediates supporting antibiotic production, cardiovascular drug synthesis, and oncology therapeutic development, while industrial manufacturers require ethanolamines for carbon dioxide capture systems that enable emissions reduction across power generation and natural gas processing facilities.
Government initiatives promoting sustainable agriculture and climate change mitigation drive adoption of amine-based solutions across emerging markets, where domestic production capabilities reduce import dependencies and support chemical industry development. Carbon capture and storage mandates in developed economies encourage adoption of advanced monoethanolamine and methyldiethanolamine solvents for industrial CO₂ removal, creating differentiation opportunities for manufacturers investing in high-purity production technologies. Environmental regulations regarding amine emissions and aquatic toxicity concerns may limit adoption rates among cost-sensitive manufacturers and developing regions with limited wastewater treatment infrastructure.
The market is segmented by product type, end use, technology/route, grade/purity, distribution, and region. By product type, the market is divided into ethanol amines, aliphatic amines, aromatic amines, fatty amines, and specialty & derivatives. Based on end use, the market is categorized into agrochemicals, pharmaceuticals, industrial & home care, water & gas treatment, paints/coatings/dyes & inks, and plastics/polymers & rubber. By technology/route, the market includes petrochemical route and bio-/renewable feedstock routes. By grade/purity, the market is divided into industrial grade, technical grade, and high-purity/specialty. By distribution, the market includes direct/key accounts and distributors/merchant. Regionally, the market is divided into Asia Pacific, North America, Europe, and other key regions.
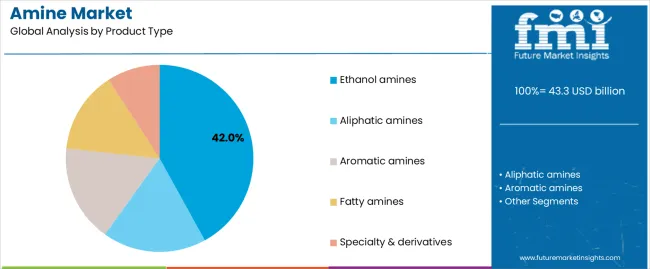
The ethanol amines segment represents the dominant force in the amine market, capturing approximately 42% of total market share in 2025. This advanced category encompasses monoethanolamine (MEA), diethanolamine (DEA), triethanolamine (TEA), and alkyl ethanolamines including dimethylethanolamine and methyldiethanolamine, which serve as critical intermediates for gas treatment, surfactant production, and agrochemical synthesis. The ethanol amines segment's market leadership stems from extensive applications across carbon capture and storage systems, where MEA solutions capture 85-95% of CO₂ from industrial flue gases, and industrial cleaning formulations requiring effective pH control and emulsification properties.
The aliphatic amines segment maintains a substantial 23% market share, serving manufacturers requiring methylamines, ethylamines, propylamines, and butylamines for pharmaceutical synthesis, water treatment biocides, and rubber accelerators. Aromatic amines account for 12% market share through aniline-based polyurethane applications, while fatty amines capture 11% serving mining flotation and asphalt emulsification markets.
Key technological advantages driving the ethanol amines segment include:
Petrochemical route production dominates the amine market with approximately 71% market share in 2025, reflecting established manufacturing infrastructure based on ethylene oxide reactions with ammonia, hydrogenation of nitriles and nitro compounds, and alkylation of ammonia with alcohols or olefins. The petrochemical route segment's market leadership is supported by integrated production complexes offering cost advantages through byproduct utilization, energy integration, and economies of scale at world-class facilities processing thousands of tons annually.
Within the petrochemical route, EO-based routes command 41% of total market share through monoethanolamine, diethanolamine, and triethanolamine production, while hydrogenation/alkylation processes account for 30% serving aliphatic and aromatic amine manufacturing. Bio-/renewable feedstock routes represent 12% market share through emerging fatty amine production from natural oils and biotechnology-derived intermediates.
Key factors supporting petrochemical route dominance include:
Direct/key accounts distribution dominates the amine market with approximately 62% market share in 2025, reflecting chemical manufacturers' preference for long-term supply agreements with major agrochemical producers, pharmaceutical companies, and industrial gas processors consuming bulk quantities. The direct distribution segment's market leadership is supported by integrated logistics systems, technical service relationships, and price stability arrangements that benefit both suppliers and large-volume consumers.
Distributors/merchant channels account for 38% market share serving small and medium-sized manufacturers requiring flexible order quantities, local availability, and technical support for specialty amine grades. This segment benefits from regional distribution networks providing rapid delivery and application development assistance.
Key factors supporting distribution patterns include:
The market is driven by three concrete demand factors tied to industrial manufacturing requirements. First, agrochemical sector expansion and global food security imperatives create increasing demand for herbicide intermediates, with worldwide glyphosate production requiring substantial monoethanolamine and diethanolamine volumes as precursors, while emerging selective herbicides drive specialty amine consumption across maize, soybean, and rice cultivation systems. Second, carbon capture and storage deployment accelerates driven by climate commitments, with industrial facilities adopting amine-based CO₂ removal systems capable of processing millions of tons annually, requiring high-purity monoethanolamine and methyldiethanolamine solvents meeting stringent performance specifications. Third, pharmaceutical industry growth creates sustained demand for specialized amine building blocks, with cardiovascular drugs, antibiotics, and central nervous system therapeutics requiring diverse amine structures from simple aliphatic compounds to complex aromatic derivatives meeting pharmaceutical grade purity standards.
Market restraints include raw material price volatility affecting production economics, particularly ethylene oxide, propylene oxide, and ammonia cost fluctuations that impact integrated amine producers' margins and create competitive pressures during commodity cycle downturns. Environmental regulations regarding amine emissions pose significant challenges, as volatile amine compounds contribute to particulate matter formation and require costly abatement technologies including thermal oxidizers and scrubbing systems that increase operating expenses. Toxicity concerns associated with certain aromatic amines create regulatory barriers, particularly in European markets where REACH regulations impose extensive testing requirements and potential substance restrictions affecting product availability and application development timelines.
Key trends indicate accelerated adoption of bio-based production routes utilizing renewable feedstocks including natural oils and biotechnology platforms that enable sustainable amine synthesis with reduced carbon footprints appealing to environmentally conscious customers. Specialty amine development intensifies as pharmaceutical and electronics industries demand higher purity grades with stringent impurity controls, driving investments in advanced distillation, crystallization, and membrane separation technologies. Regional capacity expansions concentrate in Asia Pacific markets, particularly India and China, where integrated chemical complexes and favorable government policies support domestic production growth serving both local consumption and export opportunities. The market thesis could face disruption if alternative carbon capture technologies including solid sorbents or membrane systems achieve commercial viability, potentially reducing dependence on traditional amine-based CO₂ removal processes.
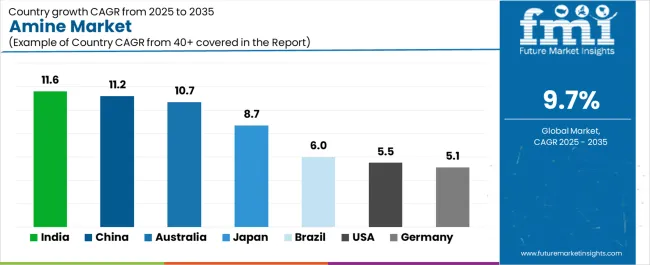
| Country | CAGR (2025-2035) |
|---|---|
| India | 11.6% |
| China | 11.2% |
| Australia | 10.7% |
| Japan | 8.7% |
| Brazil | 6% |
| United States | 5.5% |
| Germany | 5.1% |
The amine market is gaining momentum worldwide, with India taking the lead thanks to rapid capacity additions in aliphatic and specialty amines coupled with strong pharmaceutical and agrochemical manufacturing pipelines. Close behind, China benefits from massive scale in basic and specialty amine production, shifting toward higher-purity derivatives and rising carbon capture demand, positioning itself as the dominant global manufacturing hub. Australia shows impressive advancement, where mining reagent requirements and agrochemical demand drive import substitution strategies and niche specialty production builds.
Japan maintains steady progress through high-purity specialty grades serving pharmaceutical and electronics applications with process intensification and low-emission production targets. Meanwhile, Brazil focuses on agrochemical intermediates tied to soybean and sugarcane production belts, and the United States stands out for carbon dioxide capture solvent deployment and specialty amine development, while Germany continues consistent progress through integrated ethylene oxide complexes. Together, India and China anchor the global expansion story, while the rest build stability and diversity into the market's growth path.
The report covers an in-depth analysis of 40+ countries, the top-performing countries are highlighted below.
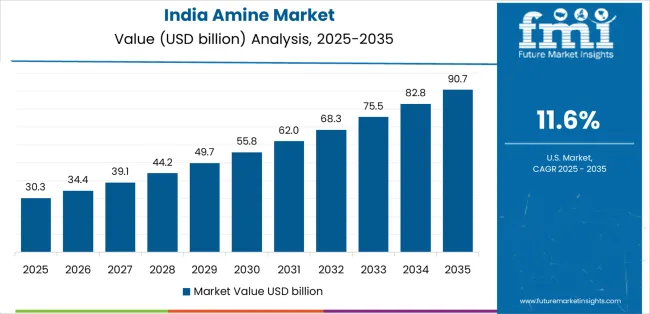
India demonstrates the strongest growth potential in the Amine Market with a CAGR of 11.6% through 2035. The country's leadership position stems from rapid capacity additions in aliphatic and specialty amine production, government Make in India initiatives supporting chemical manufacturing, and aggressive expansion by domestic producers including Balaji Amines and Alkyl Amines Chemicals, driving adoption of advanced synthesis technologies for pharmaceutical intermediates and agrochemical actives.
Growth is concentrated in major chemical clusters, including Gujarat, Maharashtra, Tamil Nadu, and Andhra Pradesh, where amine manufacturers are implementing world-scale production facilities for methylamines, ethanolamines, and specialty derivatives serving domestic pharmaceutical, agrochemical, and export markets. Distribution channels through established chemical supply chains and direct manufacturer relationships expand deployment across API production facilities, herbicide manufacturing plants, and industrial chemical consumers. The country's pharmaceutical leadership strategy and agrochemical self-sufficiency programs provide policy support for amine production capacity development.
Key market factors:
In Jiangsu, Zhejiang, Shandong, and Hebei provinces, the adoption of advanced amine production technologies is accelerating across integrated chemical complexes, pharmaceutical intermediate facilities, and specialty chemical plants, driven by domestic consumption growth and export manufacturing expansion. The market demonstrates strong growth momentum with a CAGR of 11.2% through 2035, linked to comprehensive chemical industry consolidation and increasing focus on higher-purity specialty grades meeting international quality standards.
Chinese manufacturers are implementing advanced synthesis systems and environmental control technologies to enhance product quality while serving growing demand for pharmaceutical intermediates, agrochemical actives, and industrial amines in both domestic and international markets. The country's 14th Five-Year Plan emphasizes chemical industry upgrading and environmental compliance, creating sustained demand for advanced amine production capabilities.
Australia's advanced mining industry demonstrates sophisticated utilization of amine-based flotation reagents, with documented case studies showing enhanced mineral recovery in copper, gold, nickel, and iron ore processing operations through optimized collector and frother formulations. The country's industrial infrastructure in major mining regions, including Western Australia, Queensland, and New South Wales, showcases integration of specialty amine applications with mineral processing systems, leveraging expertise in flotation chemistry and reagent optimization.
Australian manufacturers and importers emphasize supply security and technical service quality, creating demand for reliable amine supplies that support continuous mining operations and metallurgical performance requirements. The market maintains strong growth through focus on import substitution and specialty builds, with a CAGR of 10.7% through 2035.
Key development areas:
Japan's Amine Market demonstrates sophisticated implementation focused on high-purity specialty grades and quality excellence optimization, with documented integration of advanced purification systems achieving pharmaceutical and electronics-grade specifications exceeding 99.9% purity across ethanolamines and aliphatic amine products.
The country maintains steady growth momentum with a CAGR of 8.7% through 2035, driven by manufacturers' emphasis on process intensification methodologies, low-emission production technologies, and continuous improvement programs that align with Japanese manufacturing excellence principles applied to specialty chemical operations. Major industrial regions, including Kanto, Kansai, and Tokai, showcase advanced deployment of precision synthesis platforms where systems integrate seamlessly with existing quality control infrastructure and comprehensive environmental management programs.
Key market characteristics:
Brazil's market expansion is driven by diverse agrochemical demand, including herbicide intermediates for soybean cultivation in Mato Grosso and Paraná, pesticide formulations for sugarcane production in São Paulo and Goiás, and comprehensive crop protection requirements across multiple agricultural regions. The country demonstrates promising growth potential with a CAGR of 6% through 2035, supported by federal agricultural development programs and regional agribusiness expansion initiatives.
Brazilian manufacturers face implementation challenges related to import dependency for basic amine feedstocks and technical expertise availability, requiring technology transfer approaches and international partnership support. Growing agricultural productivity targets and agrochemical self-sufficiency requirements create compelling business cases for amine intermediate production, particularly in regions where herbicide manufacturing supports export competitiveness.
Market characteristics:
The USA market leads in advanced carbon capture applications based on integration with power generation facilities, natural gas processing operations, and emerging direct air capture technologies requiring high-performance amine solvents. The country shows solid potential with a CAGR of 5.5% through 2035, driven by carbon reduction mandates, water treatment infrastructure investments, and specialty amine development across major industrial regions, including Texas Gulf Coast, Louisiana chemical corridor, and Midwest manufacturing centers.
American manufacturers are adopting advanced amine formulations for CO₂ capture optimization and regulatory compliance, particularly in facilities implementing 45Q tax credit programs and state-level emissions reduction requirements. Technology deployment channels through established chemical distributors and direct manufacturer relationships expand coverage across industrial gas treatment, pharmaceutical intermediate production, and specialty chemical applications.
Leading market segments:
In North Rhine-Westphalia, Rhineland, and Bavaria, chemical manufacturing facilities are implementing advanced ethanolamines and alkyl ethanolamines production through world-scale ethylene oxide integration, with documented case studies showing superior economics and environmental performance through heat integration and byproduct utilization. The market shows moderate growth potential with a CAGR of 5.1% through 2035, linked to established chemical industry infrastructure, sustainability-led production upgrades, and emerging gas treatment applications for hydrogen production and natural gas processing. German manufacturers are adopting advanced process control and emissions reduction technologies to enhance operational efficiency while maintaining stringent environmental standards demanded by European regulations.
Market development factors:
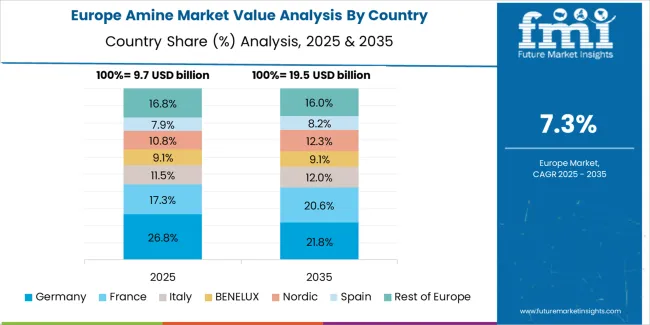
The amine market in Europe is projected to grow from USD 12.2 billion in 2025 to USD 27.7 billion by 2035, registering a CAGR of 8.4% over the forecast period. Germany is expected to maintain its leadership position with a 22% market share in 2025, declining slightly to 21.5% by 2035, supported by large integrated amine and ethylene oxide derivative platforms in North Rhine-Westphalia and Rhineland production facilities.
The Netherlands follows with a 14% share in 2025, projected to reach 14.2% by 2035, driven by its role as a key import-export hub and gas treatment solvent center in the Rotterdam-Antwerp corridor. France holds a 13% share in 2025, expected to maintain 13.1% by 2035 through downstream agrochemical intermediates production. The United Kingdom commands a 12% share, rising to 12.3% by 2035, supported by diversified pharmaceutical and specialty amine demand. Italy accounts for 9% serving coatings and rubber chemicals markets, while Spain holds 7% focused on agrochemical and cleaning applications. The Rest of Europe region is anticipated to account for 23% in 2025, declining slightly to 22.5% by 2035, with Nordic countries and Central/Eastern Europe showing broad-based capacity additions and tighter sustainability requirements.
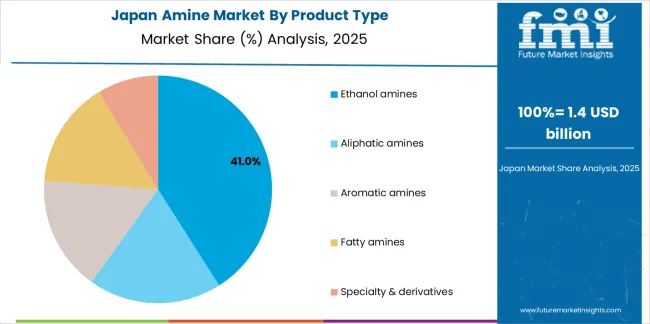
The Japanese Amine Market demonstrates a mature and technology-focused landscape, characterized by sophisticated integration of high-purity amine production systems with existing precision chemical manufacturing infrastructure across pharmaceutical intermediate facilities, electronics materials plants, and specialty chemical production centers. Japan's emphasis on quality excellence and process optimization drives demand for pharmaceutical-grade and electronics-grade amines that support domestic producers including Takeda, Astellas, and major electronics manufacturers in maintaining strict quality standards and regulatory compliance for API synthesis and semiconductor processing applications.
The market benefits from strong partnerships between international amine providers like BASF, Huntsman, and domestic specialty chemical leaders, including Mitsubishi Chemical, Mitsui Chemicals, and Tosoh Corporation, creating comprehensive service ecosystems that prioritize purity consistency and complete analytical documentation programs. Manufacturing centers in Kawasaki, Ichihara, and Mizushima showcase advanced quality control implementations where amine production achieves 99.9%+ purity through integrated distillation and analytical monitoring programs.
The South Korean Amine Market is characterized by strong international technology provider presence, with companies like BASF SE, Huntsman International, and Eastman Chemical maintaining significant positions through comprehensive technical support and supply chain capabilities for industrial gas treatment and pharmaceutical applications. The market is demonstrating growing emphasis on carbon capture solvent development and ultra-high-purity pharmaceutical intermediate capabilities, as Korean manufacturers increasingly demand specialized amine solutions that integrate with domestic power generation infrastructure, LNG processing facilities, and pharmaceutical manufacturing complexes operated across major industrial groups.
Local chemical companies and regional specialty producers are gaining market share through strategic partnerships with global amine suppliers, offering specialized services including Korean regulatory compliance support and technical application programs for gas treatment systems. The competitive landscape shows increasing collaboration between multinational chemical companies and Korean industrial conglomerates, creating hybrid service models that combine international chemical expertise with local manufacturing capabilities and environmental management systems.
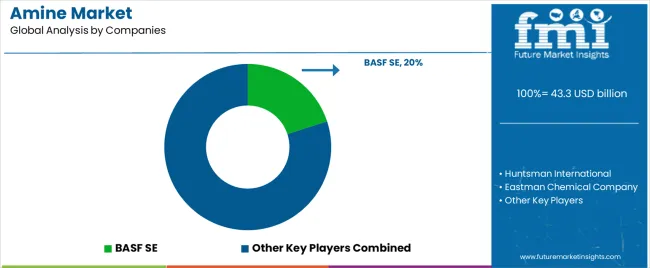
The Amine Market exhibits a moderately concentrated competitive landscape with an estimated 25–35 global producers, where the top three participants collectively account for roughly 22 percent of total market share. Market leadership is shaped by integrated petrochemical feedstock advantages, established production technologies, diversified amine portfolios, and long-term customer qualification cycles that limit rapid shifts in supplier preference. Competition centers on consistency of purity grades, backward integration into ethylene oxide and ammonia value chains, and capabilities in application development rather than simple price-driven differentiation.
BASF SE, Huntsman International, and Eastman Chemical Company hold leading positions supported by global manufacturing footprints, strong access to ethylene oxide and specialty intermediates, and deep expertise in ethanolamines, isopropanolamines, and specialty amines used across agrochemicals, gas treatment, detergents, and polymer additives. Their strong technical service platforms, proprietary process technologies, and long-standing relationships with downstream formulators create high switching costs for customers and provide resilience against regional competition.
Second-tier challengers include Celanese Corporation, Evonik Industries AG, Solvay S.A., INEOS, and Nouryon, each maintaining strength in selected amine chemistries or regional supply hubs. These companies differentiate through specialization in high-purity amines, alkylamines, derivatives for pharma and coatings, and customized solutions aligned to end-user performance requirements. Their ability to integrate amines into broader specialty chemical portfolios provides strategic cross-segment leverage.
Emerging and regional producers such as Alkyl Amines Chemicals Ltd. and Balaji Amines Ltd. continue to strengthen their presence in South Asia through efficient production economics, domestic feedstock advantages, and strong regulatory alignment. Meanwhile, global chemical majors including Dow Chemical Company, Akzo Nobel N.V., Arkema S.A., and Mitsubishi Chemical Corporation compete through selective participation in niche amine segments, leveraging broader specialty chemical ecosystems and customer relationships. The evolving market continues to reward producers that combine integrated manufacturing, reliable logistics, and deep application expertise across the complete value chain.
Amines represent versatile chemical intermediates that enable manufacturers to achieve critical functionality across herbicide synthesis, pharmaceutical production, carbon capture systems, and industrial cleaning formulations, delivering superior reactivity and application performance essential for global food security, healthcare, and environmental protection. With the market projected to grow from USD 43.3 billion in 2025 to USD 109.3 billion by 2035 at a 9.7% CAGR, these chemical compounds offer compelling advantages - diverse structural options from simple alkylamines to complex ethanolamines, established production routes, and proven performance characteristics - making them essential for agrochemicals applications (35% market share), pharmaceuticals (18% share), and industrial & home care seeking effective chemical building blocks that cannot be easily substituted.
How Governments Could Spur Local Production and Adoption?
How Industry Bodies Could Support Market Development?
How OEMs and Technology Players Could Strengthen the Ecosystem?
How Suppliers Could Navigate the Shift?
How Investors and Financial Enablers Could Unlock Value?
| Item | Value |
|---|---|
| Quantitative Units | USD 43.3 billion |
| Product Type | Ethanol amines (Monoethanolamine, Diethanolamine, Triethanolamine, Alkyl ethanolamines), Aliphatic amines, Aromatic amines, Fatty amines, Specialty & derivatives |
| End Use | Agrochemicals (Herbicide intermediates, Pesticide/formulation aids, Fertilizer additives), Pharmaceuticals, Industrial & Home Care, Water & Gas Treatment, Paints/Coatings/Dyes & Inks, Plastics/Polymers & Rubber |
| Technology/Route | Petrochemical route (EO-based routes, Hydrogenation/alkylation), Bio-/renewable feedstock routes, Catalytic specialty routes |
| Grade/Purity | Industrial grade, Technical grade, High-purity/specialty |
| Distribution | Direct/key accounts, Distributors/merchant |
| Regions Covered | Asia Pacific, North America, Europe, Latin America, Middle East & Africa |
| Country Covered | India, China, Australia, Japan, Brazil, United States, Germany, and 40+ countries |
| Key Companies Profiled | BASF SE, Huntsman International, Eastman Chemical Company, Celanese Corporation, Evonik Industries AG, Solvay S.A., INEOS, Nouryon, Alkyl Amines Chemicals Ltd., Balaji Amines Ltd., Dow Chemical Company, Akzo Nobel N.V., Arkema S.A., Mitsubishi Chemical Corporation |
| Additional Attributes | Dollar sales by product type, end use, technology/route, grade/purity, and distribution categories, regional adoption trends across Asia Pacific, North America, and Europe, competitive landscape with integrated chemical producers and specialty manufacturers, manufacturing facility requirements and petrochemical integration specifications, applications in agrochemical intermediates, carbon capture systems, and pharmaceutical synthesis, innovations in bio-based production routes and high-purity purification technologies, and development of specialized formulations with enhanced performance and environmental sustainability characteristics. |
The global amine market is estimated to be valued at USD 43.3 billion in 2025.
The market size for the amine market is projected to reach USD 109.3 billion by 2035.
The amine market is expected to grow at a 9.7% CAGR between 2025 and 2035.
The key product types in amine market are ethanol amines, aliphatic amines, aromatic amines, fatty amines and specialty & derivatives.
In terms of technology/route, petrochemical route segment to command 71.0% share in the amine market in 2025.


Our Research Products

The "Full Research Suite" delivers actionable market intel, deep dives on markets or technologies, so clients act faster, cut risk, and unlock growth.

The Leaderboard benchmarks and ranks top vendors, classifying them as Established Leaders, Leading Challengers, or Disruptors & Challengers.

Locates where complements amplify value and substitutes erode it, forecasting net impact by horizon

We deliver granular, decision-grade intel: market sizing, 5-year forecasts, pricing, adoption, usage, revenue, and operational KPIs—plus competitor tracking, regulation, and value chains—across 60 countries broadly.

Spot the shifts before they hit your P&L. We track inflection points, adoption curves, pricing moves, and ecosystem plays to show where demand is heading, why it is changing, and what to do next across high-growth markets and disruptive tech

Real-time reads of user behavior. We track shifting priorities, perceptions of today’s and next-gen services, and provider experience, then pace how fast tech moves from trial to adoption, blending buyer, consumer, and channel inputs with social signals (#WhySwitch, #UX).

Partner with our analyst team to build a custom report designed around your business priorities. From analysing market trends to assessing competitors or crafting bespoke datasets, we tailor insights to your needs.
Supplier Intelligence
Discovery & Profiling
Capacity & Footprint
Performance & Risk
Compliance & Governance
Commercial Readiness
Who Supplies Whom
Scorecards & Shortlists
Playbooks & Docs
Category Intelligence
Definition & Scope
Demand & Use Cases
Cost Drivers
Market Structure
Supply Chain Map
Trade & Policy
Operating Norms
Deliverables
Buyer Intelligence
Account Basics
Spend & Scope
Procurement Model
Vendor Requirements
Terms & Policies
Entry Strategy
Pain Points & Triggers
Outputs
Pricing Analysis
Benchmarks
Trends
Should-Cost
Indexation
Landed Cost
Commercial Terms
Deliverables
Brand Analysis
Positioning & Value Prop
Share & Presence
Customer Evidence
Go-to-Market
Digital & Reputation
Compliance & Trust
KPIs & Gaps
Outputs
Full Research Suite comprises of:
Market outlook & trends analysis
Interviews & case studies
Strategic recommendations
Vendor profiles & capabilities analysis
5-year forecasts
8 regions and 60+ country-level data splits
Market segment data splits
12 months of continuous data updates
DELIVERED AS:
PDF EXCEL ONLINE
Amine Based Carbon Capture Market Size and Share Forecast Outlook 2025 to 2035
Amine Oxide Market Size and Share Forecast Outlook 2025 to 2035
Amine Hardener Market Trend Analysis Based on Product, End-Use, and Region 2025 to 2035
Amine Additives in Paints and Coatings Market
Diamine Oxidase Enzyme Market Size and Share Forecast Outlook 2025 to 2035
Thiamine Market Size and Share Forecast Outlook 2025 to 2035
Melamine Formaldehyde (MF) Market Size and Share Forecast Outlook 2025 to 2035
Melamine Market Size and Share Forecast Outlook 2025 to 2035
Global Melamine Beauty Product Market Analysis - Size and Share Forecast Outlook 2025 to 2035
Melamine Pyrophosphate Market Trends – Demand, Innovations & Forecast 2025 to 2035
Dopamine and Norepinephrine Reuptake Inhibitor Market
Melamine Foam Market
Glutamine Market – Growth, Demand & Functional Health Benefits
Histamine Toxicity Market
Ethylamine Market Analysis - Size, Share & Forecast 2025 to 2035
Amidoamine Market Trend Analysis Based on Product, End-Use, and Region 2025 to 2035
Benzylamine Market Size and Share Forecast Outlook 2025 to 2035
Glucosamine Supplement Market Size and Share Forecast Outlook 2025 to 2035
Fatty Amine Market Analysis by Product Type, End Use, and Region Forecast Through 2035
Methylamine Market Growth – Trends & Forecast 2024-2034

Thank you!
You will receive an email from our Business Development Manager. Please be sure to check your SPAM/JUNK folder too.
Chat With
MaRIA