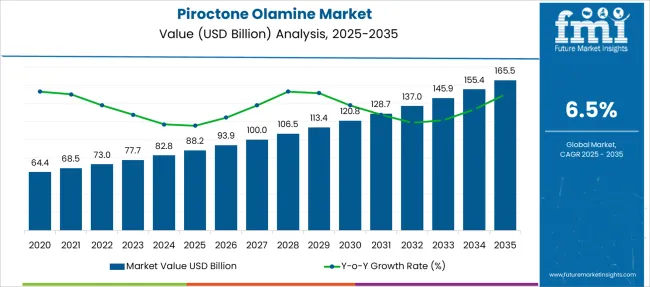
The Piroctone Olamine Market is estimated to be valued at USD 88.2 billion in 2025 and is projected to reach USD 165.5 billion by 2035, registering a compound annual growth rate (CAGR) of 6.5% over the forecast period.
| Metric | Value |
|---|---|
| Piroctone Olamine Market Estimated Value in (2025 E) | USD 88.2 billion |
| Piroctone Olamine Market Forecast Value in (2035 F) | USD 165.5 billion |
| Forecast CAGR (2025 to 2035) | 6.5% |
The piroctone olamine market is witnessing steady growth, supported by increasing demand for effective, skin-compatible antifungal agents in personal care formulations. Rising awareness regarding scalp health, coupled with regulatory shifts favoring alternatives to zinc pyrithione, is accelerating adoption in cosmetic applications.
Manufacturers are focusing on high-purity ingredient sourcing and customized formulation compatibility, particularly in the hair care segment. Expanding consumer preference for sulfate-free, paraben-free, and dermatologically tested products has strengthened interest in piroctone olamine due to its proven antifungal efficacy and mildness on sensitive skin.
Continuous R&D efforts aimed at boosting bioavailability, product stability, and performance in aqueous and oil-based systems are expected to further enhance usage across skincare and haircare portfolios. With premium brands shifting toward clinically backed ingredients, long-term growth is likely to be driven by dermatology-supported claims, clean-label positioning, and high-performance efficacy in anti-dandruff and anti-seborrheic treatments.
The market is segmented by Purity and Application and region. By Purity, the market is divided into ≥ 99% and < 99%. In terms of Application, the market is classified into Hair Care, Cosmetics, Deodorants, Washing Products, and Others. Regionally, the market is classified into North America, Latin America, Western Europe, Eastern Europe, Balkan & Baltic Countries, Russia & Belarus, Central Asia, East Asia, South Asia & Pacific, and the Middle East & Africa.
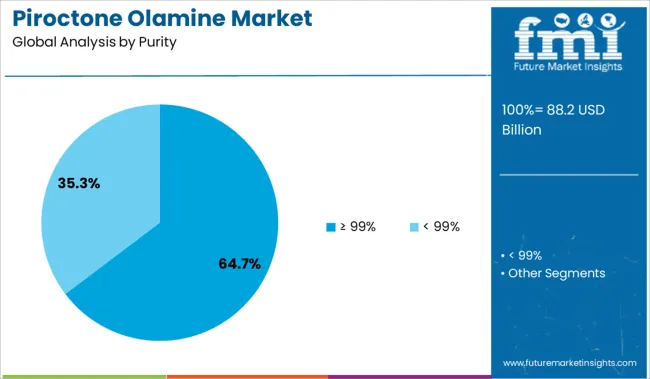
The ≥ 99% purity segment is projected to account for 64.70% of the total market share in 2025, making it the dominant category by purity. This leadership has been driven by regulatory pressure on impurity limits, as well as manufacturer emphasis on formulating with ultra-pure ingredients to reduce irritation and improve efficacy.
High-purity piroctone olamine has demonstrated superior stability in emulsions and water-based solutions, making it ideal for use in sensitive skin and scalp formulations. As demand rises for dermatologically approved and hypoallergenic personal care products, formulators are prioritizing ingredients with consistent purity profiles.
The segment has also benefited from growing exports to North America and Europe, where high purity benchmarks are required for market access. Enhanced shelf life and compatibility with green formulation guidelines are further strengthening demand for ≥ 99% purity material across global hair and skincare portfolios.
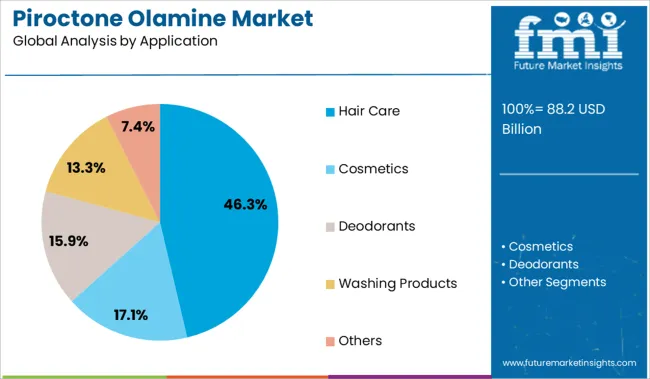
The hair care segment is expected to lead the piroctone olamine market with a projected share of 46.30% in 2025. This prominence is being reinforced by the ingredient’s proven antifungal activity against Malassezia species, a common cause of dandruff and scalp irritation.
Hair care formulations including shampoos, conditioners, and leave-in treatments have increasingly adopted piroctone olamine as a preferred active over conventional alternatives due to its efficacy at low concentrations and favorable safety profile. The surge in consumer demand for targeted scalp solutions, especially in premium and therapeutic segments, has led brands to incorporate clinically validated actives that align with wellness and performance claims.
Additionally, increased penetration of piroctone olamine in both mass and luxury hair care segments has been supported by its compatibility with other active ingredients such as biotin, caffeine, and niacinamide. The expanding reach of dermocosmetic brands through e-commerce and pharmacy channels continues to drive demand within this category.
The demand for piroctone olamine grew at a 2.9% CAGR between 2020 and 2024. As per the report, sales of piroctone olamine are slated to increase at a 6.5% CAGR over the assessment period.
Piroctone olamine is a powerful ingredient that fights dandruff at its source. Along with this, it is used as a preservative and thickening agent that increases the shelf life of products and prevents the growth of germs in cosmetics products.
It is a transparent formulation that is easy to formulate and has excellent pH and temperature stability, making it an ideal ingredient in various cosmetics products. In addition to this, piroctone olamine is an odor-eliminating agent, it is frequently used in deodorants to get rid of the body’s unpleasant odor. It's also used in soaps and other cleaning goods.
The rising application of piroctone olamine in various personal care products and other applications is expected to create opportunities for growth for players operating in the market over the forecast period.
The rising incidence of genus Malassezia globose on the scalp which causes dandruff due to changing weather and increasing stress levels are boosting demand for anti-dandruff and anti-hair fall products.
According to a study, almost 50% of the adult population across the globe is suffering from dandruff problems.
In response to this, manufacturers are transitioning into anti-dandruff shampoos and other product ranges. Increasing production of anti-dandruff shampoos is expected to create opportunities for sales of anti-dandruff ingredients over the forecast period.
Piroctone Olamine is a powerful ingredient that fights dandruff at its source. It also has a unique molecular composition that makes it very easy to dissolve in shampoo formula which makes it an ideal choice for shampoo manufacturers. This is expected to fuel sales of piroctone olamine in the hair care industry in the forthcoming years.
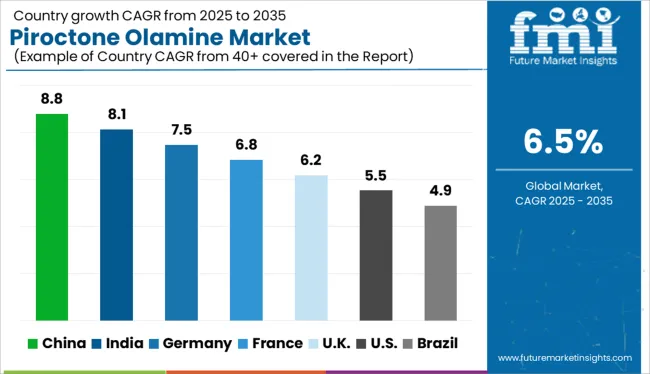
Surging Demand for Piroctone Olamine Creams in China Will Augment Growth
The cosmetic industry is growing rapidly in China and consumers are highly receptive to skincare and makeup products. Growing disposable income, increasing urbanization, and social media influence is propelling growth in the beauty and cosmetics sector.
Piroctone Olamine has a wide range of applications in the cosmetic industry. Rapid expansion, along with increasing sales of beauty and personal care products through online channels in China will augment the growth in the market over the forecast period.
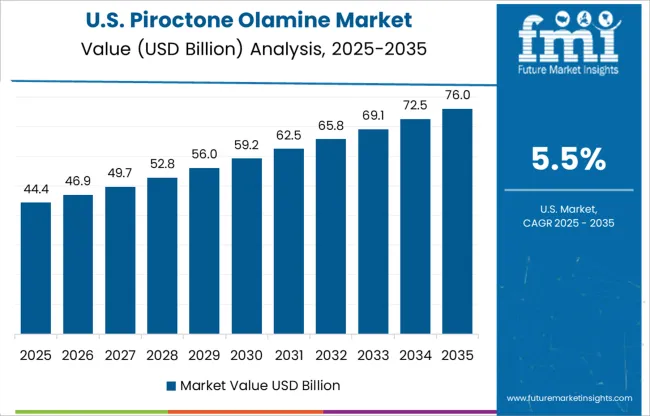
Rising Awareness Regarding Skin Benefits of Piroctone Olamine in the USA Will Boost Sale
An increasing number of beauty clinics and high demand for makeup products in the USA is driving the cosmetic sector in the USA This is expected to have a direct impact on sales of piroctone olamine over the forecast period.
Increasing awareness of the benefits of piroctone olamine on the skin will boost the USA market in the forthcoming years. In addition to this, the increasing number of factories, vehicles, and power plants is elevating the pollution levels in the USA, which causes dandruff and other skin-related issues.
Piroctone Olamine ingredients have applications in antidandruff shampoos and skin care products. Increasing demand for antidandruff solutions and cosmetics products is expected to propel the growth in the USA piroctone olamine market.
Demand for >99% Piroctone Olamine Will Bolster
Piroctone Olamine with ≥99% purity has extensive applications in anti-dandruff shampoos and other hair care solutions, creams, rinses, lotions, and skincare products. The compound with 99% purity or higher also helps in increasing the shelf life of cosmetic products and prevents the growth of germs.
In addition to this, it is used as a smell-eliminating agent in deodorants, perfumes, and washing products such as detergents and soaps.
Increasing Adoption of Piroctone Olamine in Cosmetic Products Will Fuel Sales
Piroctone Olamine is used as a preservative and thickening agent that helps to increase the shelf life of products and prevents the growth of germs in cosmetics products. It is an active ingredient, and it can be used in creams, lotions, and cleansers.
When used with other ingredients, piroctone olamine can effectively reduce erythema, scaling, burning, and stinging sensations in cosmetics products.
It also has excellent pH and temperature stability and can also be employed in various anti-acne products such as gels, lotion, and cleansers. Sales in the cosmetics segment are anticipated to increase at a CAGR of 5.9% during the forecast period, reaching about USD 165.5 Million by end of the year 2035.
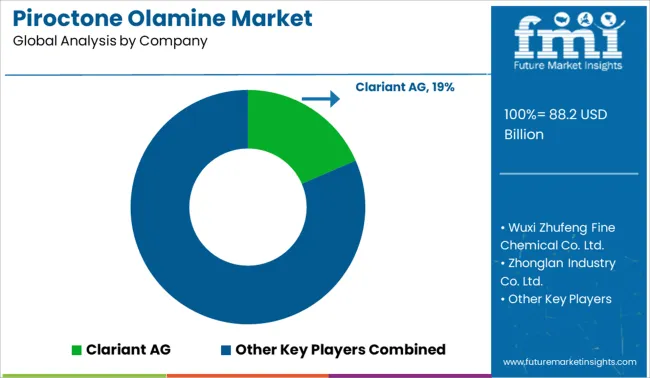
Key players are strengthening their positions in the market by expanding their production capacities. Only a few market players control the majority of the market share in the global piroctone olamine market.
As the market has become more consolidated, prices have risen. Manufacturers are investing in research and development to reduce the production and procurement cost of piroctone olamine.
| Attributes | Details |
|---|---|
| Estimated Market Size (2025) | USD 88.2 billion |
| Projected Market Valuation (2035) | USD 165.5 billion |
| Value-based CAGR (2025 to 2035) | 6.5% |
| Forecast Period | 2025 to 2035 |
| Historical Data Available for | 2020 to 2024 |
| Market Analysis | USD Million for Value and Kgs for Volume |
| Key Regions Covered | North America; Latin America; Europe; East Asia; South Asia & Pacific; Middle East & Africa. |
| Key Segments Covered | Purity, Application, Region |
| Key Companies Profiled | Clariant AG; Lonza Group; Wuxi Zhufeng Fine Chemical Co., Ltd.; Kumar organic product limited; Somu Group; Zhonglan Industry Co. Ltd.; YanTai Aurora Chemical Co. Ltd.; Spec Chem Industry Inc.; Shandong Chuangying Chemical Co. Ltd. |
| Report Coverage | Market Forecast, Company Share Analysis, Competition Intelligence, Drivers, Restraints, Opportunities and Threats Analysis, Market Dynamics and Challenges, and Strategic Growth Initiatives |
The global piroctone olamine market is estimated to be valued at USD 88.2 billion in 2025.
The market size for the piroctone olamine market is projected to reach USD 165.5 billion by 2035.
The piroctone olamine market is expected to grow at a 6.5% CAGR between 2025 and 2035.
The key product types in piroctone olamine market are ≥ 99% and < 99%.
In terms of application, hair care segment to command 46.3% share in the piroctone olamine market in 2025.


Full Research Suite comprises of:
Market outlook & trends analysis
Interviews & case studies
Strategic recommendations
Vendor profiles & capabilities analysis
5-year forecasts
8 regions and 60+ country-level data splits
Market segment data splits
12 months of continuous data updates
DELIVERED AS:
PDF EXCEL ONLINE
Catecholamines Market Size and Share Forecast Outlook 2025 to 2035
Global Catecholamine Market Analysis – Size, Share & Forecast 2024-2034
Diethanolamine Market Growth - Trends & Forecast 2025 to 2035
Monoisopropanolamine Market

Thank you!
You will receive an email from our Business Development Manager. Please be sure to check your SPAM/JUNK folder too.
Chat With
MaRIA